Precise Trend Reversal Moving Average Crossover Strategy
Author: ChaoZhang, Date: 2024-01-22 12:14:29Tags:

Overview
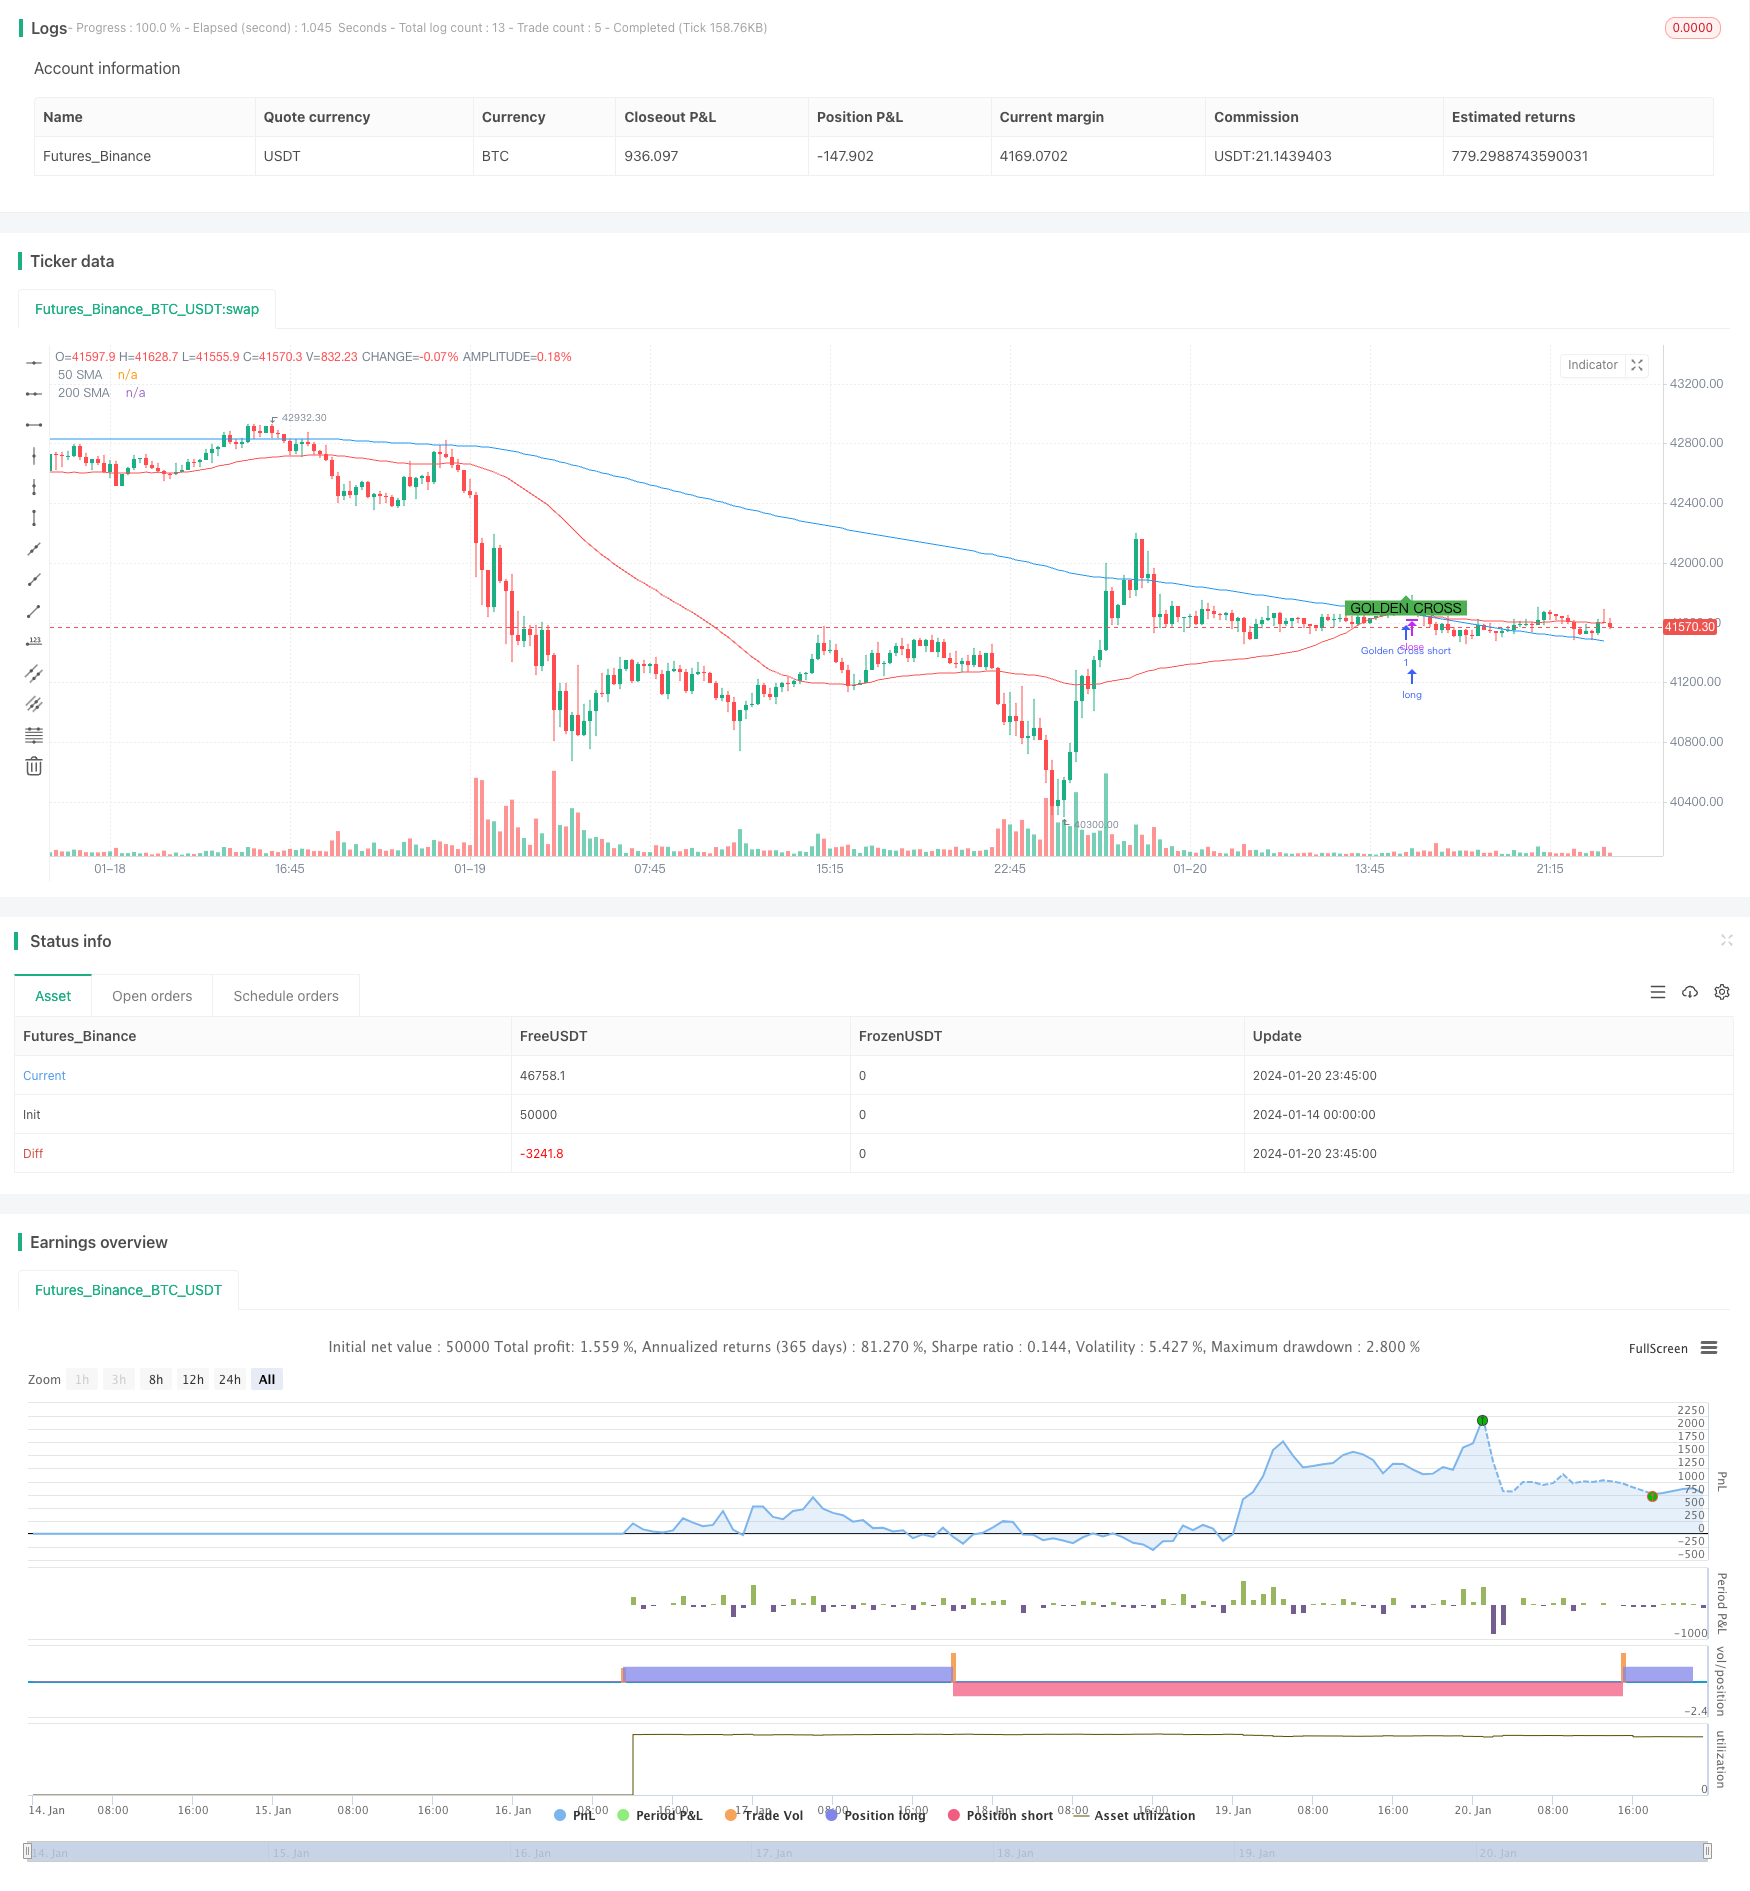
This strategy is named “Golden Cross Death Cross Strategy”. Its core idea is to capitalize on the powerful signals generated by the golden cross and death cross of two moving averages of different timeframes to catch trend reversals in the market and profit from low-buying/high-selling.
Strategy Logic
In this strategy, we calculate the 50-period and 200-period Simple Moving Average (SMA) lines. Traditionally, when the 50-day SMA crosses below the 200-day SMA, it is called a “death cross” which signals a bearish outlook. And when 50-day SMA crosses above 200-day SMA, it is a “golden cross” indicating bullishness.
The trading logic is simply to take positions based on these signals - shorting at death cross and going long at golden cross. This allows us to profit around inflection points when market trend reverses.
In addition, the strategy provides customizable date ranges for backtests. So we can examine the actual effectiveness of these crossover signals over different periods.
Advantages
- Effectively catches trend reversal points to open positions near key areas
- Combination of two SMAs of different periods filters out false signals
- Backtesting feature examines actual performance across market regimes
- Clean plots visually display crossover signals and position changes
Risks
- SMA crosses lag extreme reversals and cannot predict them
- Backtest data may differ from live performance due to costs and slippage
- Parameter selections like SMA periods greatly affect results
- Need to incorporate fundamentals and technicals, not just mechanical trading
To address the risks, we can optimize parameters, add filters, manage risk, paper trade the strategy etc. to minimize risks.
Enhancement Opportunities
The main ways to optimize this strategy include:
- Testing SMAs of different period combinations
- Adding filters like volume, volatility to avoid whipsaws
- Incorporating economic data or news for filter
- Implement stop loss mechanisms like moving/time stops
- Evaluating performance over different holding periods
By examining the parameter impacts, we can discover better moving average crossover systems.
Conclusion
This strategy leverages the classic technical indicator of moving average crosses to capture key inflection points in markets. With simple logic and convenient backtest features, it can aid in tracking trends as part of a broader system. But real-world trading still requires considering various external factors, not just relying on signals blindly.
/*backtest
start: 2024-01-14 00:00:00
end: 2024-01-21 00:00:00
period: 15m
basePeriod: 5m
exchanges: [{"eid":"Futures_Binance","currency":"BTC_USDT"}]
*/

//@version=5
strategy("[S_R__9] - Death and Golden Cross", overlay=true)

// Specific Time Date Range For Backtest
startDate = input.int(title='Start Date', defval=1, minval=1, maxval=31, group='DATE CONFIG')
startMonth = input.int(title='Start Month', defval=1, minval=1, maxval=12, group='DATE CONFIG')
startYear = input.int(title='Start Year', defval=2023, minval=1800, maxval=2100, group='DATE CONFIG')

endDate = input.int(title='End Date', defval=31, minval=1, maxval=31, group='DATE CONFIG')
endMonth = input.int(title='End Month', defval=12, minval=1, maxval=12, group='DATE CONFIG')
endYear = input.int(title='End Year', defval=2023, minval=1800, maxval=2100, group='DATE CONFIG')

SPECIFIC_DATE = input.bool(title='USE SPECIFIC DATE ?', defval=false, group='DATE CONFIG')

inDateRange = SPECIFIC_DATE ? time >= timestamp(syminfo.timezone, startYear, startMonth, startDate, 0, 0) and time < timestamp(syminfo.timezone, endYear, endMonth, endDate, 0, 0) : true

// Calculate 50 SMA and 200 SMA
sma50 = ta.sma(close, 50)
sma200 = ta.sma(close, 200)

// Detect a Death Cross (50 SMA crossing below 200 SMA)
deathCross = ta.crossunder(sma50, sma200)
// Detect a Golden Cross (50 SMA crossing above 200 SMA)
goldenCross = ta.crossover(sma50, sma200)

// Strategy Execution
if (inDateRange)
    if (deathCross)
        strategy.entry("Death Cross long", strategy.short)

    if (goldenCross)
        strategy.entry("Golden Cross short", strategy.long)

// Plot SMAs
plot(sma50, color=color.red, title="50 SMA")
plot(sma200, color=color.blue, title="200 SMA")

// Plotting Death Cross signal
plotshape(series=deathCross and inDateRange, title="Death Cross Signal", location=location.belowbar, color=color.red, style=shape.labeldown, text="DEATH CROSS")

// Plotting Golden Cross signal
plotshape(series=goldenCross and inDateRange, title="Golden Cross Signal", location=location.abovebar, color=color.green, style=shape.labelup, text="GOLDEN CROSS")
- Trend Tracking Breakout Strategy
- Reversal RSI Trend Tracking ETF Trading Strategy
- Trend Tracking and Short-term Trading Strategy Based on ADX Indicator
- Momentum Trend Dual Strategy
- Dynamic CCI Support and Resistance Strategy
- QQE Momentum Trading Strategy
- The Gauss Wave Forecasting Strategy
- Dynamic Moving EMAs Combination Quant Strategy
- Donchian Channel Trend Following Strategy
- EMA Ribbon Strategy
- Multi-EMA Bullish Trend Strategy
- S&P500 Hybrid Seasonal Trading Strategy
- Deviation-Based Trend Tracking Strategy
- RSI Divergence Trading Strategy
- Multi-Indicator Decision Tree Strategy: IMACD, EMA and Ichimoku
- MACD Double Optimization Trading Strategy
- Dual EMA Golden Cross Strategy
- Multi-timeframe RSI and Moving Average Trading Strategy
- Weekly Swing Trading Strategy
- EVWMA based MACD Trading Strategy