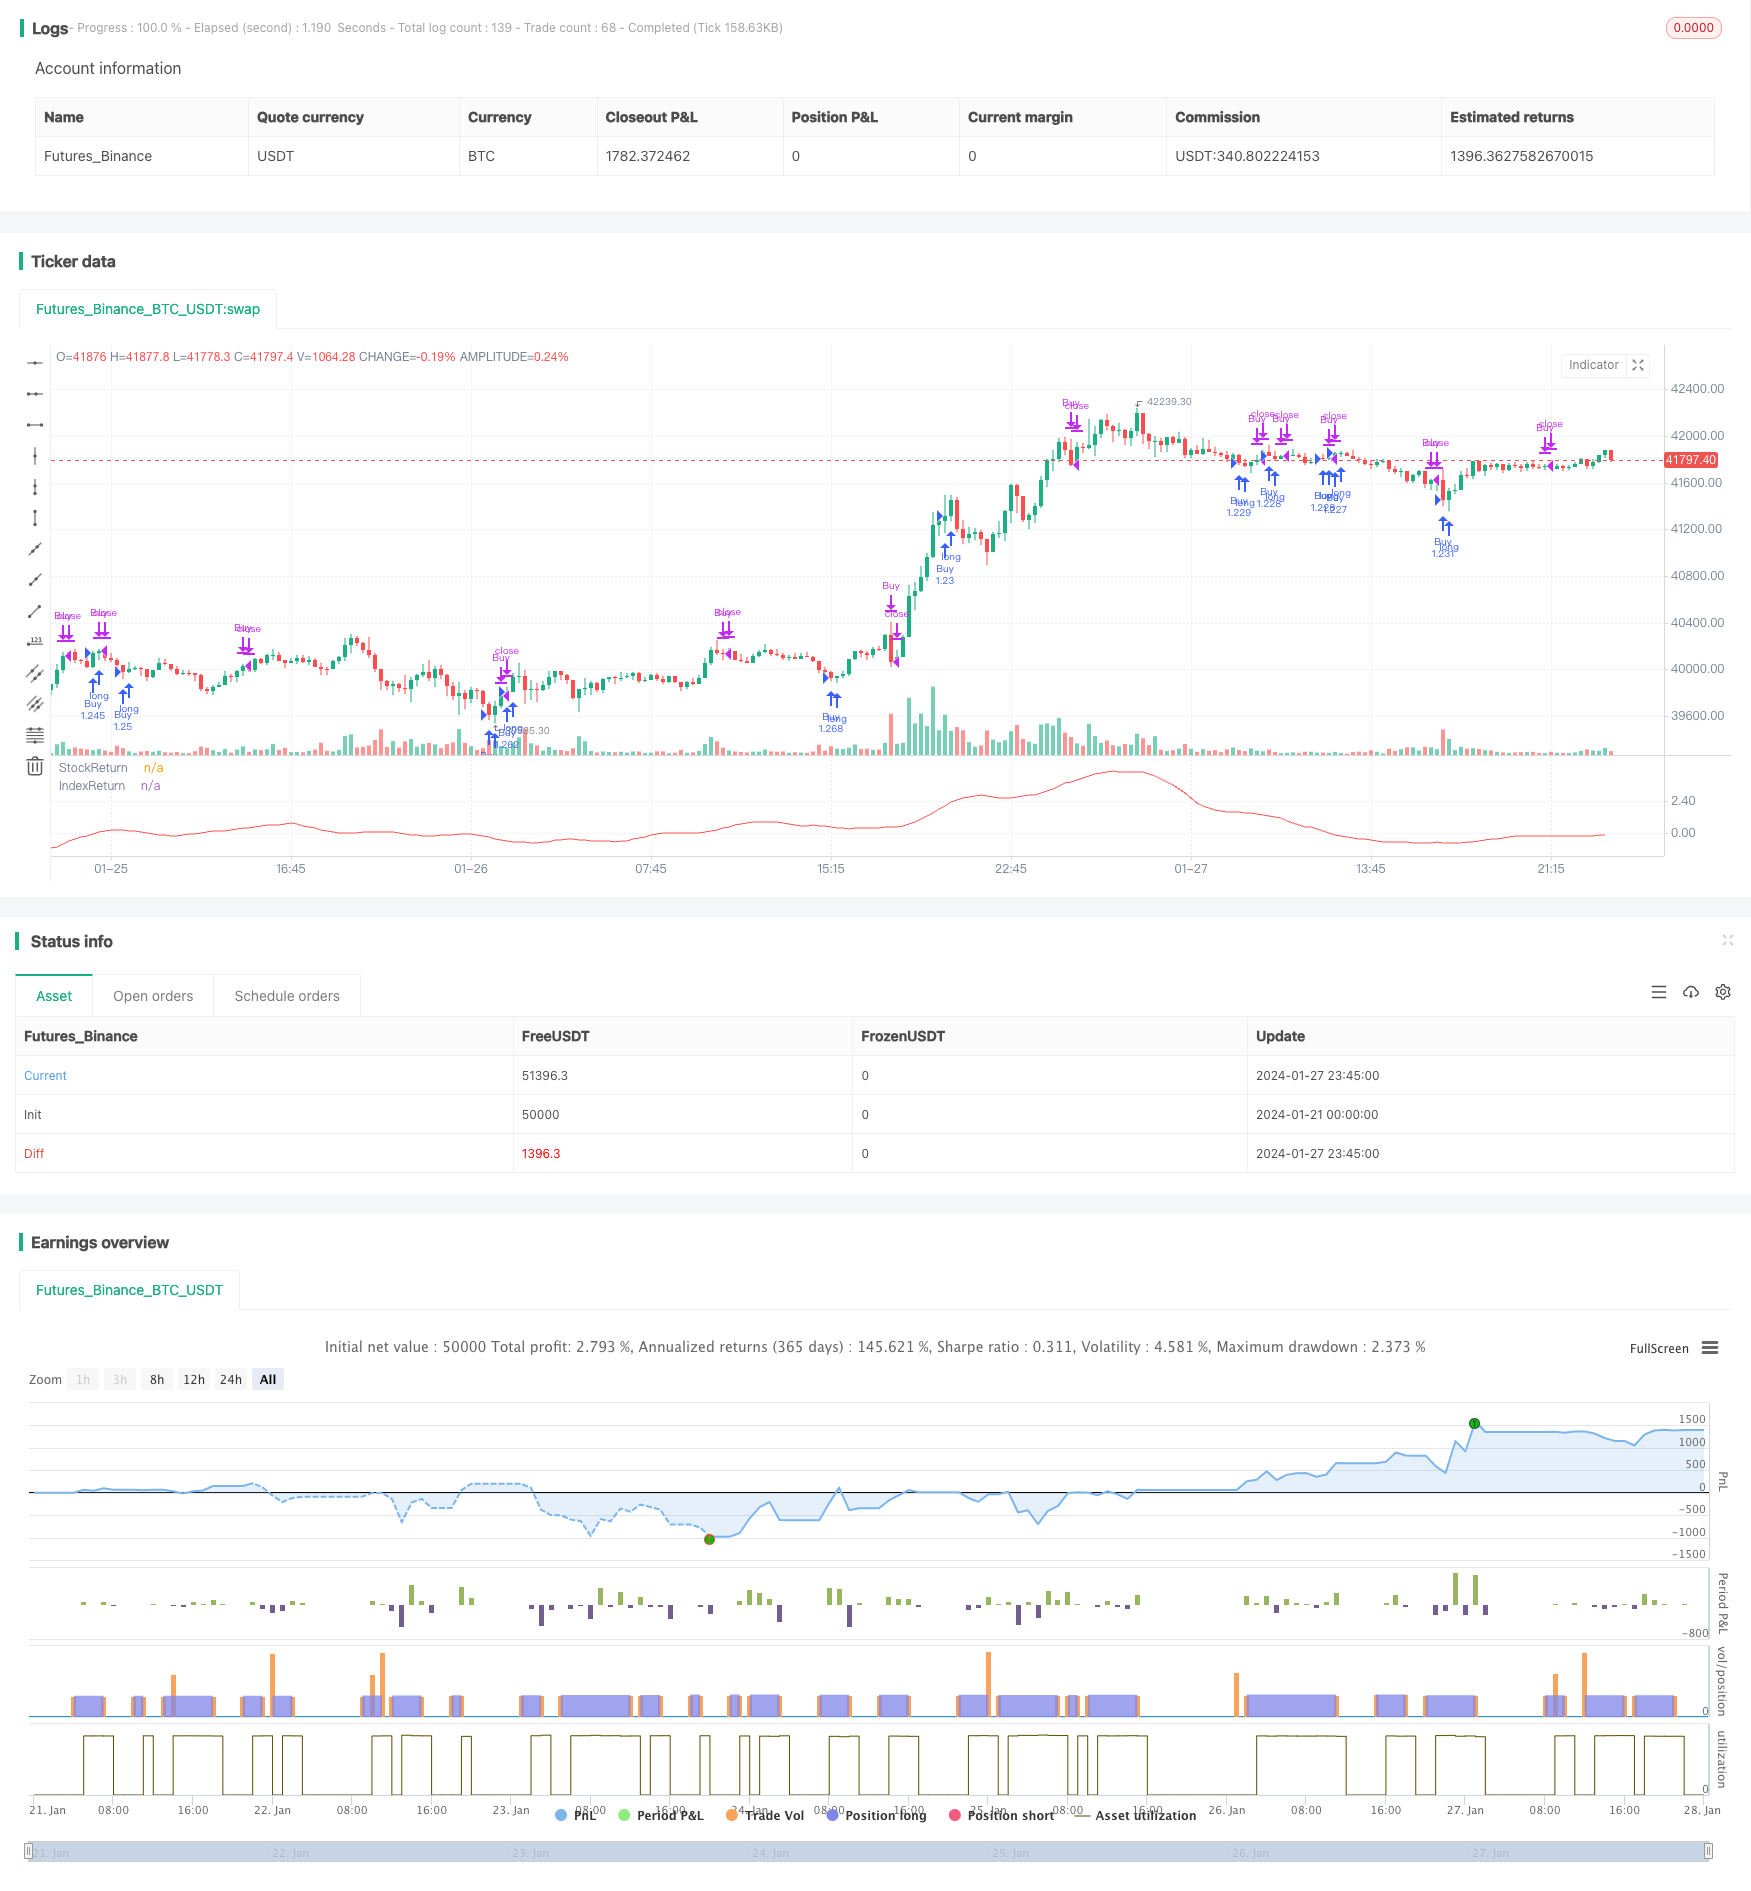
The relative momentum strategy
Author: ChaoZhang, Date: 2024-01-29 08:38:04Tags:

Overview
The relative momentum strategy compares the momentum of individual stocks and indexes to judge the relative strength of stocks to the broader market. It buys when the stock momentum is higher than that of the index, and sells when the stock momentum is lower than that of the index, in order to capture the growth peak of individual stocks.
Principles
The core logic of this strategy is to judge the relative strength of individual stocks versus the market, specifically:
- Calculate the return over a period of time as the momentum of the stock
- Calculate index return over the same period as the index momentum
- Use moving average to smooth the stock and index momentum
- When the moving average of stock momentum crosses above that of the index, the stock momentum is considered stronger than the market overall - that is the buy signal
- When the stock momentum moving average crosses below the index momentum moving average, the stock momentum is considered weaker, triggering the sell signal
Through this logic, we can buy into stocks when their growth is thriving and sell out as the growth momentum fades, locking in excess returns during the growth peak period of stocks.
Advantage Analysis
The main advantages of the relative momentum strategy:
- Can dynamically capture the growth peak of stocks without concerning specific market conditions - just buy when the stock growth outpaces the overall market
- Smoothing with moving averages filters out short-term fluctuations and enhances signal reliability
- Simple direct buy and sell conditions, easy to understand and operate
- Flexibility to configure the time period for calculating relative momentum and optimize
Risk Analysis
There are also some risks with the relative momentum strategy:
- Stocks may pullback after growth peak ends, posing insufficient profit-taking risk
- Relative momentum signals can be false, identifying a fake instead of real peak
- Need to set stop loss to control maximum loss
These risks can be managed by reasonable profit-taking, stop losses, parameter tuning etc.
Optimization Directions
The relative momentum strategy can be optimized mainly from the following aspects:
- Test different time periods for computing momentum to find optimum
- Try out different types and lengths of moving averages for best parameters
- Add volume filter to avoid false breakouts due to lack of momentum
- Incorporate other indicators to confirm optimal entry timing
Conclusion
The relative momentum strategy captures the excess growth phases of individual stocks versus the overall market to generate alpha. With its simple, clear buy/sell logic and ease of operation, and when coupled with parameter optimization and risk control, this strategy can perform very well.
/*backtest
start: 2024-01-21 00:00:00
end: 2024-01-28 00:00:00
period: 15m
basePeriod: 5m
exchanges: [{"eid":"Futures_Binance","currency":"BTC_USDT"}]
*/

// This source code is subject to the terms of the Mozilla Public License 2.0 at https://mozilla.org/MPL/2.0/
// © HeWhoMustNotBeNamed

//@version=4
strategy("Relative Returns Strategy", overlay=false, initial_capital = 100000, default_qty_type = strategy.percent_of_equity, default_qty_value = 100, commission_type = strategy.commission.percent, pyramiding = 1, commission_value = 0.01, calc_on_order_fills = true)

index_ticker=input("BTC_USDT:swap")
Loopback = input(40, step=20)
useStopAndIndexReturns = input(true)
useStopAndIndexReturnsMa = input(true)

useDifference = not useStopAndIndexReturns

MAType = input(title="Moving Average Type", defval="sma", options=["ema", "sma", "hma", "rma", "vwma", "wma"])
MALength = input(10, minval=10,step=10)

i_startTime = input(defval = timestamp("01 Jan 2010 00:00 +0000"), title = "Backtest Start Time", type = input.time)
i_endTime = input(defval = timestamp("01 Jan 2099 00:00 +0000"), title = "Backtest End Time", type = input.time)
inDateRange = true

f_secureSecurity(_symbol, _res, _src, _offset) => security(_symbol, _res, _src[_offset], lookahead = barmerge.lookahead_on)
f_getMovingAverage(source, MAType, length)=>
    ma = sma(source, length)
    if(MAType == "ema")
        ma := ema(source,length)
    if(MAType == "hma")
        ma := hma(source,length)
    if(MAType == "rma")
        ma := rma(source,length)
    if(MAType == "vwma")
        ma := vwma(source,length)
    if(MAType == "wma")
        ma := wma(source,length)
    ma

index = f_secureSecurity(index_ticker, '1D', close, 0)
stock_return = (close - close[Loopback])*100/close
index_return = (index - index[Loopback])*100/index

stock_return_ma = f_getMovingAverage(stock_return, MAType, MALength)
index_return_ma = f_getMovingAverage(index_return, MAType, MALength)
relativeReturns = stock_return - index_return
relativeReturns_ma = f_getMovingAverage(relativeReturns, MAType, MALength)

plot(useStopAndIndexReturns ? useStopAndIndexReturnsMa ? stock_return_ma : stock_return : na, title="StockReturn", color=color.green, linewidth=1)
plot(useStopAndIndexReturns ? useStopAndIndexReturnsMa ? index_return_ma : index_return : na, title="IndexReturn", color=color.red, linewidth=1)

plot(useDifference?relativeReturns:na, title="Relative-Returns", color=color.blue, linewidth=1)
plot(useDifference?relativeReturns_ma:na, title="MA", color=color.red, linewidth=1)

buyCondition = (useStopAndIndexReturns ? useStopAndIndexReturnsMa ? stock_return_ma > index_return_ma : stock_return > index_return : relativeReturns > relativeReturns_ma)
closeBuyCondition = (useStopAndIndexReturns ? useStopAndIndexReturnsMa ? stock_return_ma < index_return_ma : stock_return < index_return : relativeReturns < relativeReturns_ma)
strategy.entry("Buy", strategy.long, when=buyCondition and inDateRange, oca_name="oca")
strategy.close("Buy", when=closeBuyCondition)
- Flawless Victory Quantitative Trading Strategy Based on Double BB Indicators and RSI
- RSI-based Stop Loss and Take Profit Strategy
- Moving Average Channel Breakout Strategy
- Fixed Time Breakback Testing Strategy
- Time and Space Optimized Multi Timeframe MACD Strategy
- Quantitative Trading Strategy Based on Stoch RSI and MFI
- Multi-indicator Composite Trading Strategy
- Crossover EMA Short-term Trading Strategy
- Trend Following Strategy Based on Dynamic Stop Loss of Dual EMA Crossover
- Bull Market Breakout Darvas Box Buy Strategy
- Wave Trend and VWMA Based Trend Following Quant Strategy
- Dual Moving Average and Williams Average Combination Strategy
- Adaptive Triple Supertrend Strategy
- Moving Average Crossover Strategy
- Multiple Indicator Quantitative Trading Strategy
- Market Cypher Wave B Automated Trading Strategy
- Key Reversal Backtest Strategy
- Three EMA Stochastic RSI Crossover Golden Cross Strategy
- Reversal Candlestick Backtesting Strategy
- Ehlers-Smoothed Stochastic RSI Strategy