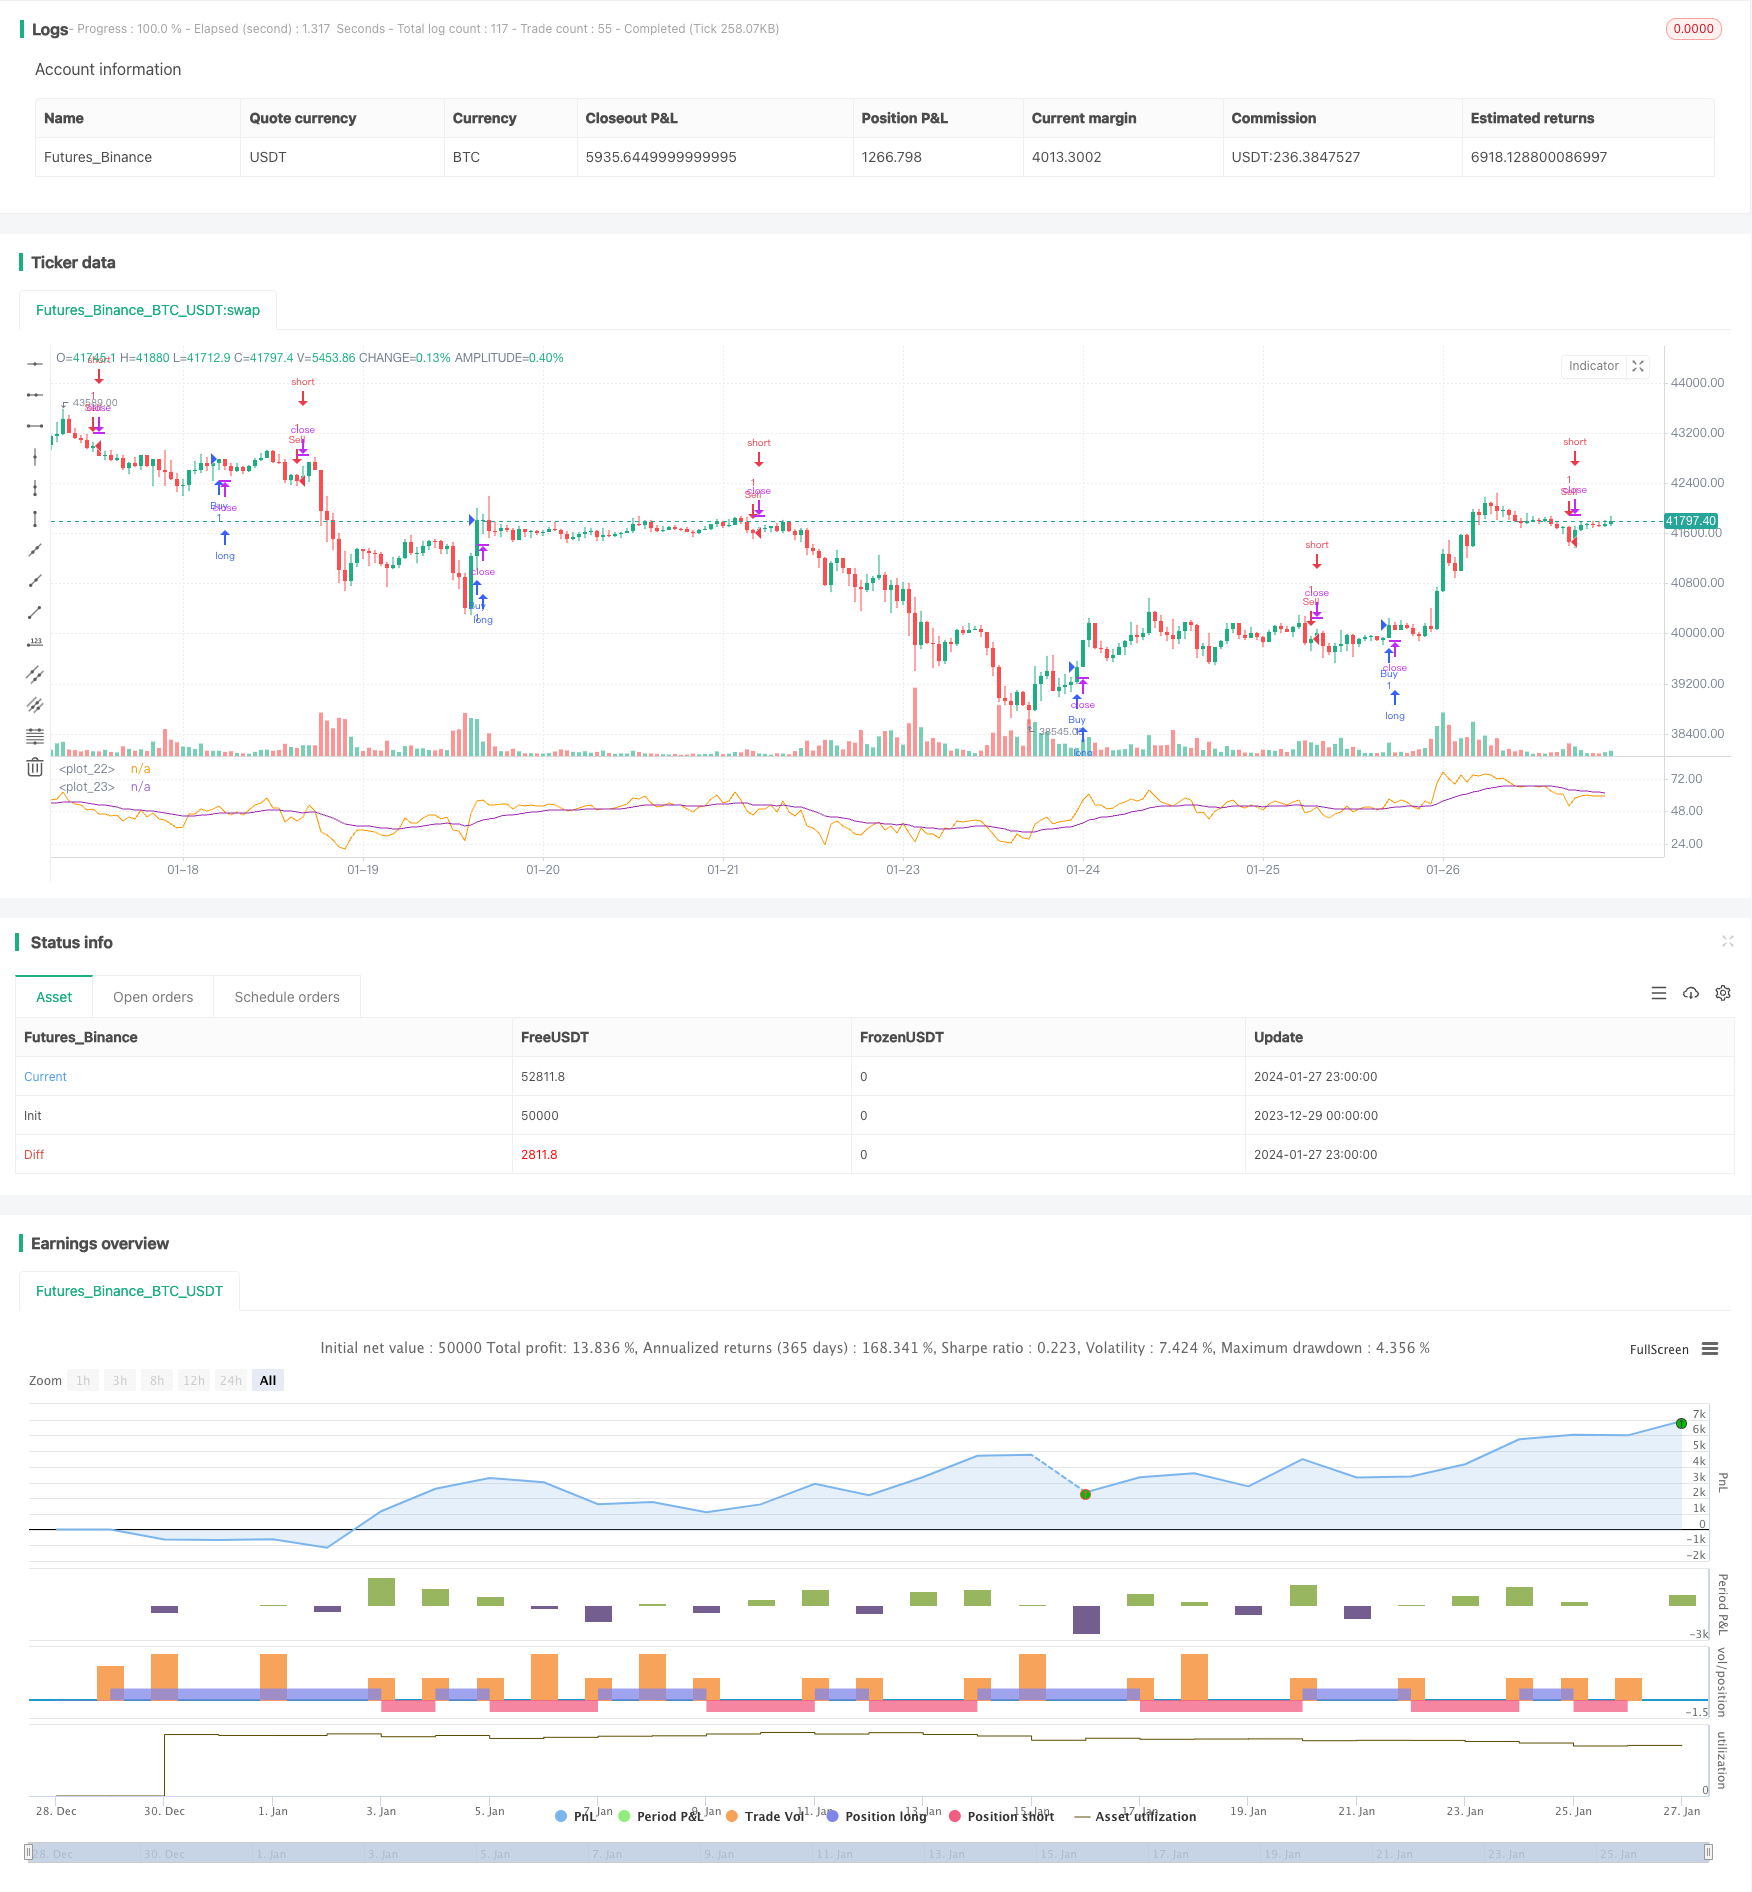
Triple Indicator Collision Strategy
Author: ChaoZhang, Date: 2024-01-29 11:24:11Tags:

Overview
The Triple Indicator Collision Strategy is a very classic quantitative trading strategy. It combines three classic technical indicators - moving average, MACD indicator and RSI indicator. It generates trading signals when all three indicators produce buy or sell signals simultaneously.
Strategy Principle
This strategy uses 20-day EMA, MACD(12, 26, 9) and 14-day RSI altogether. The specific logic is:
When price crosses above 20-day EMA, MACD histogram crosses above signal line, and RSI crosses above 20-day EMA of RSI, go long. When price crosses below 20-day EMA, MACD histogram crosses below signal line, and RSI crosses below 20-day EMA of RSI, go short.
With trading signals generated only when all three indicators agree, this filters out some false signals and makes the strategy more solid and reliable.
Advantage Analysis
The triple indicator collision strategy has the following advantages:
-
Filtering out noise and reducing false signals. Single indicator is prone to market noise and false signals. Using three indicators can filter out noise effectively and make signals more reliable.
-
Capturing inflection points in trends. Different indicators react to price fluctuations differently. When three indicators agree in the short term, it often signifies a trend reversal. This provides the possibility to capture inflection points.
-
Judging market from multiple dimensions. The three indicators analyze market from different angles, verifying each other, so as to judge market trends more comprehensively and accurately.
-
Lowering position risks. Filtering with multiple indicators reduces inefficient trade times and unnecessary fund turnover, which helps on risk control.
Risk Analysis
There are also some risks with this strategy:
-
Parameter optimization risk. The parameters of moving average length, MACD parameters, RSI parameters etc. can all impact strategy performance. Unsuitable parameter combination may lead to poor strategy performance in market trends. Therefore comprehensive testing and optimization is needed to find the optimal parameter combination.
-
Missing trading opportunities. The triple indicator strategy is relatively conservative and may miss some trading chances. If it fails to capture major trends, it will hurt strategy profitability.
-
Slippage control in live trading. In live trading, transaction costs and slippage also impact strategies to some extent. Trading frequency needs to be controlled to ensure profit margin is greater than transaction costs.
Optimization Directions
The strategy can be optimized in the following aspects:
-
Test different parameter combinations to find the optimal parameters, by altering the lengths of moving averages, MACD parameters, RSI parameters etc.
-
Add stop loss mechanisms. Moving stop loss or pending order stop loss can effectively control single trade loss.
-
Combine other indicators to filter signals. Bollinger Bands, KDJ etc. can also be used to verify signals and filter out false signals.
-
Adjust parameters based on different products and timeframes. Parameters can be optimized according to the trading products and timeframes.
Conclusion
The Triple Indicator Collision Strategy utilizes the trading signals from moving averages, MACD and RSI altogether to make long and short decisions. It can effectively filter out noise and identify potential inflection points in trends, making trade signals more reliable. By optimizing parameters, setting stop loss, filtering signals and so on, this strategy can be continuously improved to generate clearer signals and more reliable profits.
/*backtest
start: 2023-12-29 00:00:00
end: 2024-01-28 00:00:00
period: 1h
basePeriod: 15m
exchanges: [{"eid":"Futures_Binance","currency":"BTC_USDT"}]
*/

// This source code is subject to the terms of the Mozilla Public License 2.0 at https://mozilla.org/MPL/2.0/
// © fangdingjun

//@version=4
strategy("MACD_RSI strategy", overlay=false)

_ema_len = input(20, title="EMA length")
_macd_fast = input(12, title="MACD Fast")
_macd_slow = input(26, title="MACD Slow")
_macd_signal_len = input(20, title="MACD Signal length")
_rsi_len = input(14, title="RSI length")
_rsi_signal_len = input(20, title="RSI signal length")

_ema = ema(close, _ema_len)

_macd = ema(close, _macd_fast) - ema(close, _macd_slow)
_macd_signal = ema(_macd, _macd_signal_len)

_rsi = rsi(close, _rsi_len)
_rsi_signal = ema(_rsi, _rsi_signal_len)

plot(_rsi, color=color.orange)
plot(_rsi_signal, color=color.purple)

longCondition = close > _ema and _macd > _macd_signal and _rsi > _rsi_signal
if (longCondition)
    strategy.entry("Buy", strategy.long)

shortCondition = close < _ema and _macd < _macd_signal and _rsi < _rsi_signal
if (shortCondition)
    strategy.entry("Sell", strategy.short)
- Daily FX Strategy Based on Moving Average and Williams Indicator
- Moving Average Channel Breakout Trading Strategy
- Dual Moving Average Stochastic Strategy
- Donchian Channel Breakout Strategy
- Moving Average Trend Tracking Strategy
- RSI Indicator Grid Trading Strategy
- PPO Price Sensitivity Momentum Double Bottom Directional Trading Strategy
- Scalping Strategy with Volume and VWAP Confirmation
- ADX, MA and EMA Long Only Trend Tracking Strategy
- Momentum Breakthrough Golden Cross Strategy
- Out-of-the-box Machine Learning Trading Strategy
- Moving Average Turning Point Crossover Trading Strategy
- Cross-Cycle Arbitrage Strategy Based on Multiple Indicators
- The Bollinger Band breakout strategy is a long-only momentum chasing strategy
- Flawless Victory Quantitative Trading Strategy Based on Double BB Indicators and RSI
- RSI-based Stop Loss and Take Profit Strategy
- Moving Average Channel Breakout Strategy
- Fixed Time Breakback Testing Strategy
- Time and Space Optimized Multi Timeframe MACD Strategy
- Quantitative Trading Strategy Based on Stoch RSI and MFI