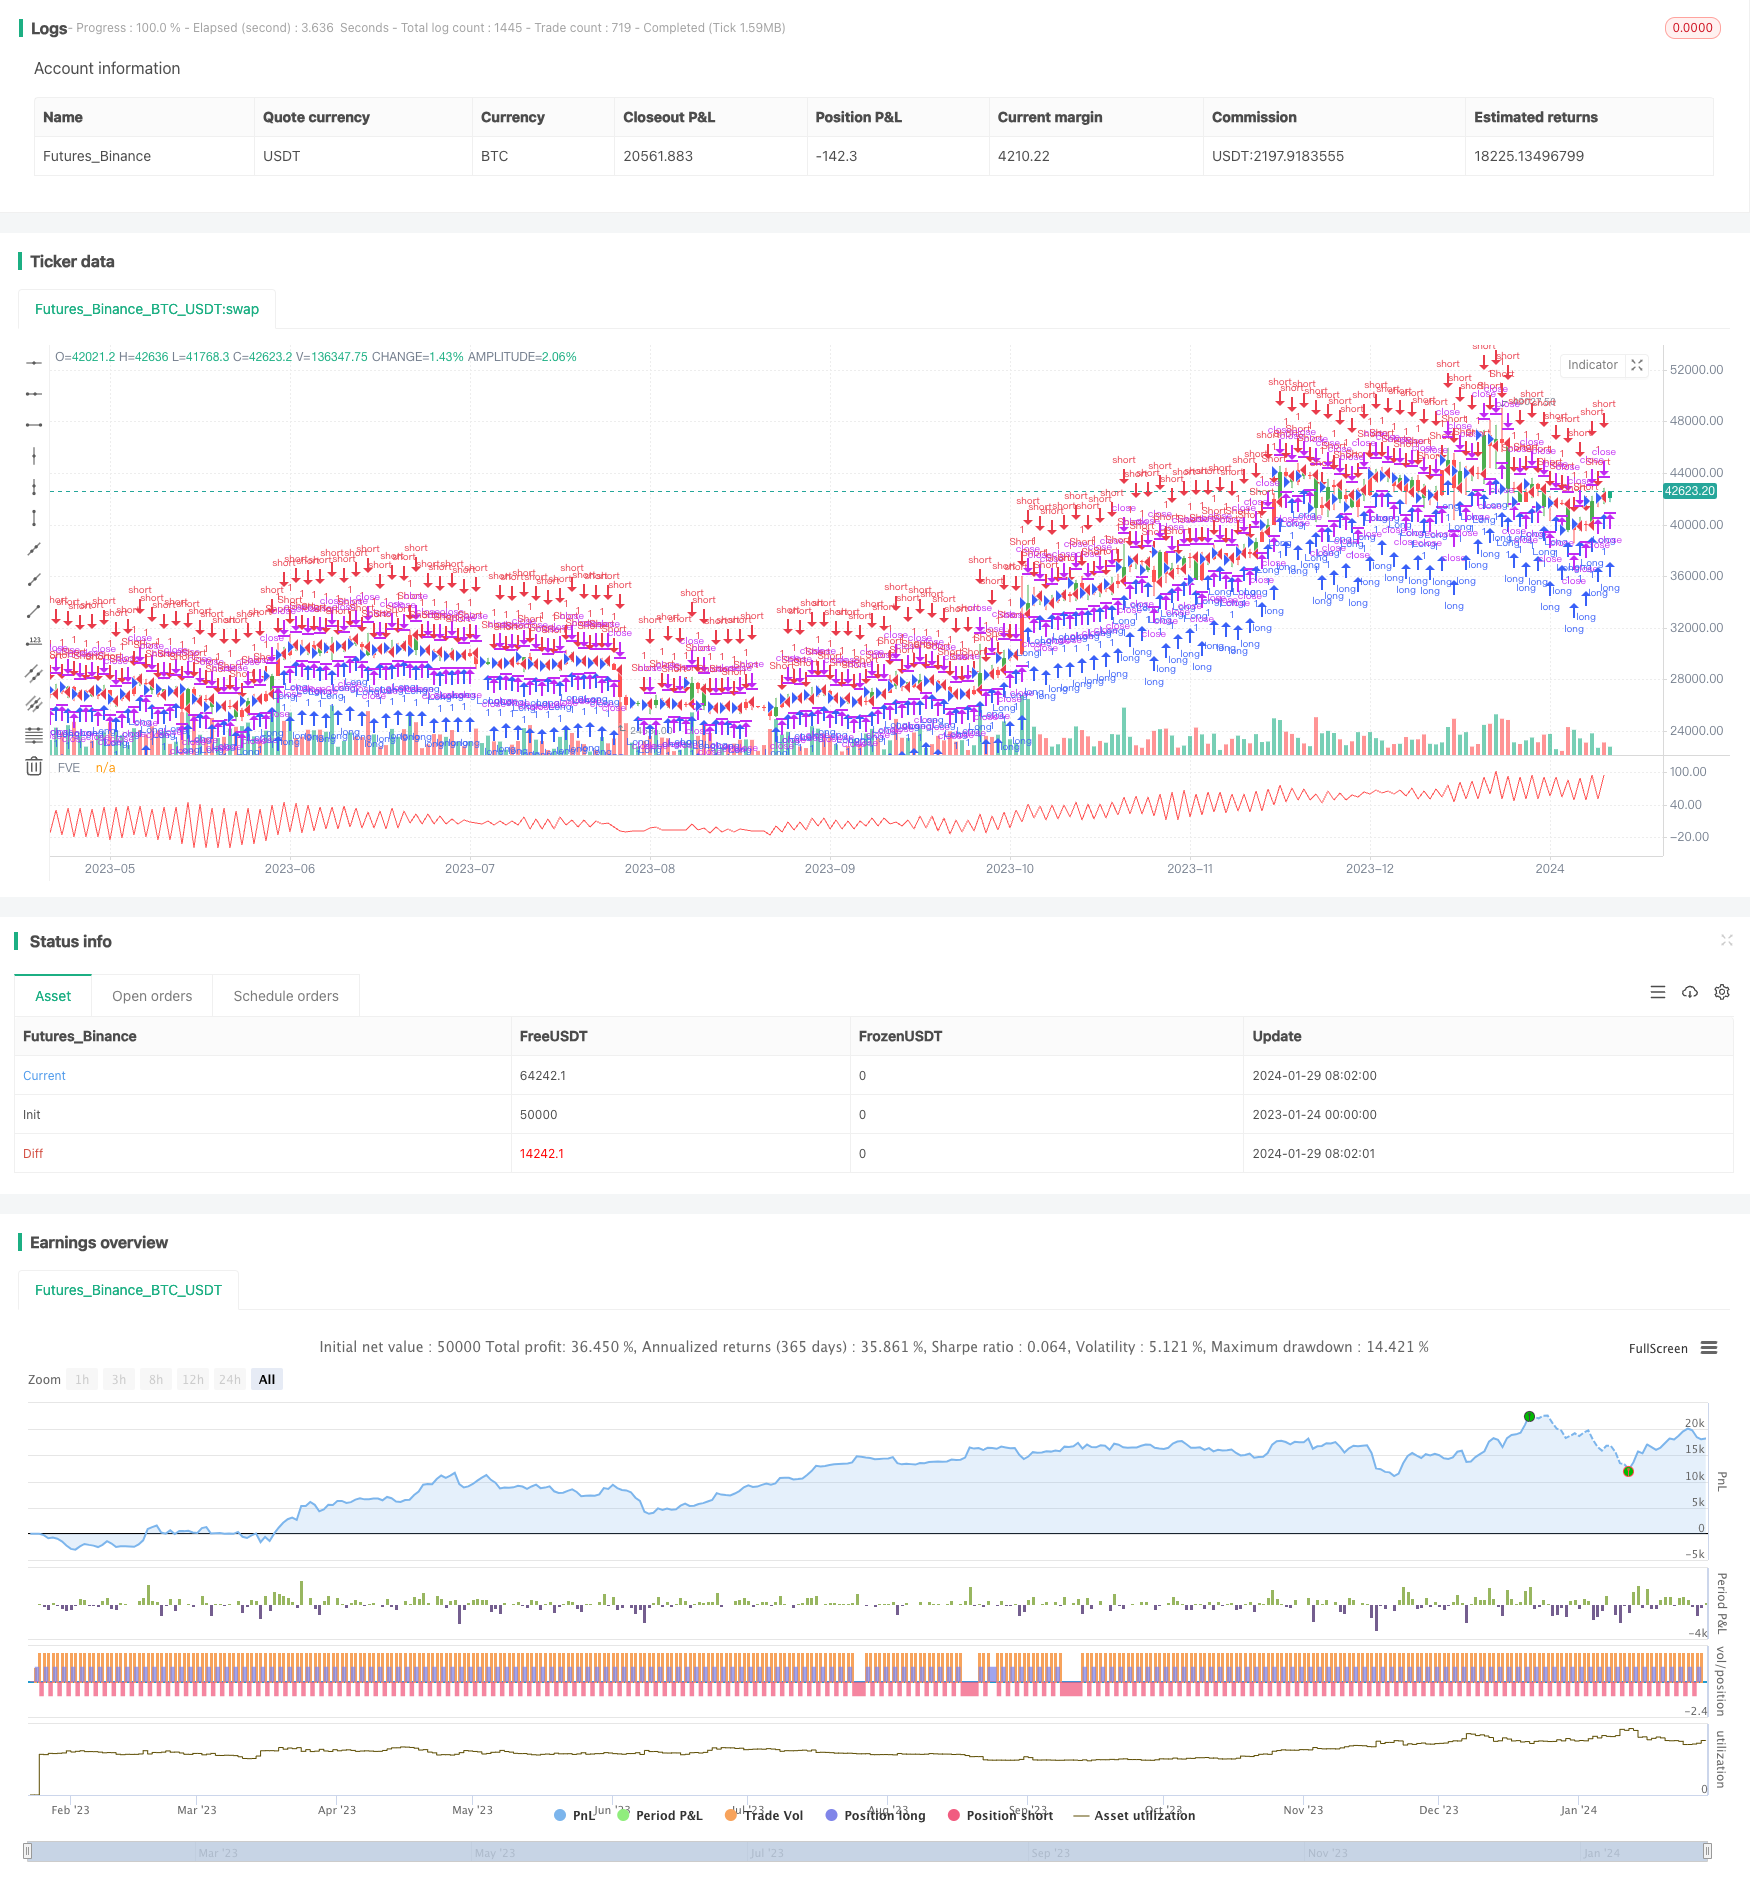
Bilateral Three-Point Moving Average Quantitative Trading Strategy
Author: ChaoZhang, Date: 2024-01-31 16:11:41Tags:

Overview
This strategy is based on the bilateral three-point moving average indicator. By calculating the mean value of the highest price, lowest price and closing price of the most recent N periods, it realizes the function of judging price trends and generating trading signals. This strategy is suitable for medium and short term trading, and can effectively filter market noise and capture price trends.
Strategy Principle
The core indicator of this strategy is the bilateral three-point moving average (XHL2, XHLC3). XHL2 calculates the mean value of the highest price and lowest price of the most recent N periods. XHLC3 calculates the mean value of the highest price, lowest price and closing price of the most recent N periods. These two indicators can effectively smooth price data and filter out the impact of short-term fluctuations.
The strategy judges the price trend by calculating the difference nMF between XHL2, XHLC3 and the closing price. When nMF is greater than a factor, it is judged that the price is in an upward trend; when nMF is less than a negative factor, it is judged that the price is in a downward trend. Combined with trading volume, the indicator nRES is calculated. nRES greater than 0 indicates a buy signal, and less than 0 indicates a sell signal. Trend direction and trading signals are determined based on the positive/negative sign and magnitude relationship of nRES.
Advantage Analysis
The advantages of this strategy are:
Using the bilateral three-point moving average indicator can effectively filter market noise and judge medium and long term price trends;
Combining changes in trading volume can more accurately determine the direction of capital flow and issue trading signals;
The strategy has few parameters, simple and easy to understand methods, and is easy to implement;
Flexible setting of holding direction, suitable for different types of investors.
Risk Analysis
The main risks of this strategy are:
Improper parameter settings may cause erroneous trading signals;
In a long-term strong trending market, the strategy may generate too many false trading signals;
In a volatile market, excessively small stop loss settings may increase the risk of loss.
Solutions:
Optimize parameters and determine the best parameters based on backtesting;
Judge the reliability of signals in combination with trends and support/resistance;
Appropriately relax the stop loss range to control single loss.
Optimization Directions
The optimization directions of this strategy:
Optimize the moving average parameters and trading volume parameters to improve the sensitivity of the indicator;
Add trend judgment indicators to improve the accuracy of trading signals;
Add stop loss strategies to reduce risk of loss;
Combine machine learning methods to achieve automatic parameter optimization.
Summary
This strategy is designed based on the bilateral three-point moving average indicator to determine the medium and long term trend direction of prices. It uses changes in trading volume to confirm capital inflows and outflows, and finally generates buy and sell trading signals. The strategy has large room for optimization and can be improved in multiple dimensions to adapt to more complex market environments.
/*backtest
start: 2023-01-24 00:00:00
end: 2024-01-30 00:00:00
period: 1d
basePeriod: 1h
exchanges: [{"eid":"Futures_Binance","currency":"BTC_USDT"}]
*/

//@version=2
////////////////////////////////////////////////////////////
//  Copyright by HPotter v1.0 25/06/2018
// The FVE is a pure volume indicator. Unlike most of the other indicators
// (except OBV), price change doesn?t come into the equation for the FVE (price
// is not multiplied by volume), but is only used to determine whether money is
// flowing in or out of the stock. This is contrary to the current trend in the
// design of modern money flow indicators. The author decided against a price-volume
// indicator for the following reasons:
// - A pure volume indicator has more power to contradict.
// - The number of buyers or sellers (which is assessed by volume) will be the same,
//     regardless of the price fluctuation.
// - Price-volume indicators tend to spike excessively at breakouts or breakdowns.
//
// You can change long to short in the Input Settings
// WARNING:
// - For purpose educate only
// - This script to change bars colors.
////////////////////////////////////////////////////////////
strategy(title="Finite Volume Elements (FVE) Backtest", shorttitle="FVE")
Period = input(22, minval=1)
Factor = input(0.3, maxval=1)
reverse = input(false, title="Trade reverse")
xhl2 = hl2
xhlc3 = hlc3
xClose = close
xVolume = volume
xSMAV = sma(xVolume, Period)
nMF = xClose - xhl2 + xhlc3 - xhlc3[1]
nVlm = iff(nMF > Factor * xClose / 100,  xVolume,
         iff(nMF < -Factor * xClose / 100, -xVolume, 0))
nRes = nz(nRes[1],0) + ((nVlm / xSMAV) / Period) * 100
pos = iff(nRes > nRes[1] and nRes > nRes[2], 1,
         iff(nRes < nRes[1] and nRes < nRes[2], -1, nz(pos[1], 0)))
possig = iff(reverse and pos == 1, -1,
          iff(reverse and pos == -1, 1, pos))
if (possig == 1)
    strategy.entry("Long", strategy.long)
if (possig == -1)
    strategy.entry("Short", strategy.short)
barcolor(possig == -1 ? red: possig == 1 ? green : blue )
plot(nRes, color=red, title="FVE")
- Pivot SuperTrend Strategy Across Multiple Timeframes
- Quantitative Candlestick Pattern and Trend Following Strategy
- Supertrend Combined with RSI Quantitative Trading Strategy
- Cape Town 15-min Candle Breakout Strategy
- Dual ATR Trailing Stop Strategy
- Qullamaggie Breakout Tracking Strategy
- Extreme version of Noro's Trend Moving Averages Strategy
- Recursive Momentum Trading Strategy
- Donchian Trend Following Strategy
- SuperTrend RSI EMA Crossover Strategy
- Trading Strategy Based on RSI and MACD Indicators
- CCI and EMA Based Scalping Strategy
- Improved Wave Trend Tracking Strategy
- Ichimoku Entries Strategy
- Trend Following Strategy Based on Moving Average Crossover
- RSI Trend Following Strategy with Trailing Stop Loss
- Consolidation Breakout Strategy
- Dynamic Trailing Stop Loss Strategy
- Multi Timeframe Gold Reversal Tracking Strategy
- Quant W Pattern Master Strategy