Golden Parabola Breakout Strategy
Author: ChaoZhang, Date: 2024-02-04 18:07:14Tags:

Overview
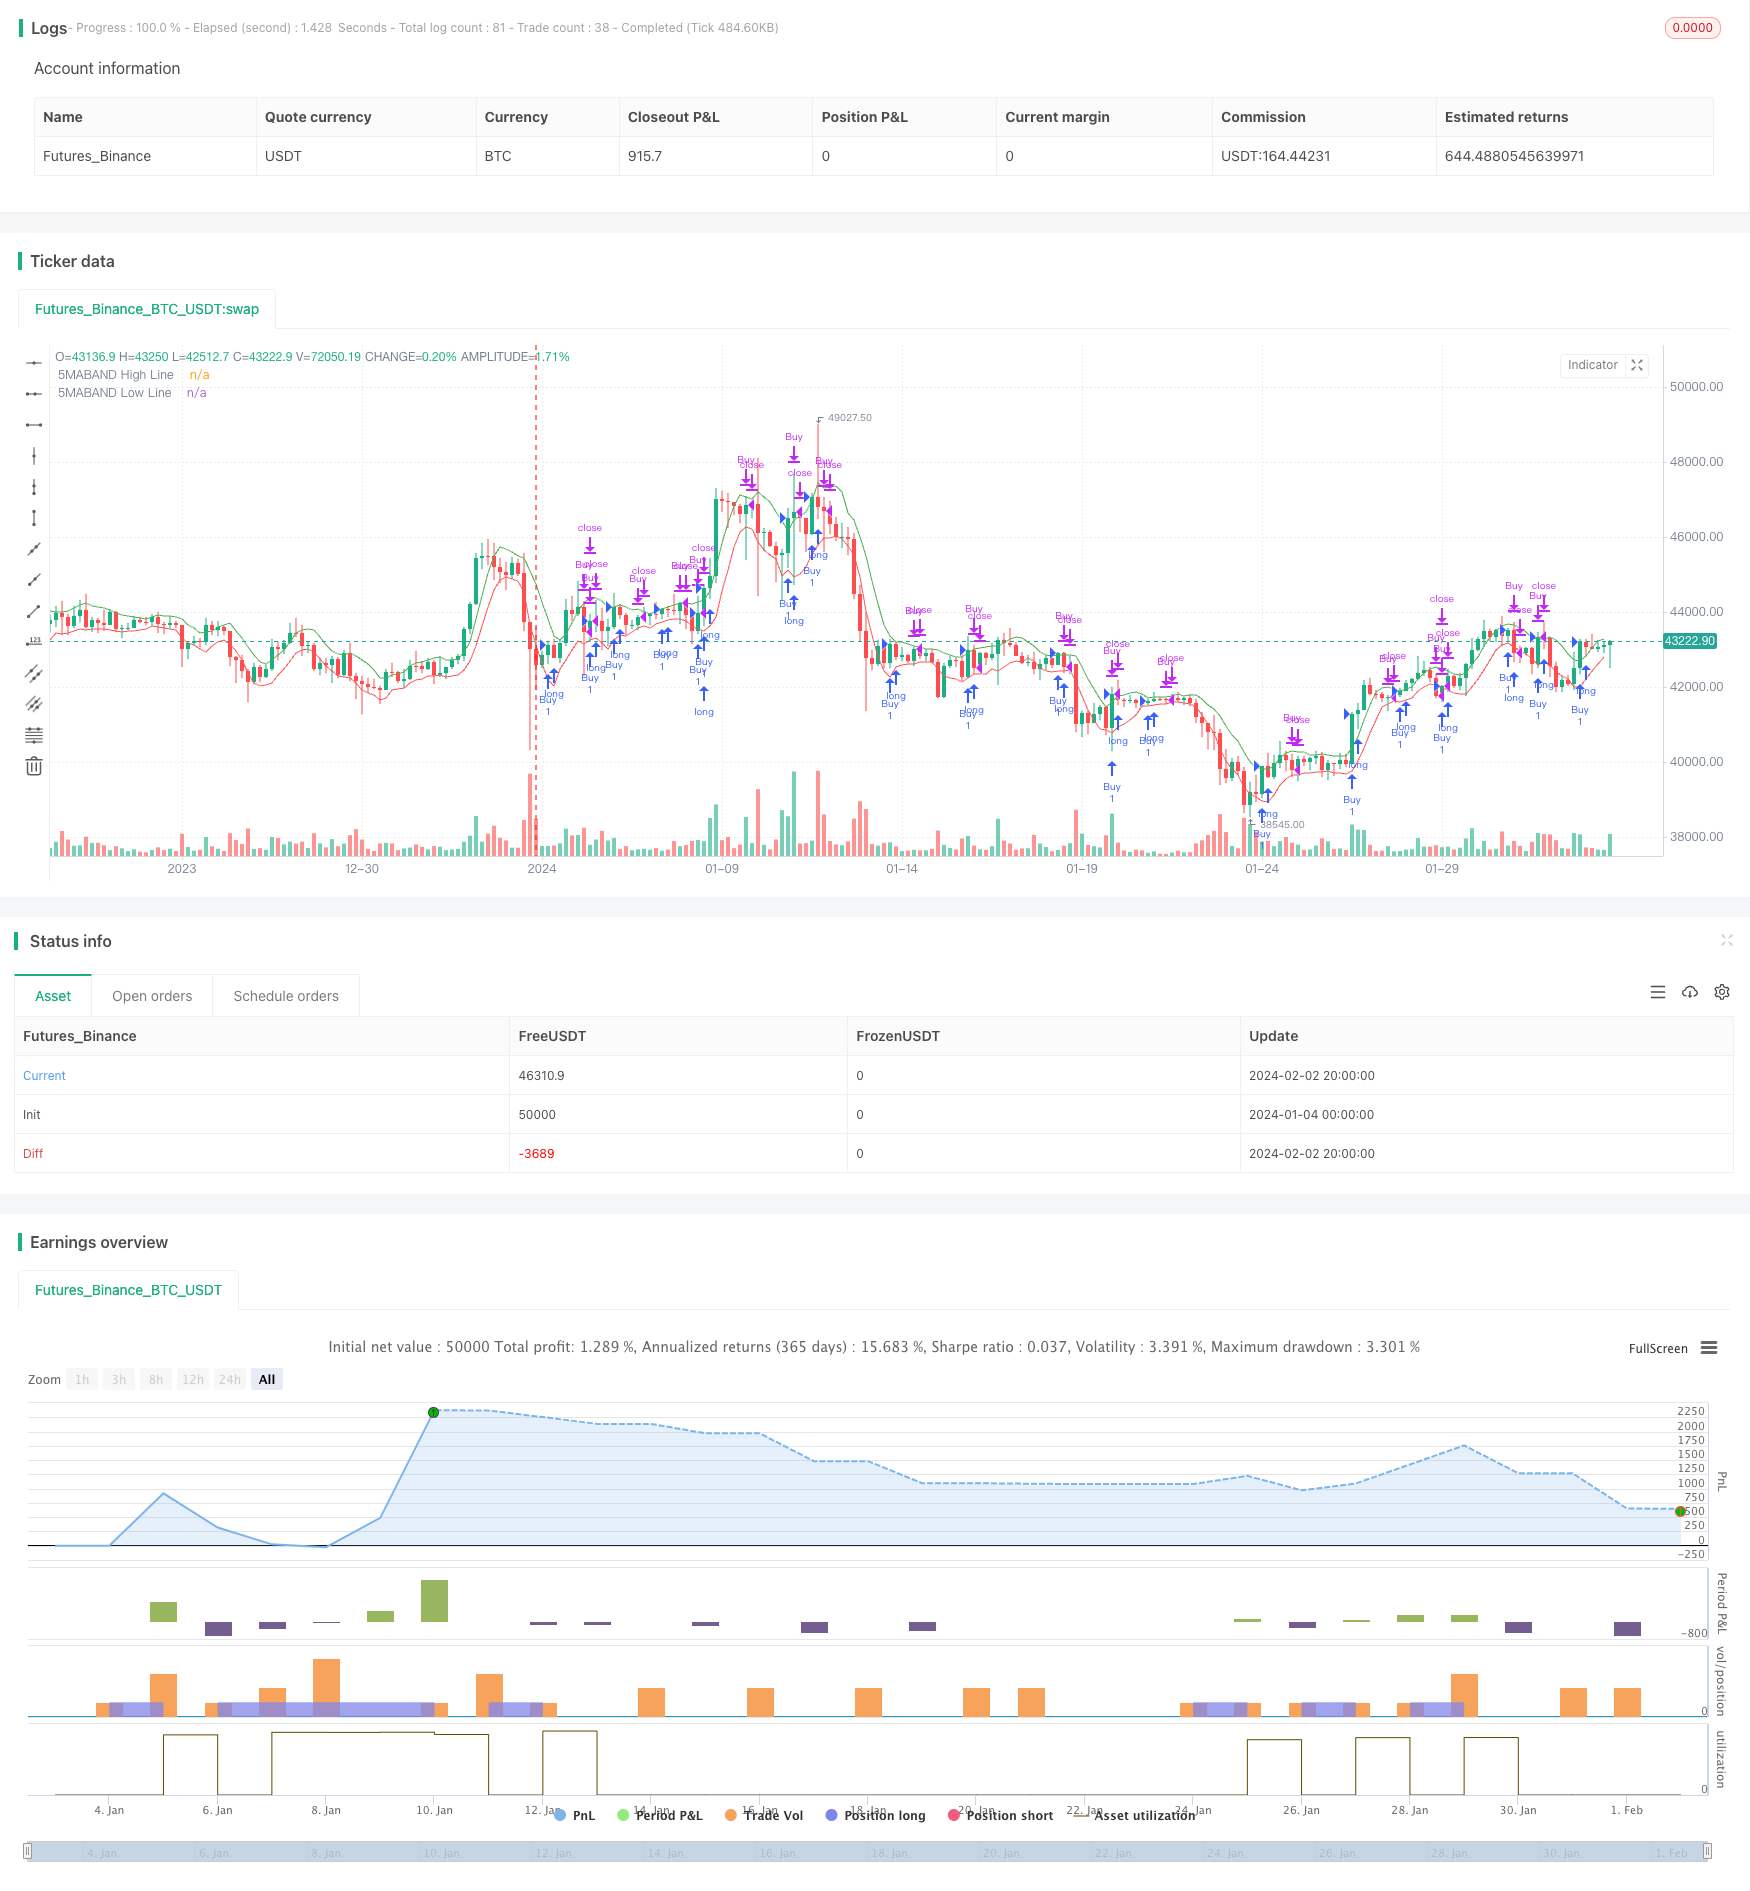
The golden parabola breakout strategy is a technical analysis strategy that combines the judgment of golden parabola patterns and the breakout of moving average exit signals to enter the market when the golden parabola pattern is formed and exit when the exit signal breaks out, in order to make profitable trades.
Strategy Principles
The main judgment rules of this strategy are:
Use the simple moving average of the highest and lowest prices of 5 K-lines to draw the golden parabola channel.
When the closing price breaks through the channel upwards, it forms a golden parabola pattern as a buy signal to enter the market. This indicates that the price is breaking through the upper edge of the channel and may be entering a trend.
After buying, set the trailing stop loss near the entry price to prevent loss. At the same time, set the trailing take profit line to lock in profits.
When the price breaks through the lower edge of the channel, it generates an exit signal to close the long order and exit the market. This indicates that the price may re-enter the shock or downward channel.
The main judgment criteria of this strategy include golden parabola pattern judgment and moving average breakout exit signal judgment, allowing it to enter during trend breakouts and control risks through trailing stops and take profits.
Advantages
This strategy has the following advantages:
Combining pattern analysis and technical indicators improves the reliability of trading signals.
The trailing stop loss controls the risk of single loss and avoids excessive losses.
The trailing take profit locks in profits and prevents profit retracement.
It has a relatively high profit ratio and is suitable for investors seeking stable returns.
The easytrade strategy syntax is simple and easy to write and optimize.
Risks
The strategy also has the following risks:
Prices may not break through the channel effectively, causing false breakouts. This will cause unnecessary losses. You can reduce the probability of false breakouts by optimizing parameters.
The trailing stop loss may be broken through, thus expanding losses. This requires reasonably setting stop loss distances.
The trailing take profit may exit too early, missing greater profit opportunities. This requires adjusting take profit positions based on market conditions.
Need to adjust channel parameters in a timely manner to adapt to trend adjustments in different cycles.
Optimization Directions
The strategy can be optimized in the following aspects:
Optimize channel parameters to find more suitable parameter combinations to improve signal quality.
Add other filtering conditions such as trading volume surges to improve signal accuracy.
Try other exit signals such as Bollinger Bands exit or SAR stop to find better exit points.
Test different stop loss, take profit algorithms to optimize money management.
Add adaptive modules to automatically optimize strategy parameters based on real-time market conditions.
Summary
The golden parabola breakout strategy combines pattern analysis and technical indicators for relatively high quality trading signals and uses stops and take profits to control risks. This strategy can improve profitability through various optimization methods and is an easy to master quantitative trading strategy with stable returns. It is suitable for investors with some foundation who want stable returns.
/*backtest
start: 2024-01-04 00:00:00
end: 2024-02-03 00:00:00
period: 4h
basePeriod: 15m
exchanges: [{"eid":"Futures_Binance","currency":"BTC_USDT"}]
*/

//@version=5
strategy("5MABAND + GBS Buy & Sell Strategy", overlay=true)

// Command 1 - 5MABAND Calculation
length = input(5, title="Number of Candles for Average")
avgHigh = ta.sma(high, length)
avgLow = ta.sma(low, length)

// Plotting 5MABAND Bands
plot(avgHigh, color=color.green, title="5MABAND High Line", linewidth=1)
plot(avgLow, color=color.red, title="5MABAND Low Line", linewidth=1)

// Command 2 - GBS concept Buy Entry
gbsBuyCondition = close > open and high - close < close - open and open - low < close - open and close - open > close[1] - open[1] and close - open > close[2] - open[2] and close - open > close[3] - open[3] and close[1] < avgHigh and close[2] < avgHigh and close[3] < avgHigh and open[1] < avgHigh and open[2] < avgHigh and open[3] < avgHigh

// Command 3 - GBS Concept Sell Entry
gbsSellCondition = open - close > open[1] - close[1] and open - close > open[2] - close[2] and open - close > open[3] - close[3] and open[1] > avgLow and open[2] > avgLow and open[3] > avgLow and open - close > open - low and open - close > high - open

// Command 6 - 5MABAND Exit Trigger
exitTriggerCandle_5MABAND_Buy = low < avgLow
exitTriggerCandle_5MABAND_Sell = high > avgHigh

// Exit Signals for 5MABAND
exitBuySignal_5MABAND = close < avgLow
exitSellSignal_5MABAND = close > avgHigh

// Execute Buy and Sell Orders
strategy.entry("Buy", strategy.long, when = gbsBuyCondition)
strategy.close("Buy", when = exitBuySignal_5MABAND)

strategy.entry("Sell", strategy.short, when = gbsSellCondition)
strategy.close("Sell", when = exitSellSignal_5MABAND)

// Exit Buy and Sell Orders for 5MABAND
strategy.close("Buy", when = exitTriggerCandle_5MABAND_Buy)
strategy.close("Sell", when = exitTriggerCandle_5MABAND_Sell)
- Dual Moving Average Oscillator Stock Strategy
- Momentum Swing Trading Strategy
- Dynamic PSAR Stock Fluctuation Tracking Strategy
- Closing Price Comparison Dual Moving Average Crossover Strategy
- Ichimoku Cloud, MACD and Stochastic Based Multi-Timeframe Trend Tracking Strategy
- MACD Volume Reversal Trading Strategy
- Dynamic Moving Average Crossover Combo Strategy
- Willy Wonka Breakout Strategy
- Exponential Moving Average and Relative Strength Index Combination Trend Following Strategy
- Reversal Trend Catching and Dynamic Stop Loss Combo Strategy
- SAR Momentum Reversal Tracking Strategy
- Dynamic RSI Trading Strategy
- Crossover Strategy between Multiple Moving Averages
- Dual Moving Average Breakout Strategy
- Moving Average Crossover Strategy
- Dual Moving Average Trend Tracking Strategy
- Quadratic Momentum Double Indicators Timing Strategy
- Renko and Relative Vigor Index Trend Following Strategy
- Swing Trend Moving Average Strategy
- Bollinger Band, Moving Average and MACD Combined Trading Strategy