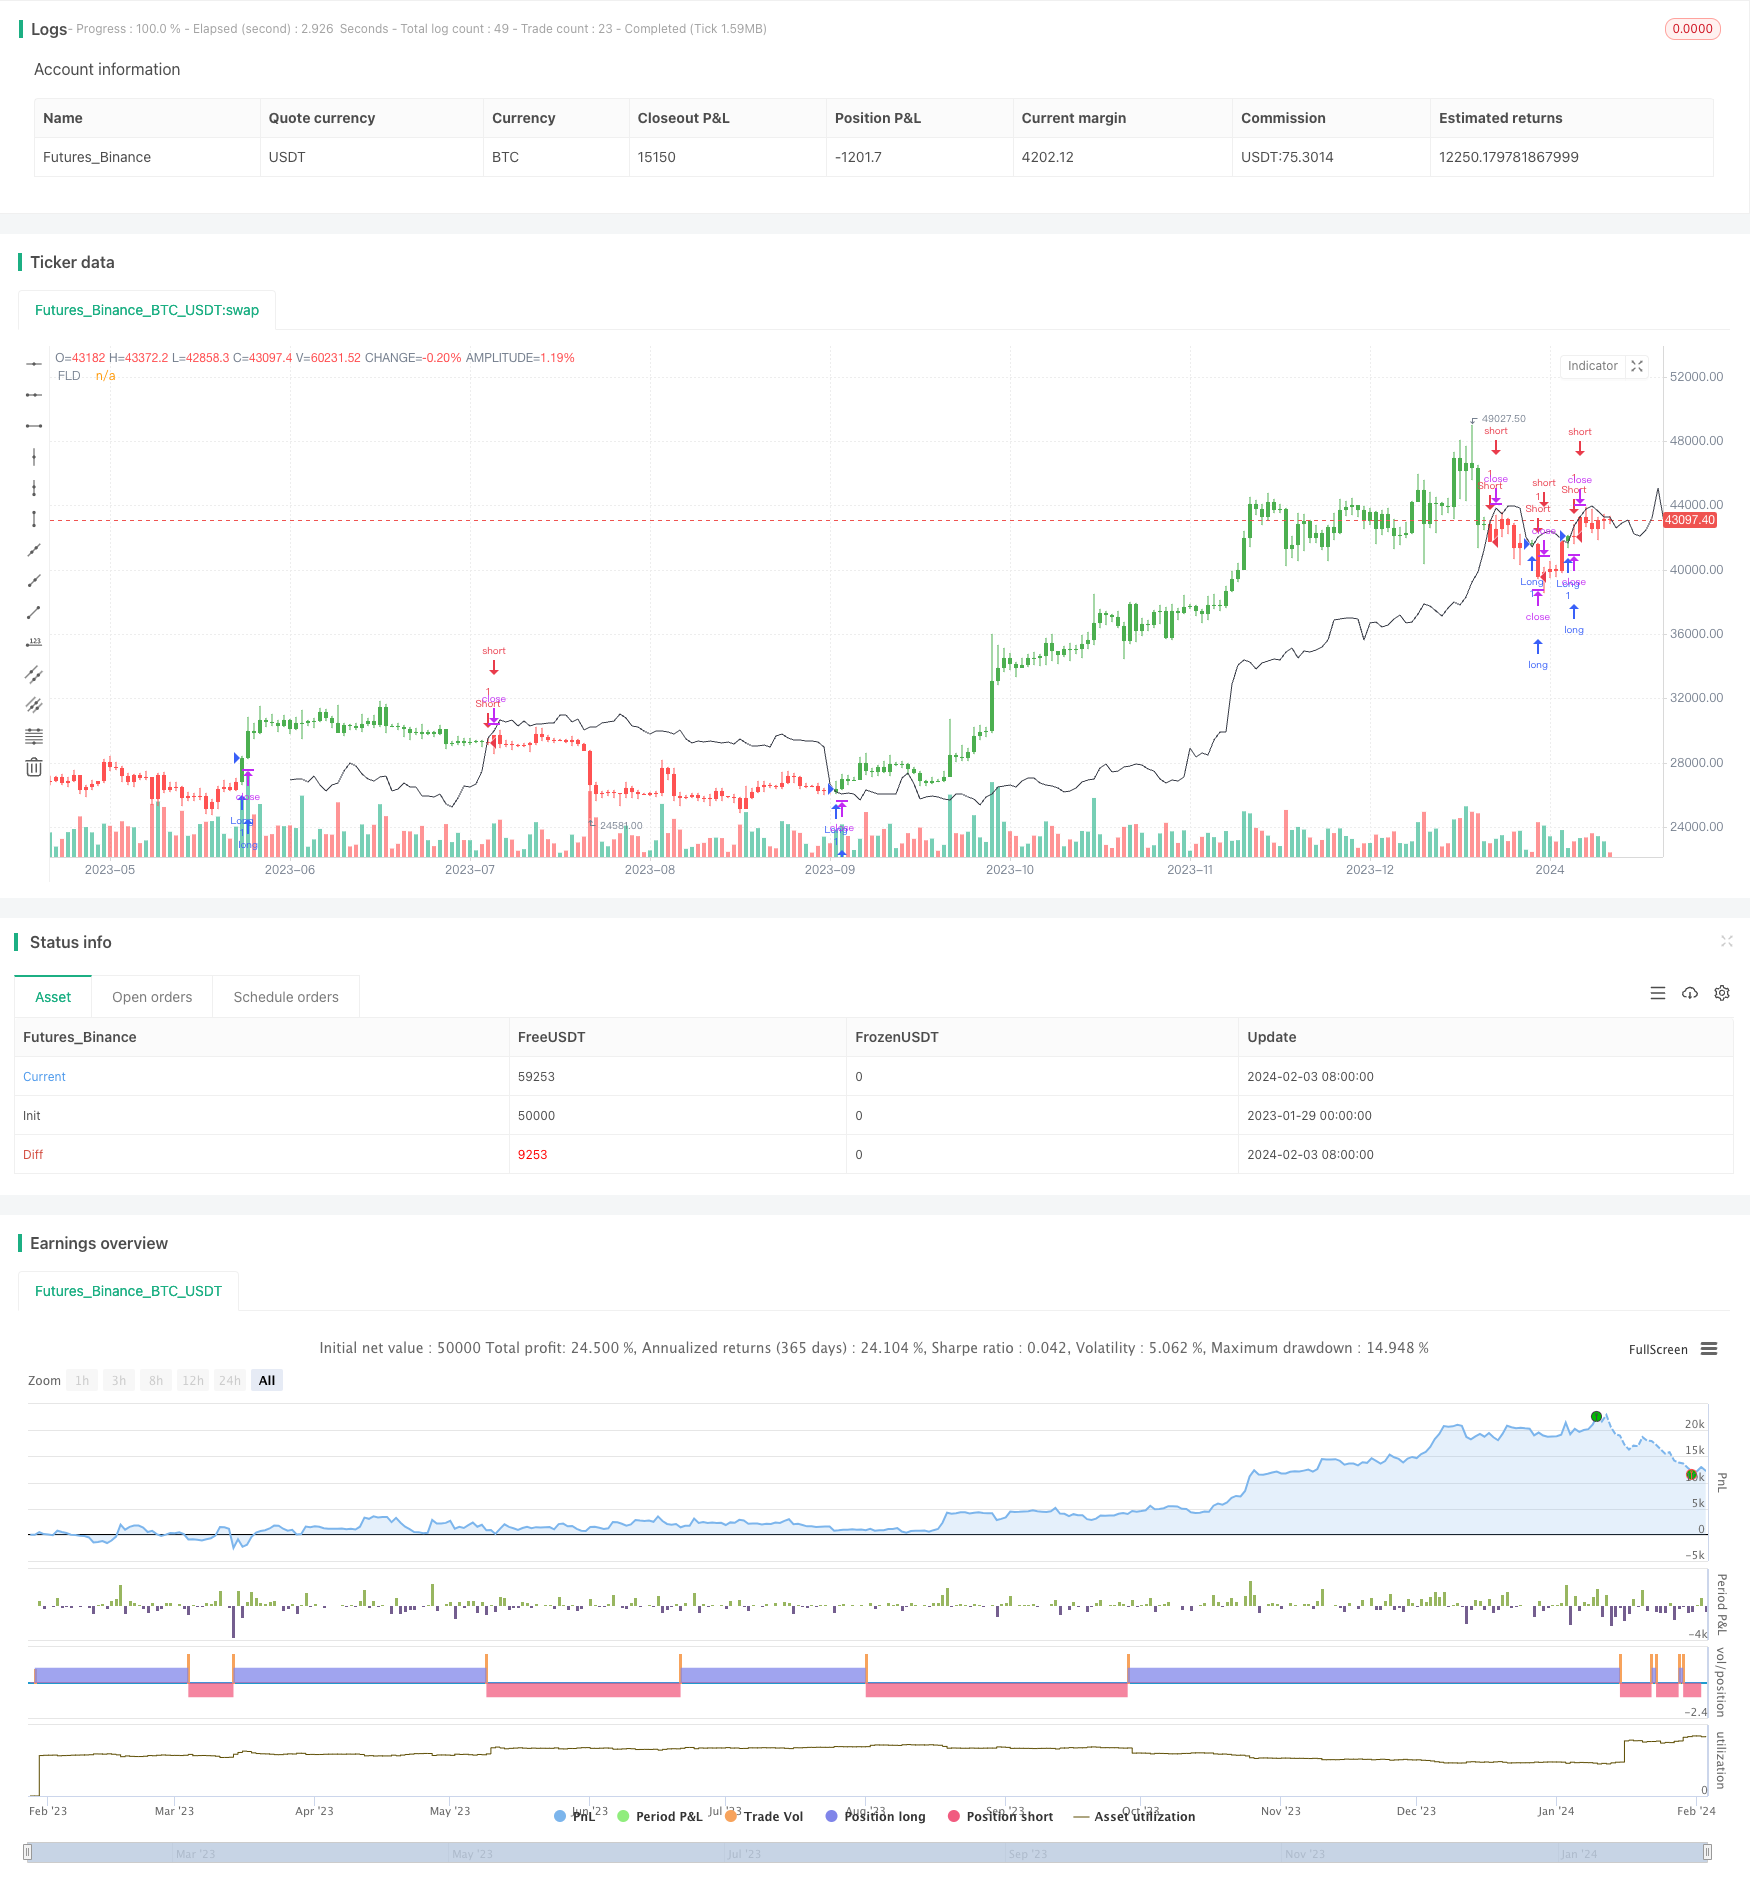
Future Lines of Demarcation Backtest Strategy
Author: ChaoZhang, Date: 2024-02-05 14:00:01Tags:

Overview
The main idea of this strategy is to predict the future price trend by drawing future price extension lines and comparing the current price with the lines. It can make long or short positions accordingly when the price is higher or lower than the extension line.
Strategy Principle
The Future Lines of Demarcation (FLD) represents the median, highest or lowest price in a certain future period. The strategy uses FLD to determine the future price movement. The principle is:
- Calculate the displacement period Period of FLD based on cycle length, which is the future price of Price.
- Compare current Close price with FLD’s future price at displacement period.
- When Close price is lower than future FLD price, it is a bullish signal.
- When Close price is higher than future FLD price, it is a bearish signal.
- Make corresponding long or short positions based on bullish and bearish signals.
Advantage Analysis
The main advantages of this strategy:
- Using FLD to determine future trend has high accuracy.
- Customizable cycle parameter, adaptable to different market environments.
- Can choose median, highest or lowest price as FLD source, high adaptability.
Risk Analysis
The main risks of this strategy:
- FLD itself may fail, resulting in missing opportunities or wrong signals. Can combine other indicators.
- Improper cycle parameter settings may cause excessive wrong signals. Need cycle length optimization.
- Sudden price fluctuations causing FLD prediction failure. Can set stop loss to control risk.
Optimization Directions
The strategy can be optimized in the following aspects:
- Combine with other indicators to filter signals and improve accuracy, e.g. MACD, KDJ etc.
- Optimize cycle parameters to find best combination.
- Add stop loss and take profit mechanisms to control single trade loss and profit.
- Adjust long and short rules based on backtest results to reduce wrong signals.
Summary
The strategy judges future price trend by comparing price with displaced future price extension line. It’s a typical trend following strategy. The logic is clear and easy to understand, with relatively small implementation risk. By parameter optimization and indicator combination, good strategy results can be obtained.
/*backtest
start: 2023-01-29 00:00:00
end: 2024-02-04 00:00:00
period: 1d
basePeriod: 1h
exchanges: [{"eid":"Futures_Binance","currency":"BTC_USDT"}]
*/

//@version=2
////////////////////////////////////////////////////////////////////
//  Copyright by HPotter v1.0 15/02/2017
//  An FLD is a line that is plotted on the same scale as the price and is in fact the
//  price itself displaced to the right (into the future) by (approximately) half the
//  wavelength of the cycle for which the FLD is plotted. There are three FLD's that can be
//  plotted for each cycle:
//    An FLD based on the median price.
//    An FLD based on the high price.
//    An FLD based on the low price.
///////////////////////////////////////////////////////////////////
strategy(title="FLD's - Future Lines of Demarcation", overlay=true)
Period = input(title="Period", defval=40)
src = input(title="Source", defval=hl2)
reverse = input(false, title="Trade reverse")
FLD = src
pos = iff(FLD[Period] < close , 1,
       iff(FLD[Period] > close, -1, nz(pos[1], 0)))
possig = iff(reverse and pos == 1, -1,
         iff(reverse and pos == -1, 1, pos))
if (possig == 1)
    strategy.entry("Long", strategy.long)
if (possig == -1)
    strategy.entry("Short", strategy.short)
barcolor(possig == -1 ? red: possig == 1 ? green : blue)
plot(FLD, title="FLD", style=line, linewidth=1, color=black, offset = Period)
- 5-Day Moving Average Channel Breakout Strategy Combined With Mileage Concept
- Breakout Reversal Strategy with Stop Loss
- Momentum Breakthrough EMA Strategy
- Squeeze Momentum Trading Strategy Based on LazyBear Indicator
- Camarilla Pivot Points Strategy Based on Bollinger Bands
- Trend Following Strategy Based on EMA Lines
- Dynamic Envelope Moving Average Strategy
- Moving Average Crossover Trend Following Strategy
- Stepwise Pyramiding Moving Average Breakout Strategy
- Bollinger Bands Dual-track Breakthrough Strategy
- Quant Trading Strategy Based on SuperTrend Channel
- Profit rate theory volatility index quantification strategy
- Relative Strength Index Long-term Quant Strategy
- Dual Moving Average Tracking Stop Loss Strategy
- RSI and WMA Crossover Strategy
- Dynamic SMA Cross Trend Strategy
- Dual MA Indicator Oscillating Price Tracking Strategy
- Dual Moving Average Supertrend Quantitative Trading Strategy
- Trend Following Quant Strategy Based on Hull and LSMA Indicators
- Moving Average and RSI Crossover Strategy