Bollinger Bands Dual-track Breakthrough Strategy
Author: ChaoZhang, Date: 2024-02-05 14:05:47Tags:

Overview
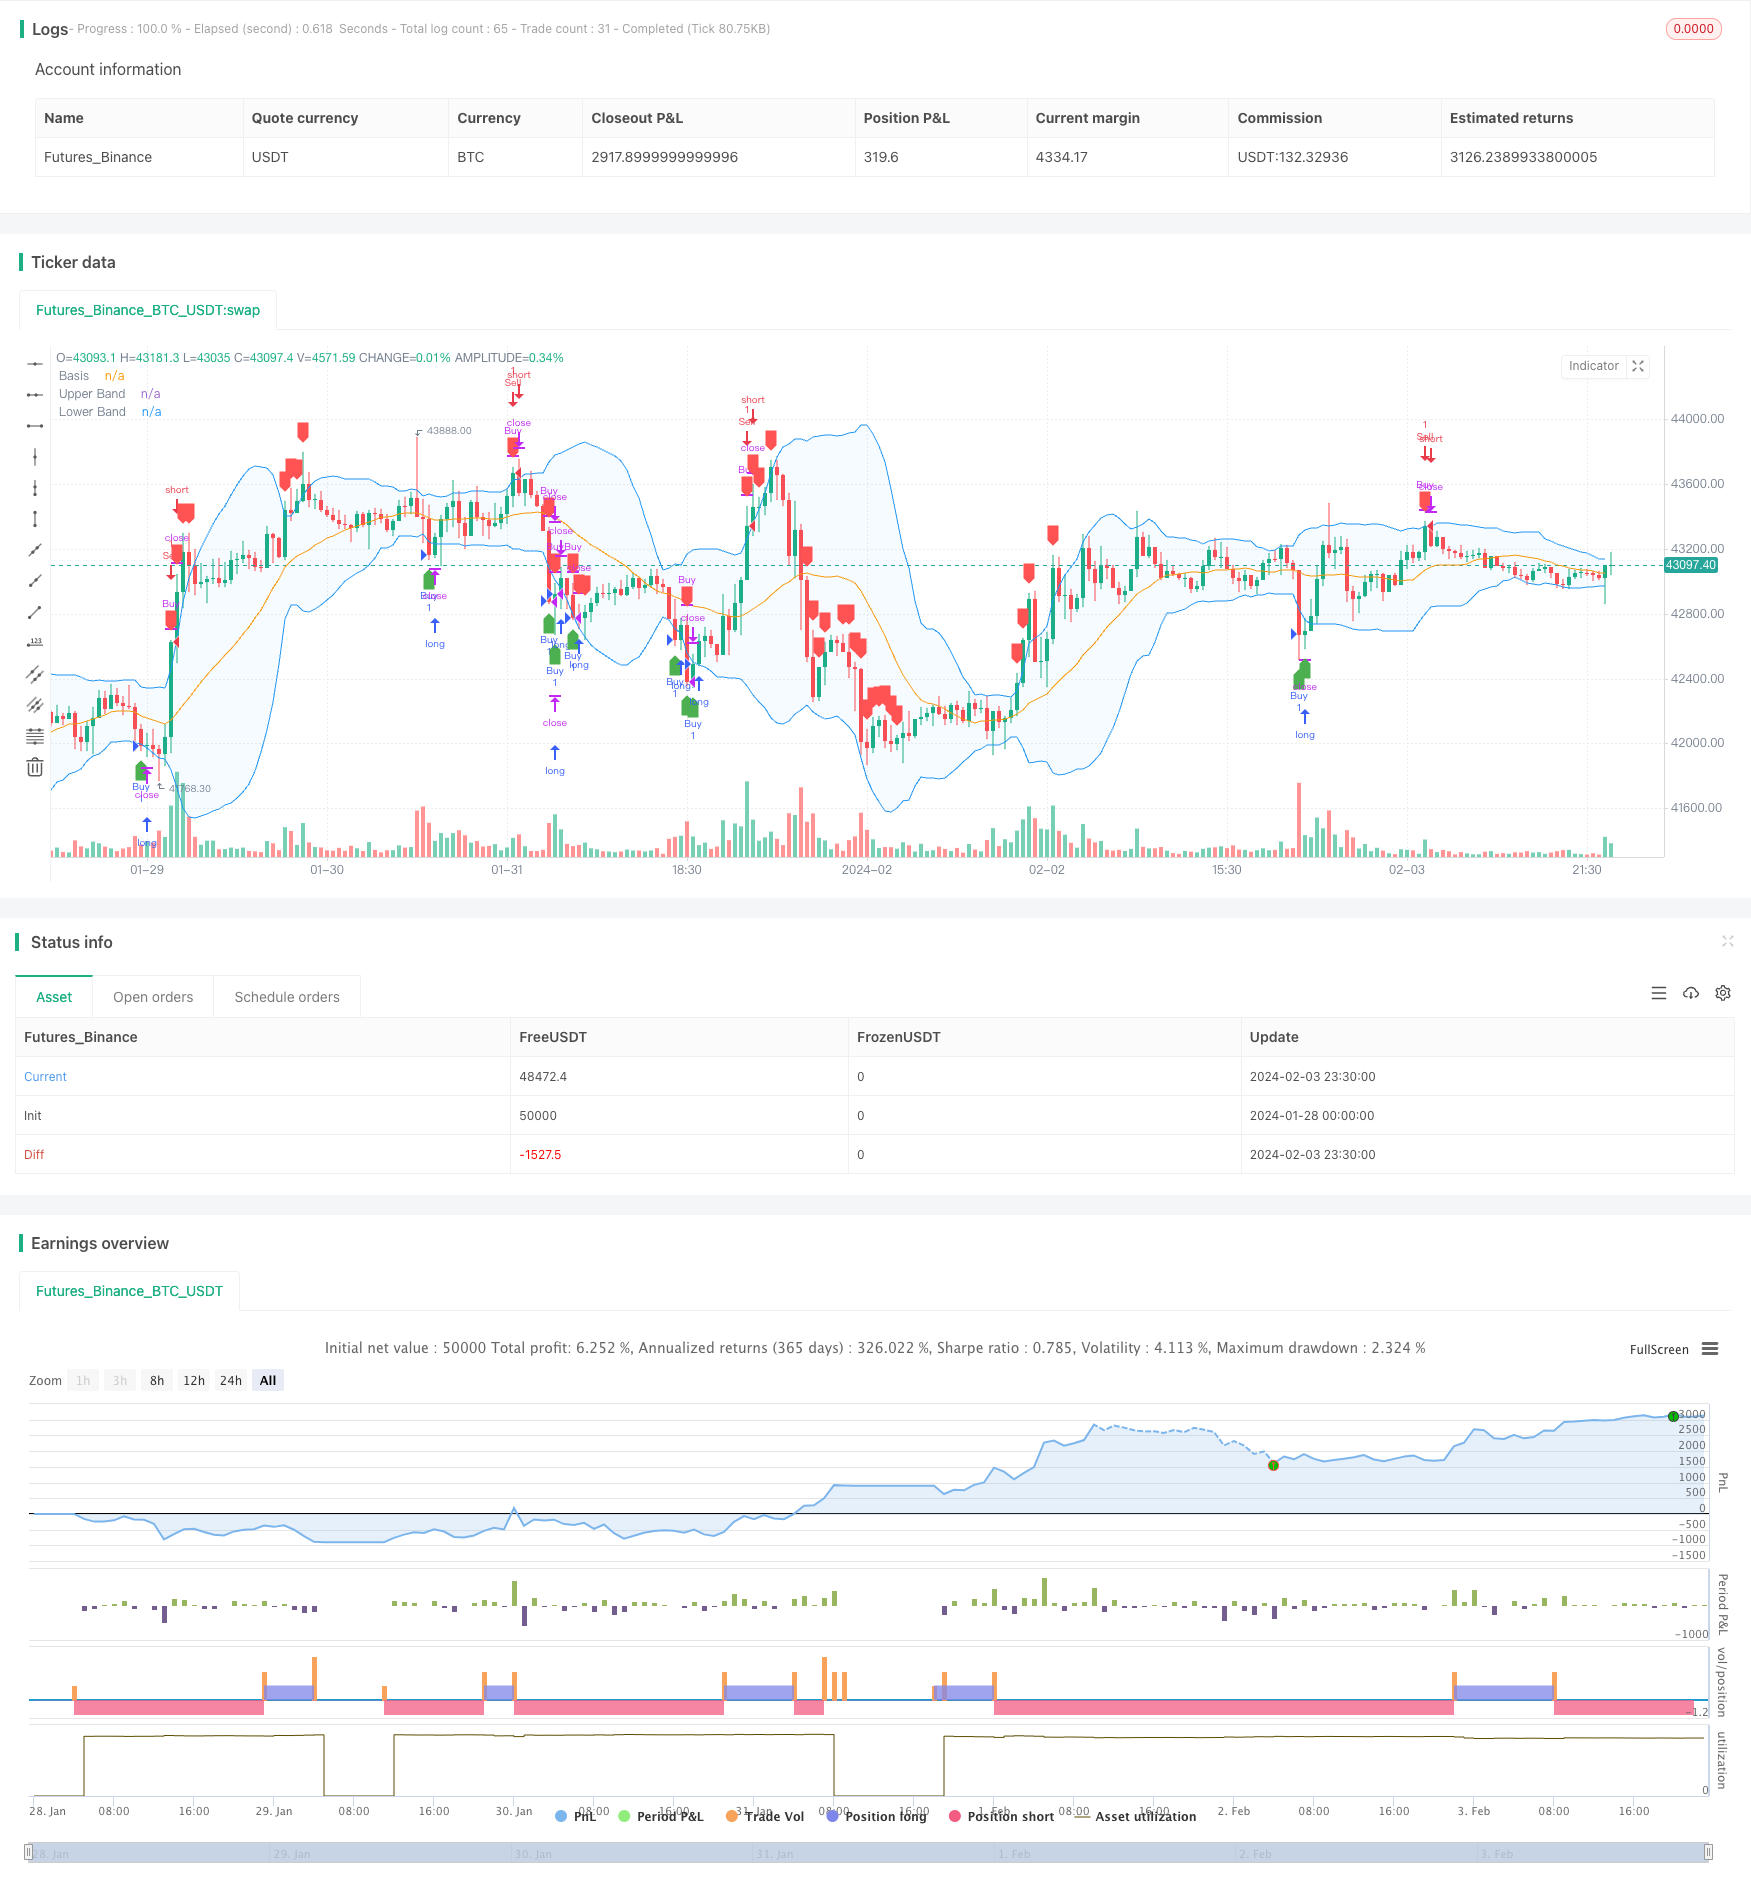
This strategy is a dual-track breakthrough trading strategy based on Bollinger Bands. It uses the upper and lower rails of Bollinger Bands as buy and sell signals, and sets a stop loss point to control risks.
Strategy Principle
The strategy uses the upper and lower rails of the Bollinger Bands. Bollinger Bands consist of a moving average and two standard deviation channels corresponding to it. A sell signal is generated when the price touches or breaks through the upper rail of the Bollinger Bands; A buy signal is generated when the price touches or breaks through the lower rail of the Bollinger Bands. In addition, the strategy also sets a stop loss point. When the price is lower than a certain percentage of the moving average, a stop loss will be identified.
Specifically, the strategy calculates the moving average and twice the standard deviation of the specified cycle (such as 20 days) to plot the Bollinger Bands. The upper rail is the moving average plus twice the standard deviation, and the lower rail is the moving average minus twice the standard deviation. When the closing price is greater than or equal to the upper rail, a sell signal is issued; when the closing price is less than or equal to the lower rail, a buy signal is issued. In addition, if the price is lower than a certain percentage (such as 1%) of the moving average, a stop loss signal is issued.
Strategy Advantages
The strategy utilizes the characteristics of Bollinger Bands to issue trading signals when abnormal price fluctuations occur, thus capturing opportunities for price reversals. Compared with simple moving average tracking strategies, this strategy can generate trading signals when volatility increases, avoiding the risk of false breakouts to some extent.
Compared with simple dual-track breakthrough strategies, this strategy adds a stop-loss mechanism. This can effectively control the loss caused by individual wrong signals. The setting of the stop loss point is also relatively reasonable, close to the moving average, avoiding excessive stop loss causing too much loss.
Strategy Risks
The biggest risk of this strategy is that Bollinger Bands itself cannot guarantee the validity of trading signals. When special situations occur in the market, prices may fluctuate sharply and abnormally, in which case the trading signals issued by Bollinger Bands may be wrong. This is likely to cause considerable losses.
In addition, the setting of stop loss points may also be too aggressive or conservative, which will affect the final income. If the stop loss range is too large, valid signals may be stopped loss frequently; if the stop loss range is too small, it cannot effectively control the loss.
Strategy Optimization Directions
The strategy can be optimized in the following aspects:
Test different parameter combinations, such as different values of moving average cycle, standard deviation multiplier, stop loss percentage, etc., to find the optimal parameters;
Increase other indicators to judge and form multiple filter conditions to avoid wrong signals;
Optimize stop loss strategies, such as using moving stop loss, batch stop loss instead of simple stop loss;
Confirm trading signals by combining Bollinger Bands of different time cycles to avoid being trapped.
Summary
Overall, this strategy is a practical combination of trend tracking and dual-track breakthrough strategies. It can seize opportunities for reversals when price fluctuations increase, and sets stop losses to control risks. By means of parameter optimization, increased signal filtering, optimized stop loss strategies, etc., the stability and profitability of the strategy can be further enhanced.
/*backtest
start: 2024-01-28 00:00:00
end: 2024-02-04 00:00:00
period: 30m
basePeriod: 15m
exchanges: [{"eid":"Futures_Binance","currency":"BTC_USDT"}]
*/

//@version=5
strategy("Bollinger Bands Strategy by Royce Mars", overlay=true)

length = input.int(20, minval=1)
maType = input.string("SMA", "Basis MA Type", options = ["SMA", "EMA", "SMMA (RMA)", "WMA", "VWMA"])
src = input(close, title="Source")
mult = input.float(2.0, minval=0.001, maxval=50, title="StdDev")
stopLossPercent = input.float(1.0, title="Stop Loss Percent", minval=0.1, maxval=10, step=0.1)

ma(source, length, _type) =>
    switch _type
        "SMA" => ta.sma(source, length)
        "EMA" => ta.ema(source, length)
        "SMMA (RMA)" => ta.rma(source, length)
        "WMA" => ta.wma(source, length)
        "VWMA" => ta.vwma(source, length)

basis = ma(src, length, maType)
dev = mult * ta.stdev(src, length)
upper = basis + dev
lower = basis - dev

// Buy and Sell Conditions
buyCondition = close <= lower
sellCondition = close >= upper

// Stop Loss Condition
stopLossCondition = close < basis * (1 - stopLossPercent / 100)

// Strategy Execution
strategy.entry("Buy", strategy.long, when=buyCondition)
strategy.close("Buy", when=sellCondition or stopLossCondition)

strategy.entry("Sell", strategy.short, when=sellCondition)
strategy.close("Sell", when=buyCondition)

// Plotting on the Chart
plotshape(buyCondition, title="Buy Signal", color=color.green, style=shape.labelup, location=location.belowbar)
plotshape(sellCondition or stopLossCondition, title="Sell Signal", color=color.red, style=shape.labeldown, location=location.abovebar)

// Plotting the Bollinger Bands
plot(basis, "Basis", color=color.orange)
p1 = plot(upper, "Upper Band", color=color.blue)
p2 = plot(lower, "Lower Band", color=color.blue)
fill(p1, p2, title="Background", color=color.rgb(33, 150, 243, 95))
- Stochastic and Moving Average Crossover Trend Following Quantitative Strategy
- 5-Day Moving Average Channel Breakout Strategy Combined With Mileage Concept
- Breakout Reversal Strategy with Stop Loss
- Momentum Breakthrough EMA Strategy
- Squeeze Momentum Trading Strategy Based on LazyBear Indicator
- Camarilla Pivot Points Strategy Based on Bollinger Bands
- Trend Following Strategy Based on EMA Lines
- Dynamic Envelope Moving Average Strategy
- Moving Average Crossover Trend Following Strategy
- Stepwise Pyramiding Moving Average Breakout Strategy
- Future Lines of Demarcation Backtest Strategy
- Quant Trading Strategy Based on SuperTrend Channel
- Profit rate theory volatility index quantification strategy
- Relative Strength Index Long-term Quant Strategy
- Dual Moving Average Tracking Stop Loss Strategy
- RSI and WMA Crossover Strategy
- Dynamic SMA Cross Trend Strategy
- Dual MA Indicator Oscillating Price Tracking Strategy
- Dual Moving Average Supertrend Quantitative Trading Strategy
- Trend Following Quant Strategy Based on Hull and LSMA Indicators