Moving Average Crossover Trend Following Strategy
Author: ChaoZhang, Date: 2024-02-05 14:12:27Tags:

Overview
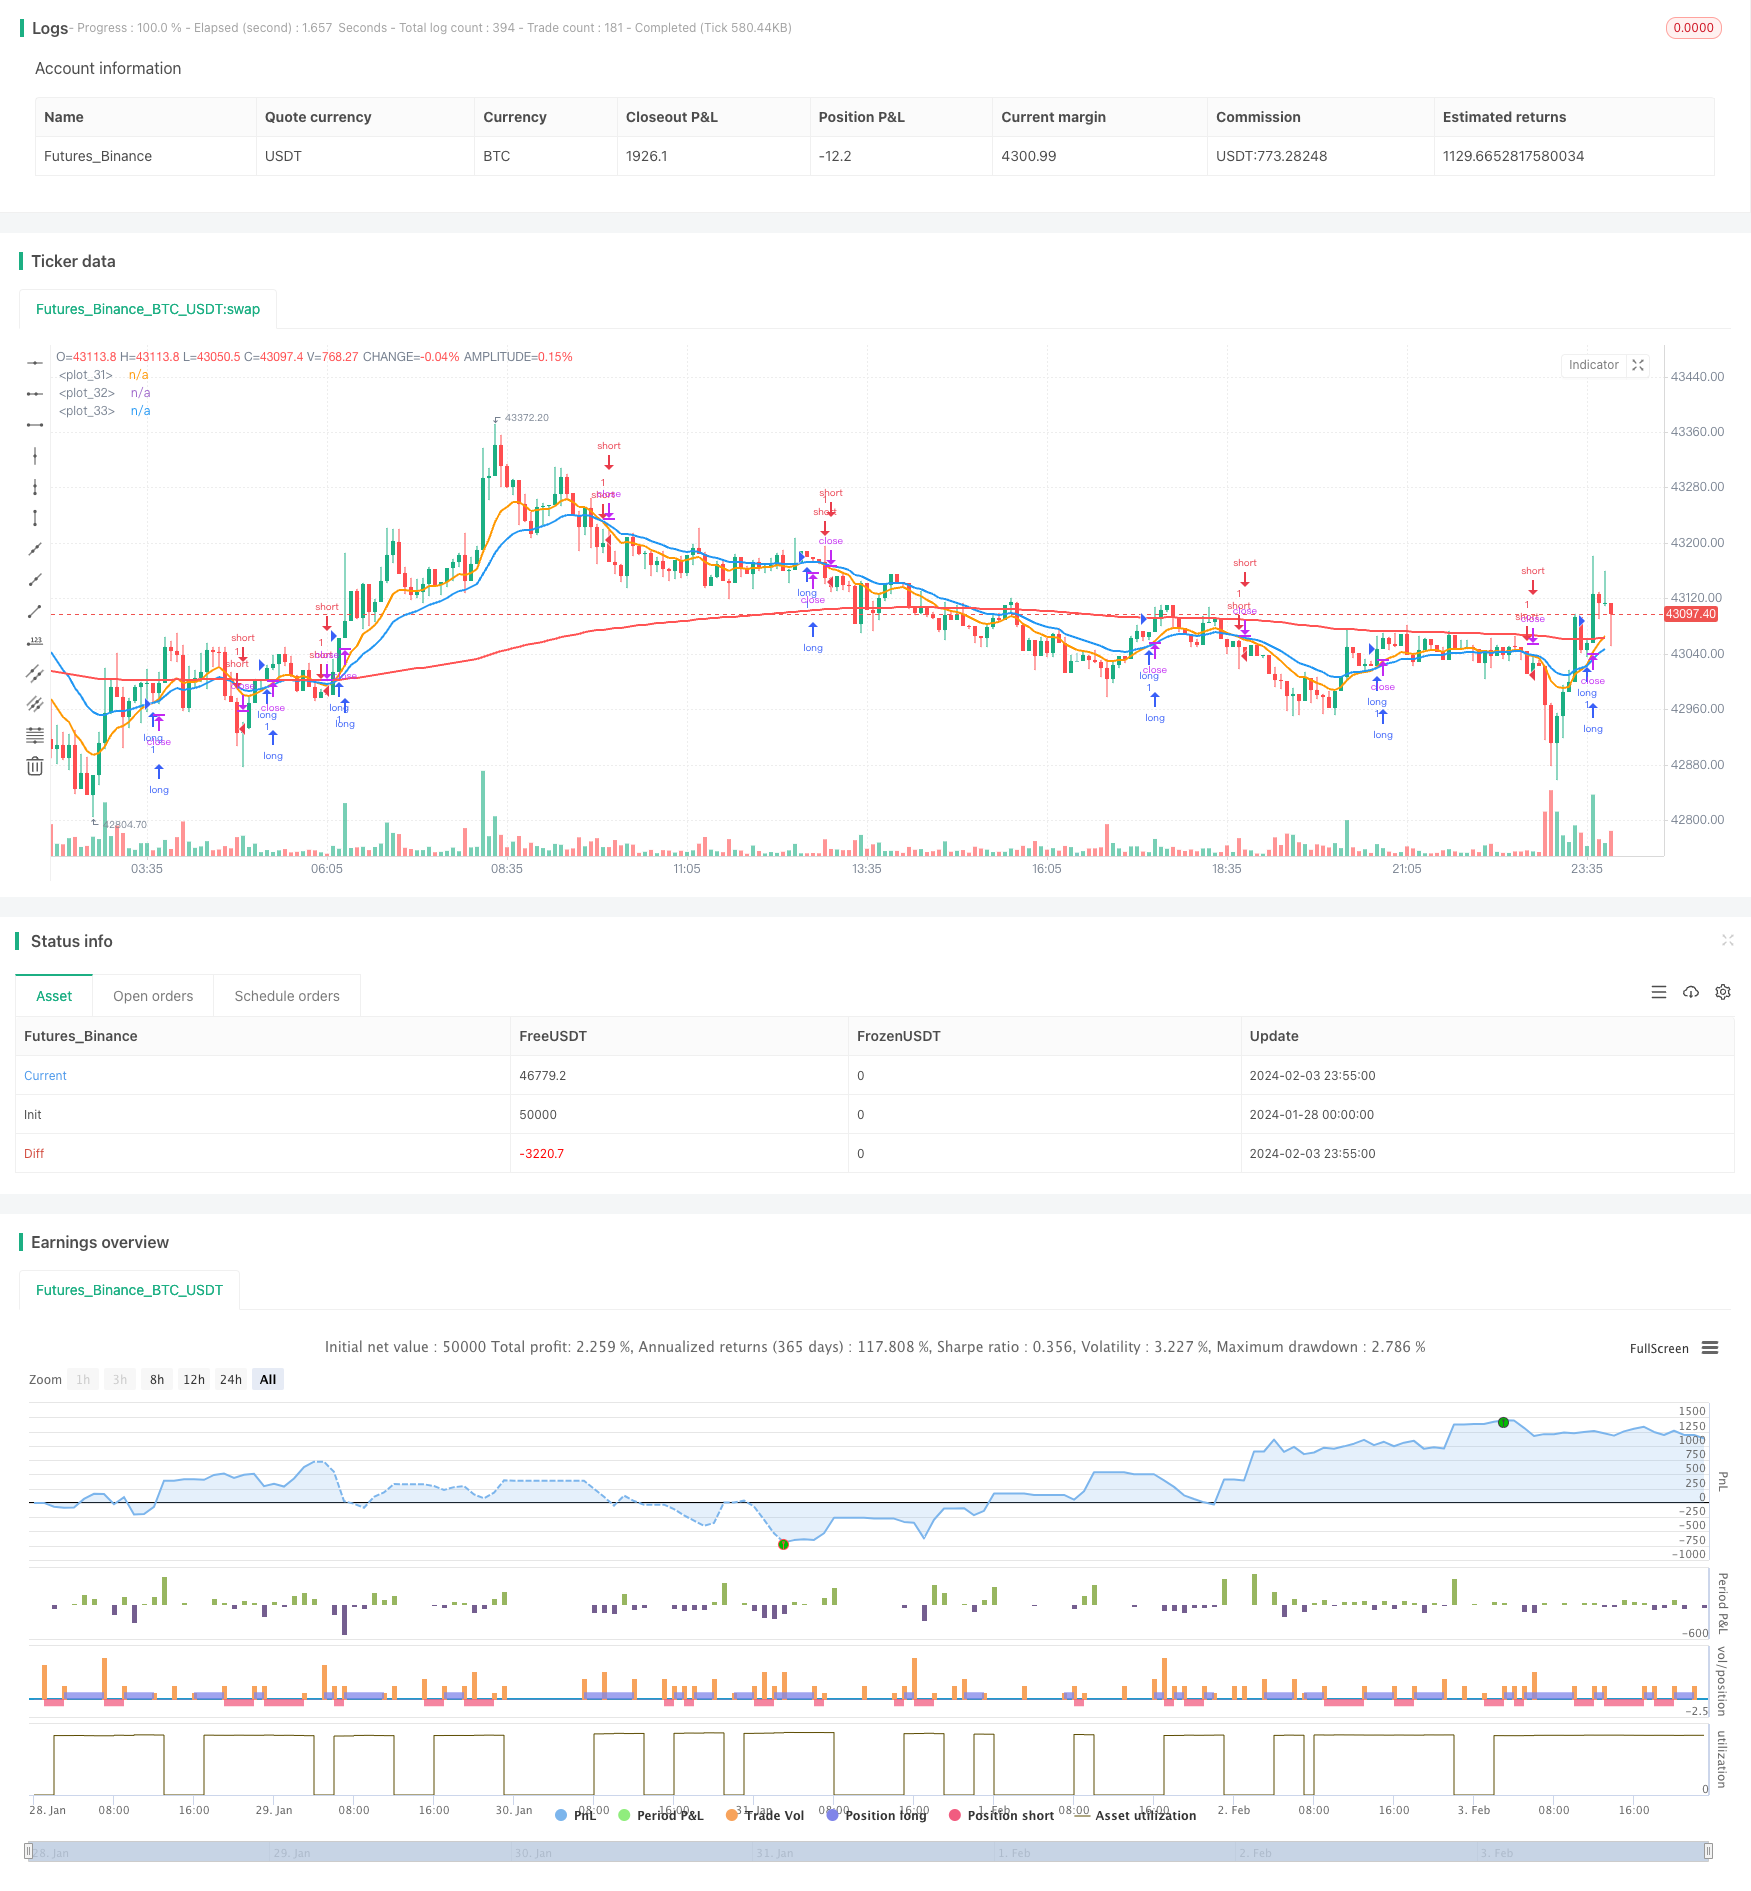
The Moving Average Crossover Trend Following strategy is a quantitative trading strategy that tracks market trends. The strategy generates trading signals by calculating fast and slow moving averages and catching turning points in market trends when crossovers occur.
Strategy Logic
The core principle of this strategy is to judge market trends using exponential moving averages (EMAs) with different parameters. The strategy defines a fast EMA and a slow EMA. When the fast EMA crosses above the slow EMA, it indicates a bullish trend reversal in the market. When the fast EMA crosses below the slow EMA, it indicates a bearish trend reversal.
On upward crosses, the strategy will open long positions. On downward crosses, the strategy will open short positions. The strategy will hold its position until take profit or stop loss is triggered, or a crossover in the opposite direction occurs again.
Advantage Analysis
The strategy has the following advantages:
- The strategy logic is simple and clear, easy to understand and implement, suitable for beginners;
- Using EMAs to smooth prices can effectively filter out market noise and identify trends;
- Parameters can be flexibly adjusted to adapt to markets with different cycles;
- The strategy can be extended to multi-timeframe versions to improve stability.
Risk Analysis
The strategy also has some risks:
- In ranging markets, multiple stop losses may occur, impacting profitability;
- It cannot effectively identify trend types (bullish or bearish), which may lead to severe losses;
- Improper EMA parameter settings may lead to over-trading or detection delays.
To mitigate risks, consider combining other indicators to determine trend types, or set wider stop loss ratios.
Optimization Directions
The strategy can also be optimized in the following aspects:
- Increase judgment of trend types to avoid opening positions against the trend;
- Add multi-timeframe judgments to improve signal quality;
- Dynamically adjust stop loss and take profit ratios to optimize exit points;
- Combine other indicators to filter out erroneous trades.
Conclusion
In summary, the Moving Average Crossover Trend Following Strategy is a simple and practical trend trading strategy. The core ideas of the strategy are clear and easy to implement, and there is also room for optimization. By adjusting parameters, adding multi-timeframe analysis, dynamic stops etc, the stability and profitability of the strategy can be continuously improved.
/*backtest
start: 2024-01-28 00:00:00
end: 2024-02-04 00:00:00
period: 5m
basePeriod: 1m
exchanges: [{"eid":"Futures_Binance","currency":"BTC_USDT"}]
*/

//@version=5
strategy('Zhukov trade', overlay=true, calc_on_every_tick=true, currency=currency.USD)

// INPUT:

// Options to enter fast and slow Exponential Moving Average (EMA) values
emaFast = input.int(title='Fast EMA', defval=10, minval=1, maxval=9999)
emaSlow = input.int(title='Slow EMA', defval=20, minval=1, maxval=9999)

// Option to select trade directions
tradeDirection = input.string(title='Trade Direction', options=['Long', 'Short', 'Both'], defval='Both')

// Options that configure the backtest date range
startDate = input(title='Start Date', defval=timestamp('01 Jan 2023 00:00'))
endDate = input(title='End Date', defval=timestamp('31 Dec 2030 23:59'))

// Set take profit and stop loss percentages
take_profit_percent = input(1.0, title ="Take Profit Percent") / 100.0
stop_loss_percent = input(1.0, title ="Stop Loss Percent") / 100.0

// CALCULATIONS:

// Use the built-in function to calculate two EMA lines
fastEMA = ta.ema(close, emaFast)
slowEMA = ta.ema(close, emaSlow)
emapos = ta.ema(close, 200)

// PLOT:

// Draw the EMA lines on the chart
plot(series=fastEMA, color=color.new(color.orange, 0), linewidth=2)
plot(series=slowEMA, color=color.new(color.blue, 0), linewidth=2)
plot(series=emapos, color=color.new(color.red, 0), linewidth=2)

// CONDITIONS:

// Check if the close time of the current bar falls inside the date range
inDateRange = true

// Translate input into trading conditions
longOK = tradeDirection == 'Long' or tradeDirection == 'Both'
shortOK = tradeDirection == 'Short' or tradeDirection == 'Both'

// Decide if we should go long or short using the built-in functions
longCondition = ta.crossover(fastEMA, slowEMA) and inDateRange
shortCondition = ta.crossunder(fastEMA, slowEMA) and inDateRange

// ORDERS:

// Submit entry (or reverse) orders
if longCondition and longOK
    strategy.entry(id='long', direction=strategy.long)

if shortCondition and shortOK
    strategy.entry(id='short', direction=strategy.short)

// Exit orders
if strategy.position_size > 0 and longOK
    strategy.exit(id='exit long', from_entry='long', limit=strategy.position_avg_price * (1 + take_profit_percent), stop=strategy.position_avg_price * (1 - stop_loss_percent))

if strategy.position_size < 0 and shortOK
    strategy.exit(id='exit short', from_entry='short', limit=strategy.position_avg_price * (1 - take_profit_percent), stop=strategy.position_avg_price * (1 + stop_loss_percent))
- Trend Following Stop Loss Strategy Based on Trend Alert Indicator
- Dual Smoothed Stochastic Bressert Strategy
- Stochastic and Moving Average Crossover Trend Following Quantitative Strategy
- 5-Day Moving Average Channel Breakout Strategy Combined With Mileage Concept
- Breakout Reversal Strategy with Stop Loss
- Momentum Breakthrough EMA Strategy
- Squeeze Momentum Trading Strategy Based on LazyBear Indicator
- Camarilla Pivot Points Strategy Based on Bollinger Bands
- Trend Following Strategy Based on EMA Lines
- Dynamic Envelope Moving Average Strategy
- Stepwise Pyramiding Moving Average Breakout Strategy
- Bollinger Bands Dual-track Breakthrough Strategy
- Future Lines of Demarcation Backtest Strategy
- Quant Trading Strategy Based on SuperTrend Channel
- Profit rate theory volatility index quantification strategy
- Relative Strength Index Long-term Quant Strategy
- Dual Moving Average Tracking Stop Loss Strategy
- RSI and WMA Crossover Strategy
- Dynamic SMA Cross Trend Strategy
- Dual MA Indicator Oscillating Price Tracking Strategy