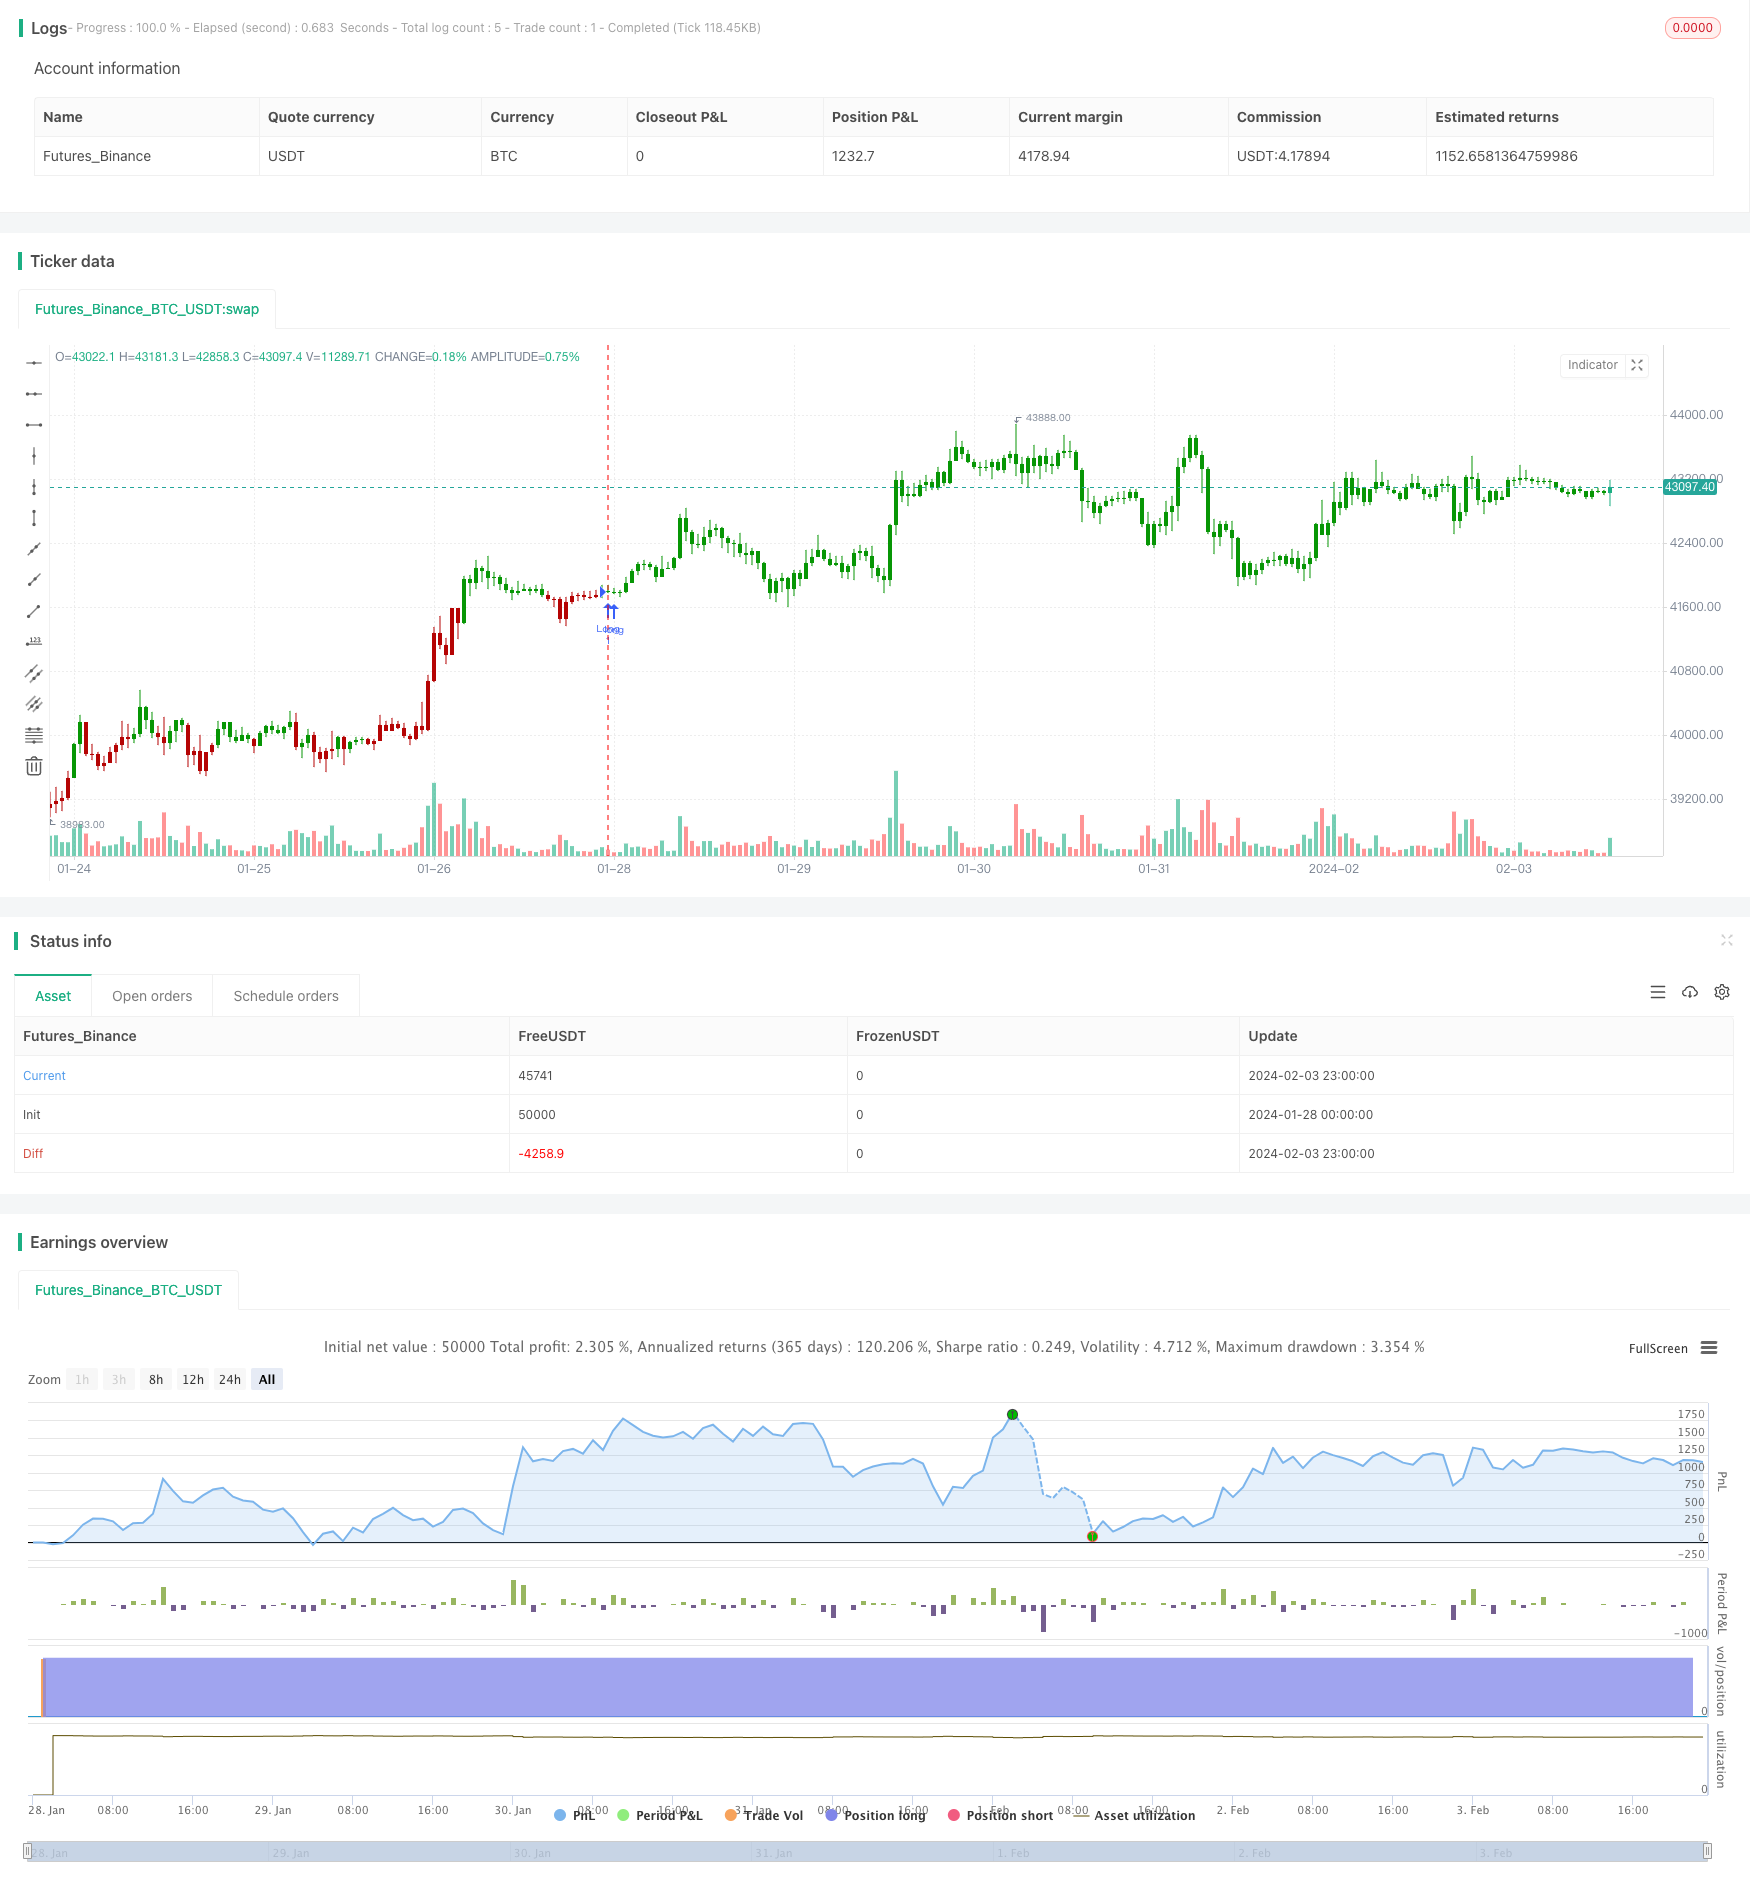
Camarilla Pivot Points Strategy Based on Bollinger Bands
Author: ChaoZhang, Date: 2024-02-05 14:23:59Tags:

Overview
This strategy first calculates the Camarilla pivot points based on the previous trading day’s highest price, lowest price and closing price. It then filters the price with Bollinger Bands indicator to generate trading signals when price breaks through the pivot points.
Strategy Logic
- Calculate highest price, lowest price and closing price of previous trading day
- Calculate Camarilla pivot lines including upper rails H4, H3, H2, H1 and lower rails L1, L2, L3, L4 according to formulas
- Calculate 20-day Bollinger Bands upper band and lower band
- Go long when price breaks above lower band, go short when price breaks below upper band
- Set stop loss near Bollinger Bands upper or lower band
Advantage Analysis
- Camarilla pivot lines contain multiple key support and resistance levels to enhance reliability of trading signals
- Combining with Bollinger Bands effectively filters false breakouts
- Multiple parameter combinations make trading flexible
Risk Analysis
- Improper Bollinger Bands parameter settings may cause wrong trading signals
- Camarilla pivot points rely on previous trading day’s price, may be impacted by overnight gaps
- Both long and short positions carry loss risks
Optimization Directions
- Optimize Bollinger Bands parameters to find best combination
- Add other indicators to filter false breakout signals
- Increase stop loss strategies to reduce single loss
Summary
This strategy combines Camarilla pivot lines and Bollinger Bands, generating trading signals when price breaks key support and resistance levels. Strategy profitability and stability can be improved through parameter optimization and signal filtering. Overall, this strategy has clear trading logic and high operability, worth live trading verification.
/*backtest
start: 2024-01-28 00:00:00
end: 2024-02-04 00:00:00
period: 1h
basePeriod: 15m
exchanges: [{"eid":"Futures_Binance","currency":"BTC_USDT"}]
*/

//@version=4
////////////////////////////////////////////////////////////
//  Copyright by HPotter v1.0 12/05/2020
// Camarilla pivot point formula is the refined form of existing classic pivot point formula.
// The Camarilla method was developed by Nick Stott who was a very successful bond trader.
// What makes it better is the use of Fibonacci numbers in calculation of levels.
//
// Camarilla equations are used to calculate intraday support and resistance levels using
// the previous days volatility spread. Camarilla equations take previous day’s high, low and
// close as input and generates 8 levels of intraday support and resistance based on pivot points.
// There are 4 levels above pivot point and 4 levels below pivot points. The most important levels
// are L3 L4 and H3 H4. H3 and L3 are the levels to go against the trend with stop loss around H4 or L4 .
// While L4 and H4 are considered as breakout levels when these levels are breached its time to
// trade with the trend.
//
// WARNING:
//  - For purpose educate only
//  - This script to change bars colors.
////////////////////////////////////////////////////////////
strategy(title="Camarilla Pivot Points V2 Backtest", shorttitle="CPP V2", overlay = true)
res = input(title="Resolution", type=input.resolution, defval="D")
width = input(1, minval=1)
SellFrom = input(title="Sell from ", defval="R1", options=["R1", "R2", "R3", "R4"])
BuyFrom = input(title="Buu from ", defval="S1", options=["S1", "S2", "S3", "S4"])
reverse = input(false, title="Trade reverse")
xHigh  = security(syminfo.tickerid,res, high)
xLow   = security(syminfo.tickerid,res, low)
xClose = security(syminfo.tickerid,res, close)
H4 = (0.55*(xHigh-xLow)) + xClose
H3 = (0.275*(xHigh-xLow)) + xClose
H2 = (0.183*(xHigh-xLow)) + xClose
H1 = (0.0916*(xHigh-xLow)) + xClose
L1 = xClose - (0.0916*(xHigh-xLow))
L2 = xClose - (0.183*(xHigh-xLow))
L3 = xClose - (0.275*(xHigh-xLow))
L4 = xClose - (0.55*(xHigh-xLow))
pos = 0
S = iff(BuyFrom == "S1", H1,
      iff(BuyFrom == "S2", H2,
       iff(BuyFrom == "S3", H3,
         iff(BuyFrom == "S4", H4,0))))
B = iff(SellFrom == "R1", L1,
      iff(SellFrom == "R2", L2,
       iff(SellFrom == "R3", L3,
         iff(SellFrom == "R4", L4,0))))
pos := iff(close > B, 1,
       iff(close < S, -1, nz(pos[1], 0)))
possig = iff(reverse and pos == 1, -1,
          iff(reverse and pos == -1 , 1, pos))
if (possig == 1)
    strategy.entry("Long", strategy.long)
if (possig == -1)
    strategy.entry("Short", strategy.short)
if (possig == 0)
    strategy.close_all()
barcolor(possig == -1 ? #b50404: possig == 1 ? #079605 : #0536b3 )
More
- A Dual Reversal Momentum Index Trading Strategy
- Bottom Hunter Strategy
- Bollinger Band Strategy with Date Range Selection
- Trend Following Stop Loss Strategy Based on Trend Alert Indicator
- Dual Smoothed Stochastic Bressert Strategy
- Stochastic and Moving Average Crossover Trend Following Quantitative Strategy
- 5-Day Moving Average Channel Breakout Strategy Combined With Mileage Concept
- Breakout Reversal Strategy with Stop Loss
- Momentum Breakthrough EMA Strategy
- Squeeze Momentum Trading Strategy Based on LazyBear Indicator
- Trend Following Strategy Based on EMA Lines
- Dynamic Envelope Moving Average Strategy
- Moving Average Crossover Trend Following Strategy
- Stepwise Pyramiding Moving Average Breakout Strategy
- Bollinger Bands Dual-track Breakthrough Strategy
- Future Lines of Demarcation Backtest Strategy
- Quant Trading Strategy Based on SuperTrend Channel
- Profit rate theory volatility index quantification strategy
- Relative Strength Index Long-term Quant Strategy
- Dual Moving Average Tracking Stop Loss Strategy