EMA Crossover Trend Following Trading Strategy
Author: ChaoZhang, Date: 2024-02-19 10:39:22Tags:

Overview
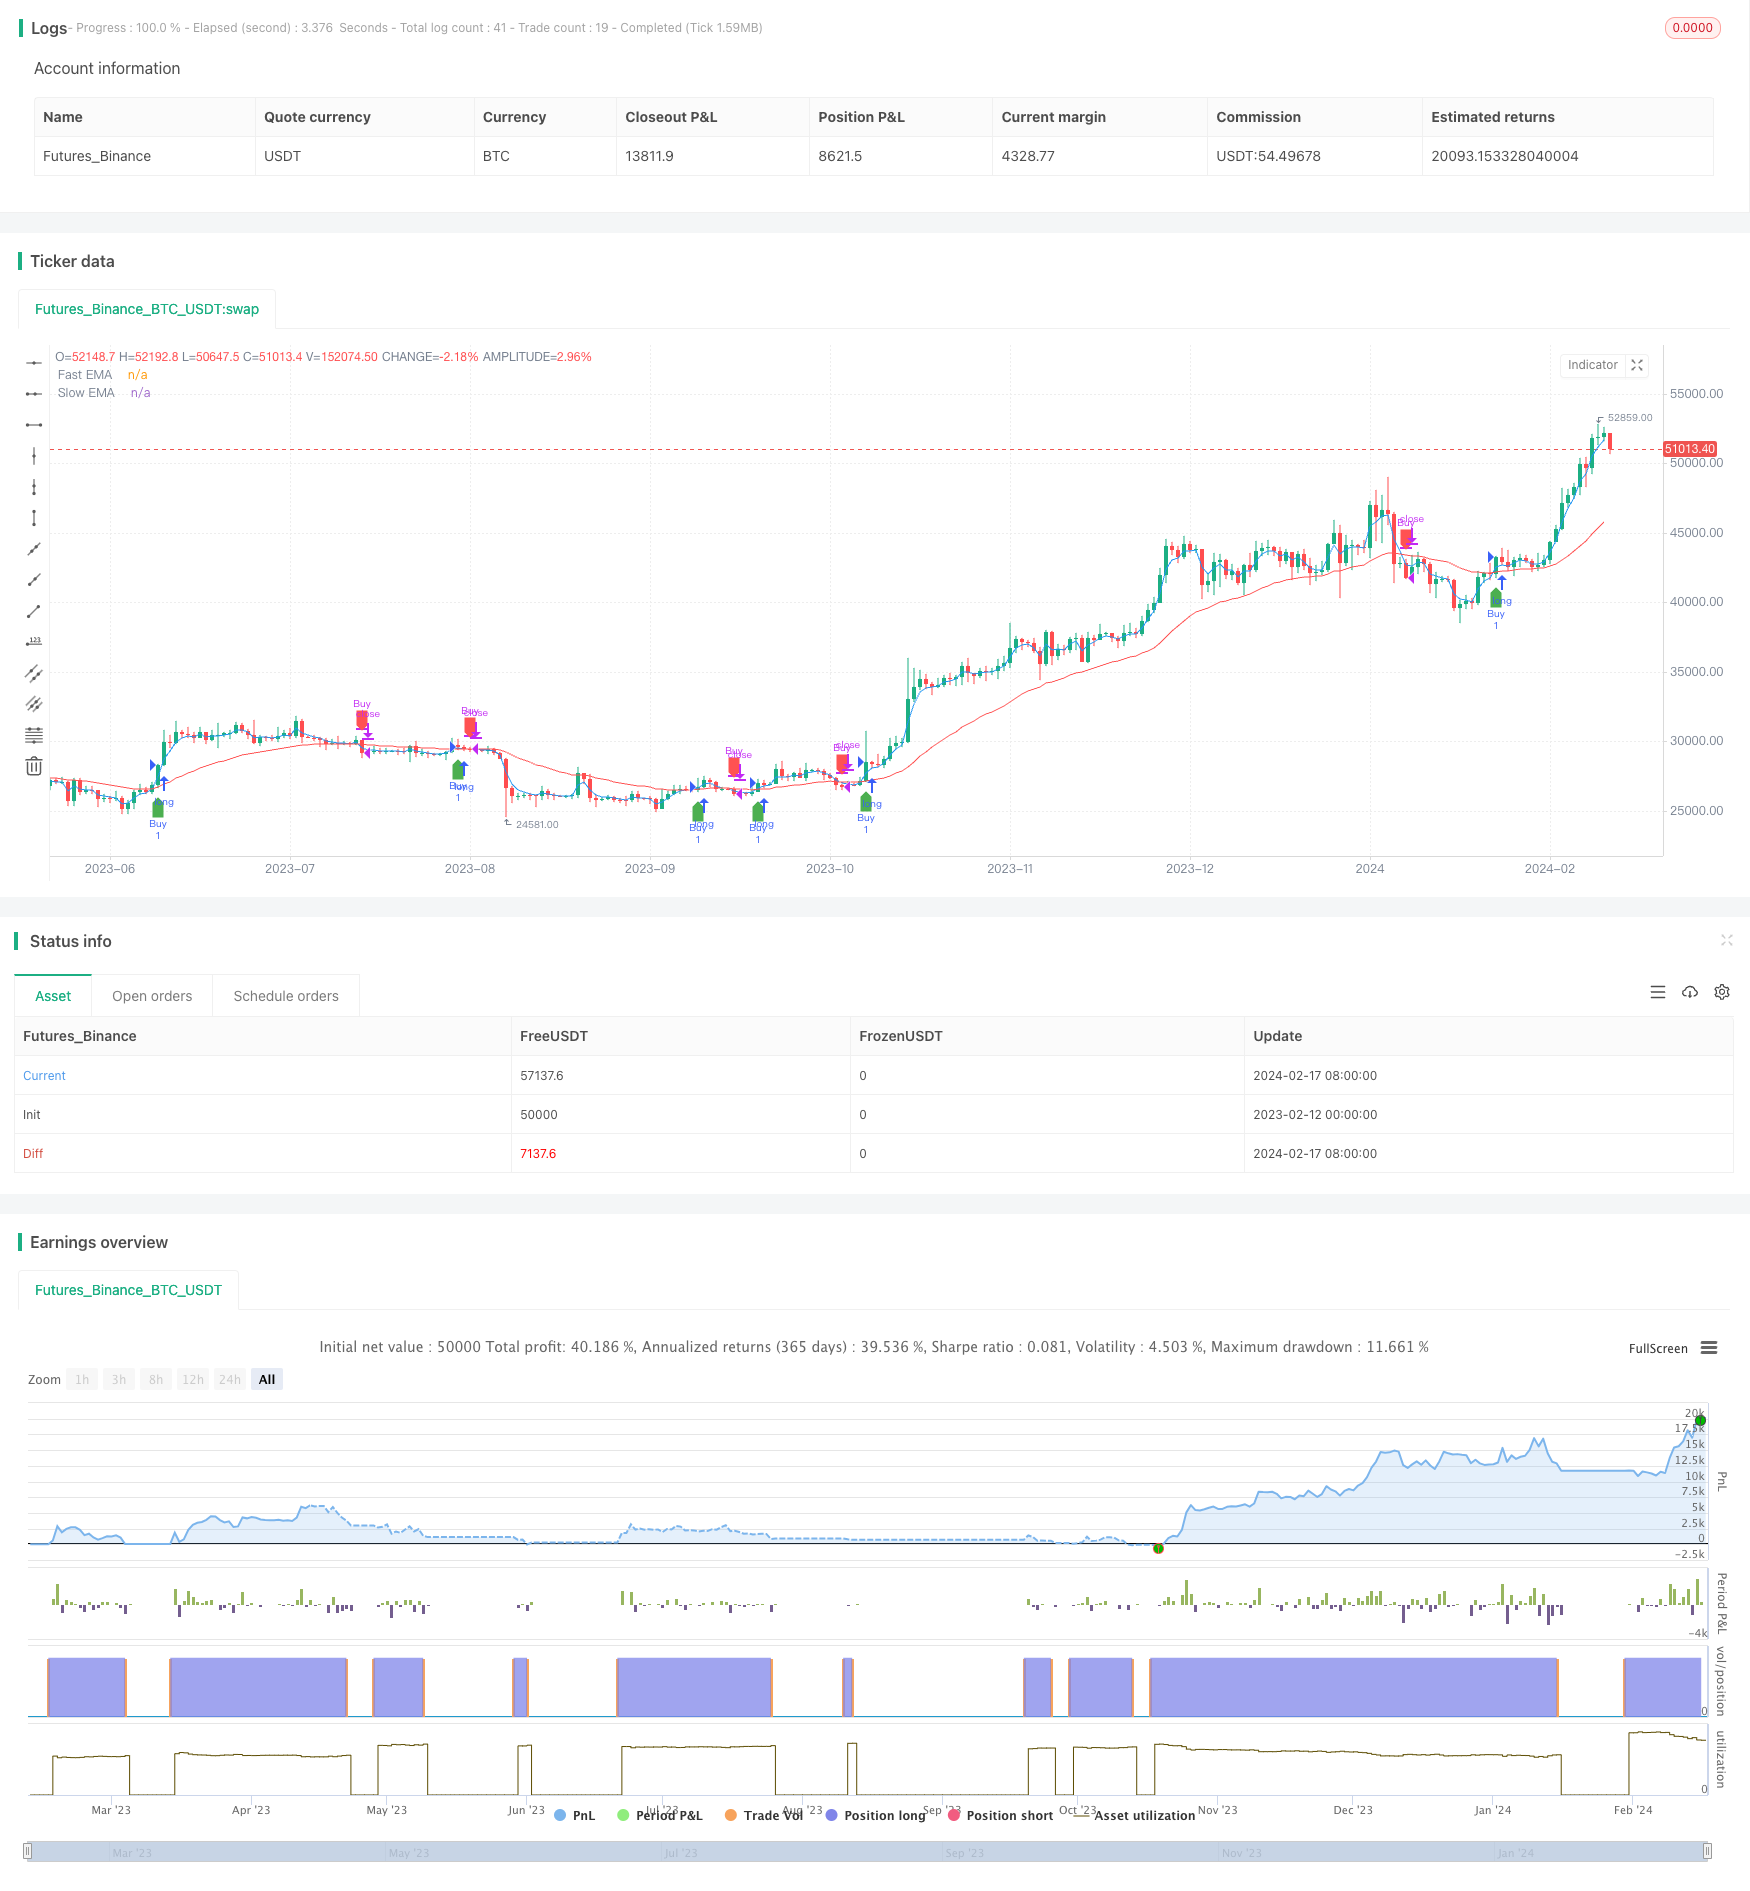
This strategy uses the golden cross and death cross of fast and slow EMA lines to determine the trend and sets a profit percentage as the take profit rule to implement trend following trading. It is applicable to any timeframe and can capture trends in both indexes and stocks.
Strategy Logic
The strategy employs 3 and 30 period EMAs as trading signals. When the 3EMA crosses above the 30EMA, it signals that price starts to rise which conforms to the buy condition. When the 3EMA crosses below the 30EMA, it signals that price starts to fall which conforms to the sell condition.
In addition, a profit target is configured in the strategy. When price rises to the entry price multiplied by the profit percentage, the position will be closed to lock in more profits and achieve trend following trading.
Advantage Analysis
- Using EMAs to determine trends is simple and easy to grasp.
- Combining trend indicators and take profit rules can effectively control risks and lock in profits.
- Applicable to any timeframe and tradable, great flexibility.
Risk Analysis
- EMA itself has lagging effect on price changes, may cause misjudgments.
- Overly large profit target may lead to failure in timely profit-taking, missing reversal opportunities.
- Stopping tracking too early may result in missing part of the trending move.
Optimization Directions
- Different EMA combinations can be tested to find the optimal parameters.
- Other indicators can be combined to verify the EMA signals and improve accuracy.
- The profit percentage can be dynamically tuned, relaxed during bull market and tightened during bear market.
Conclusion
In conclusion, this is a very practical trend following strategy. It adopts simple EMA indicators to determine the trend direction and sets reasonable profit taking rules to effectively control risks, suitable for long term tracking of stock and index mid-to-long term trends. Further improvements on stability and profit factor can be achieved through parameter optimization and supplementary signal verification indicators.
/*backtest
start: 2023-02-12 00:00:00
end: 2024-02-18 00:00:00
period: 1d
basePeriod: 1h
exchanges: [{"eid":"Futures_Binance","currency":"BTC_USDT"}]
*/

//@version=5
strategy("EMA Crossover Strategy with Target", shorttitle="EMACross", overlay=true)

// Define input parameters
fastLength = input(3, title="Fast EMA Length")
slowLength = input(30, title="Slow EMA Length")
profitPercentage = input(100.0, title="Profit Percentage")

// Calculate EMAs
fastEMA = ta.ema(close, fastLength)
slowEMA = ta.ema(close, slowLength)

// Plot EMAs on the chart
plot(fastEMA, color=color.blue, title="Fast EMA")
plot(slowEMA, color=color.red, title="Slow EMA")

// Buy condition: 3EMA crosses above 30EMA
buyCondition = ta.crossover(fastEMA, slowEMA)

// Sell condition: 3EMA crosses below 30EMA or profit target is reached
sellCondition = ta.crossunder(fastEMA, slowEMA) or close >= (strategy.position_avg_price * (1 + profitPercentage / 100))

// Target condition: 50 points profit
//targetCondition = close >= (strategy.position_avg_price + 50)

// Execute orders
// strategy.entry("Buy", strategy.long, when=buyCondition)
// strategy.close("Buy", when=sellCondition )
if (buyCondition)
    strategy.entry("Buy", strategy.long)

if (sellCondition)
    strategy.close("Buy")

// // Execute sell orders
// strategy.entry("Sell", strategy.short, when=sellCondition)
// strategy.close("Sell", when=buyCondition)

// Plot buy and sell signals on the chart
plotshape(series=buyCondition, title="Buy Signal", color=color.green, style=shape.labelup, location=location.belowbar)
plotshape(series=sellCondition, title="Sell Signal", color=color.red, style=shape.labeldown, location=location.abovebar)
- Best ABCD Pattern Trading Strategy with Stop Loss and Take Profit Tracking
- Major Trend Indicator Long
- Multi Timeframe Strategy
- Dynamic Balancing Leveraged ETF Investment Strategy
- Multi-timeframe MACD Indicator Crossover Trading Strategy
- Gem Forest 1 Minute Breakout Strategy
- Three High Candle Reversal Strategy
- MACD Moving Average Combination Cross-Period Dynamic Trend Strategy
- Gem Forest One Minute Scalping Strategy
- Signal Smoothing Ehlers Cyber Cycle Strategy
- Trend Following Strategy Based on Candlestick Direction
- Dual Confirmation MACD and RSI Strategy
- Williams Double Exponential Moving Average and Ichimoku Kinkou Hyo Strategy
- 3 10 Oscillator Profile Flagging Strategy
- Multi Timeframe RSI-SRSI Trading Strategy
- A Combined Strategy with MACD and RSI
- ATR, EOM and VORTEX Based Long Trend Strategy
- Dual Moving Average Intelligent Tracking Trading Strategy
- High Volume Low Breakout Compounded Position Sizing Strategy
- Bitcoin Dollar Cost Averaging Based on BEAM Bands