Multi-timeframe MACD Indicator Crossover Trading Strategy
Author: ChaoZhang, Date: 2024-02-19 11:03:54Tags:

Overview
The Multi-timeframe MACD Indicator Crossover Trading Strategy is a trend following strategy. It generates trading signals when the price breaks through the MACD indicator calculated with different parameter settings, enabling automated trading of stocks, indices, forex and other financial products.
Strategy Logic
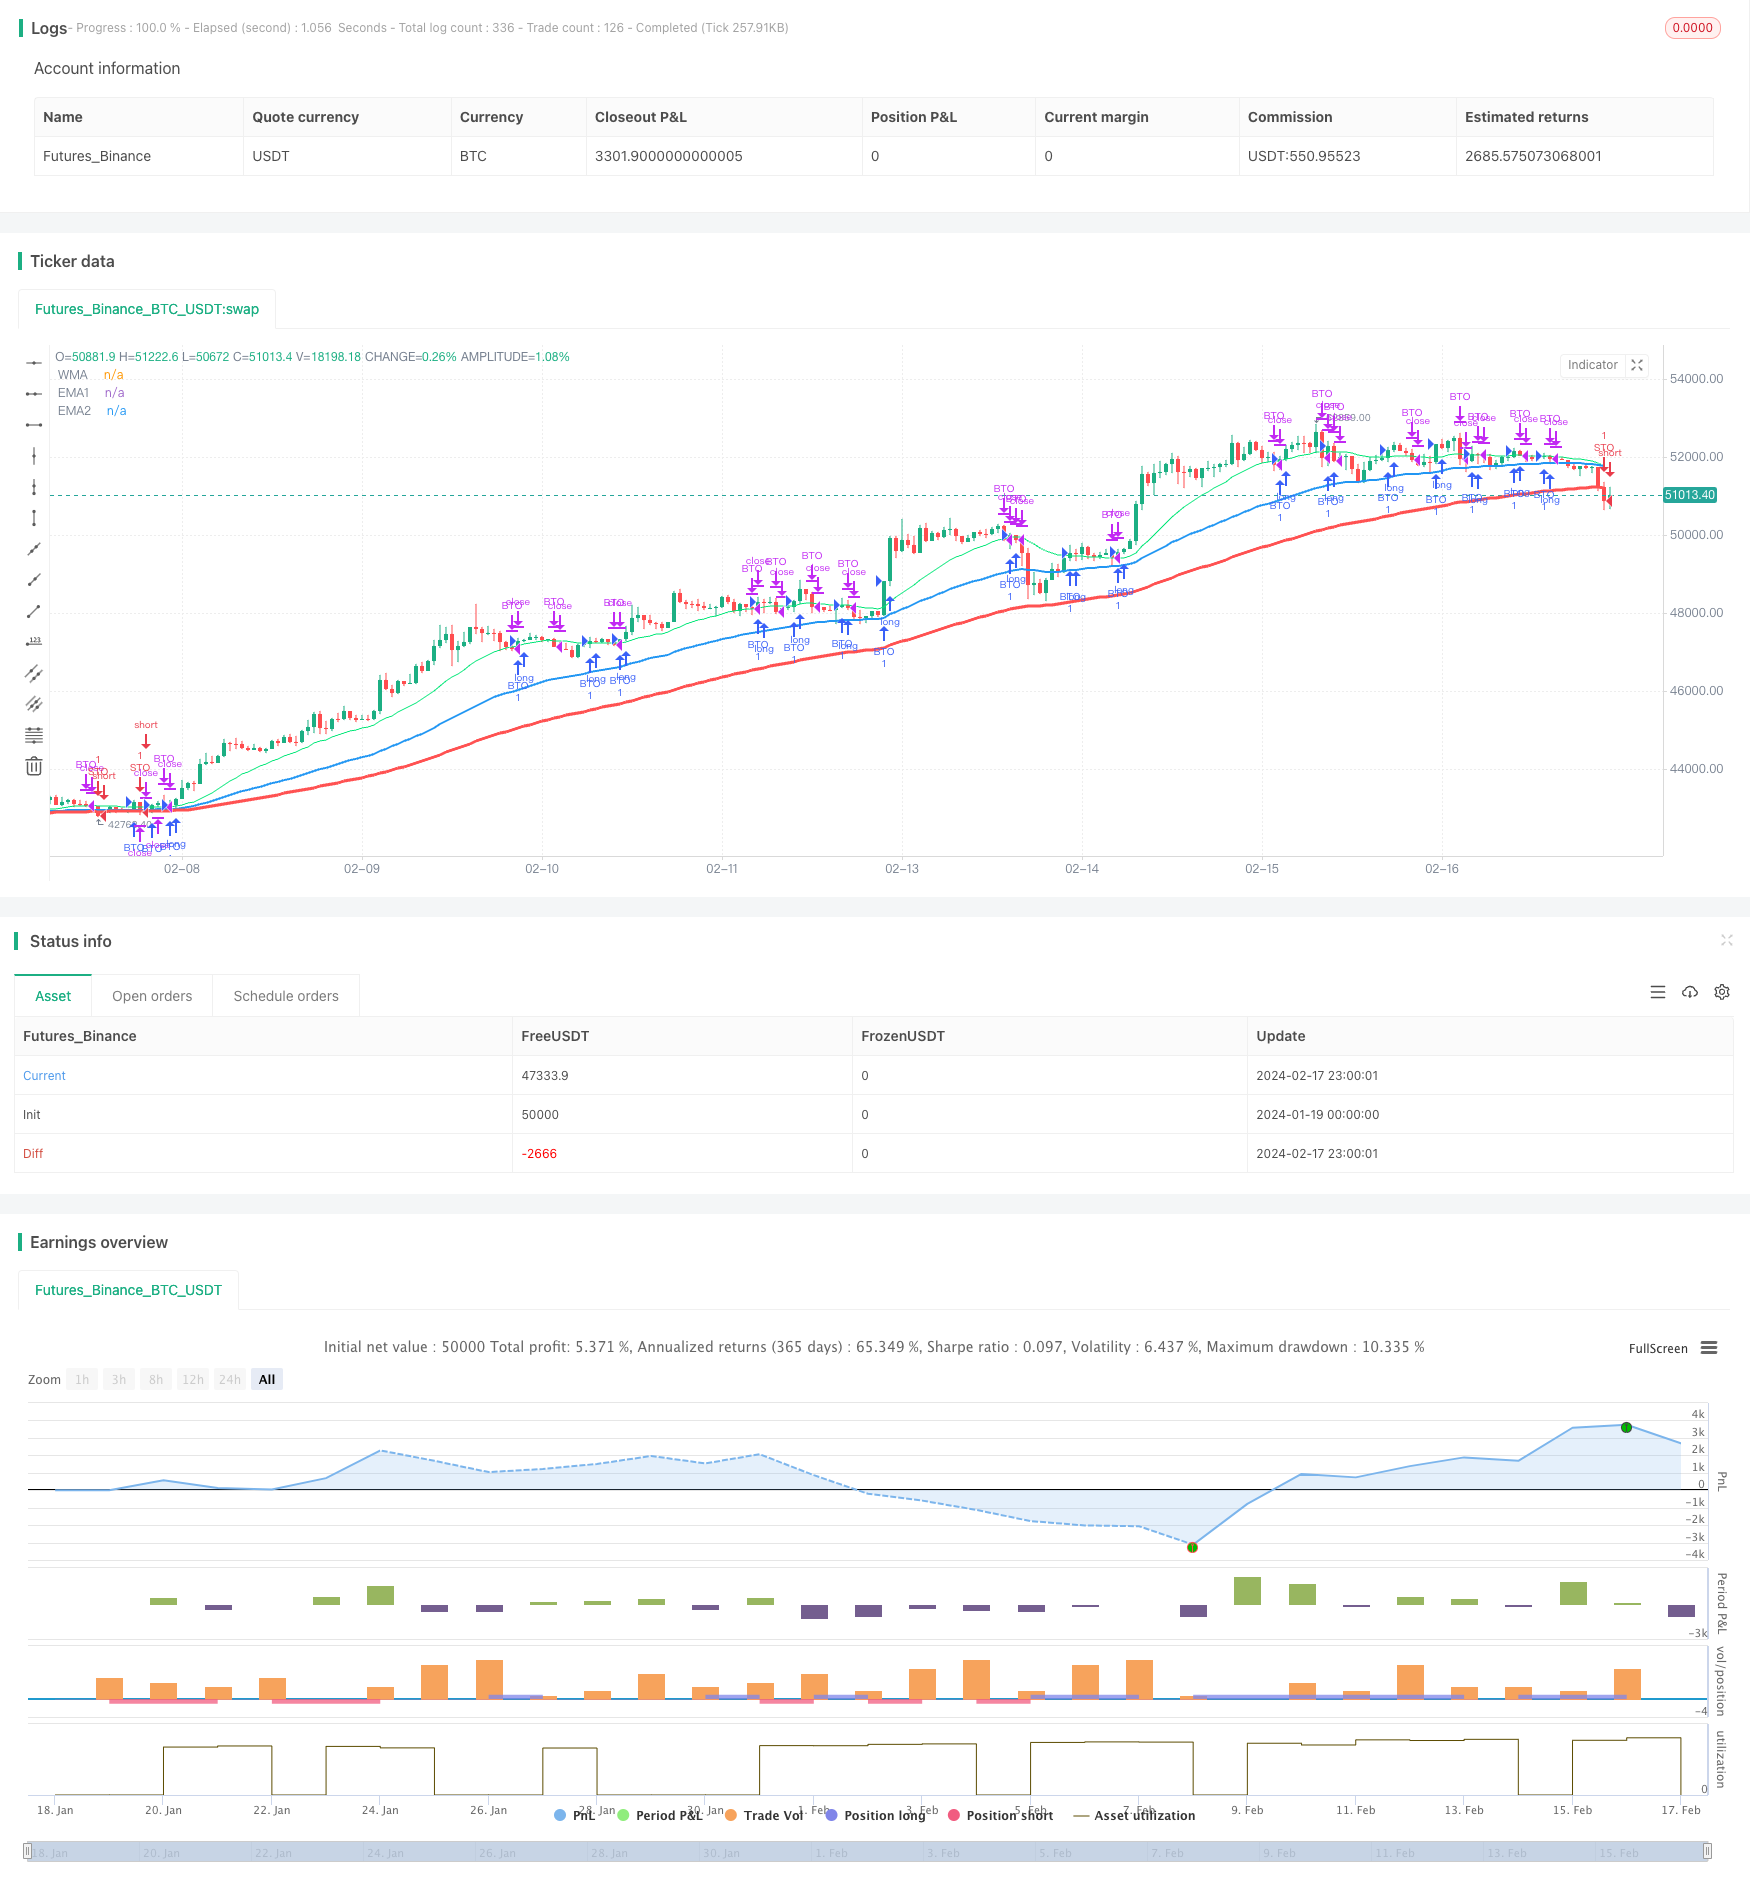
The strategy calculates 3 moving averages simultaneously: one weighted moving average WMA and two exponential moving averages EMA. The parameters of these three moving averages are set differently, which are 25 days, 50 days and 100 days respectively. This allows the moving averages to cover price movements over different periods.
After the moving averages are calculated, the strategy monitors whether the price breaks or falls below any of the moving averages. Trading signals are generated when the price simultaneously breaks or falls below all 3 moving averages.
For example, a buy signal is generated when the price is above all 3 moving averages at the same time. A sell signal is generated when the price falls below all 3 moving averages at the same time. Monitoring the price relative to the moving averages can determine reversal points of price movement.
By cross-judging with multi-timeframe indicators, some fake signals can be filtered out, making trading signals more reliable.
Advantage Analysis
- Use multi-timeframe analysis to filter out false signals
- Easy to optimize parameters to adapt to market conditions over different periods
- Can be applied to multiple products including stocks, indices, forex, etc.
Risk Analysis
- Indicator lag may miss short-term opportunities
- Risk of loss when price levels fails to hold
- Fine tune PARAMETERS afterward to optimize stop loss and take profit
Optimization Directions
The strategy can be optimized in the following aspects:
- Optimize the moving average periods to adapt more market cycles
- Add other technical indicators for filtering, like RSI for overbought and oversold
- Add stop loss mechanism, can use ATR indicator for stop distance
- Expandable to other products like futures, optimize parameters
Summary
The Multi-timeframe MACD Indicator Crossover Trading Strategy has a clear logic flow. It determines price trends over multiple periods using moving averages and generates trading signals when significant reversals occur. The strategy has large optimization space and parameters can be adjusted for different products and market cycles, enabling good trading performance. It is suitable for automated trading of trending stocks, indices and forex.
/*backtest
start: 2024-01-19 00:00:00
end: 2024-02-18 00:00:00
period: 1h
basePeriod: 15m
exchanges: [{"eid":"Futures_Binance","currency":"BTC_USDT"}]
*/

//@version=2
strategy("TC - MACDoscillator v2", overlay=true)
// ___________      .__                   _________               .__  __         .__
// \__    ___/____  |  |    ____   ____   \_   ___ \_____  ______ |__|/  |______  |  |
//   |    |  \__  \ |  |   / ___\ /  _ \  /    \  \/\__  \ \____ \|  \   __\__  \ |  |
//   |    |   / __ \|  |__/ /_/  >  <_> ) \     \____/ __ \|  |_> >  ||  |  / __ \|  |__
//   |____|  (____  /____/\___  / \____/   \______  (____  /   __/|__||__| (____  /____/
//                \/     /_____/                  \/     \/|__|                 \/
//
// MACDoscillator Strategy v2
// Josh Breitfeld 2016
//

/// INPUTS START ///

//tradeSize = input(title="Shares Per Trade",  defval=2500, step=1)
WMALength = input(title="WMA Length",  defval=25, step=1)
EMA1Length = input(title="EMA1 Length",  defval=50, step=1)
EMA2Length = input(title="EMA2 Length",  defval=100, step=1)
//security = input(title="Alternate Security", type=string, defval="SPX500")
//inverse = input(title="Inverse Signals", type=bool, defval=true)

/// INPUTS END ///

/// ALGORITHM START ///

/// Define calculations
WMA = wma(close,WMALength)
EMA1 = ema(close,EMA1Length)
EMA2 = ema(close,EMA2Length)

/// Grab values from alternate security
dWMA = WMA
dEMA1 = EMA1
dEMA2 = EMA2

aClose = close

/// Crossover signal system

/// Long crosses
lc1 = aClose > dWMA ? true : false
lc2 = aClose > dEMA1 ? true : false
lc3 = aClose > dEMA2 ? true: false

/// Short crosses
sc1 = aClose < dWMA ? true : false
sc2 = aClose < dEMA1 ? true : false
sc3 = aClose < dEMA2 ? true : false

//plot(lc1,color=green)
//plot(lc2,color=green)
//plot(lc3,color=green)
//plot(sc1,color=red)
//plot(sc2,color=red)
//plot(sc3,color=red)


/// ALGO ORDER CONDITIONS START ///

pBuyToOpen = (lc1 and lc2 and lc3 ? true : false)
pSellToOpen = (sc1 and sc2 and sc3 ?  true : false)
pSellToClose = (lc1 ? true : false) and not pBuyToOpen
pBuyToClose = (sc1 ? true : false) and not pSellToOpen

//plot(pBuyToOpen,color=lime)
//plot(pBuyToClose,color=lime)
//plot(pSellToOpen,color=red)
//plot(pSellToClose,color=red)
/// INVERT SIGNALS

//buyToOpen = inverse ? -pBuyToOpen : pBuyToOpen
//sellToOpen = inverse ? -pBuyToOpen : pSellToOpen
//sellToClose = inverse ? -pSellToClose : pSellToClose
//buyToClose = inverse ? -pBuyToClose : pBuyToClose

/// ALGO ORDER CONDITIONS END ///

/// ALGORITHM END ///

/// DEFINE PLOTS ///

plot(dWMA,"WMA",lime,1,line)
plot(dEMA1,"EMA1",blue,2,line)
plot(dEMA2,"EMA2",red,3,line)
//plot(aClose,"Close",orange,4,line)

/// PLOTS END ///

/// ORDER BLOCK ///

    //strategy.entry("My Long Entry Id", strategy.long)

/// OPENING ORDERS START ///
if(pBuyToOpen)
    strategy.entry("BTO", strategy.long, comment="BTO")
if(pSellToOpen)
    strategy.entry("STO", strategy.short, comment="STO")

/// OPENING ORDERS END ///

/// CLOSING ORDERS START ///
strategy.close("BTO", pBuyToClose)
strategy.close("STO", pSellToClose)
/// CLOSING ORDERS END ///

/// END ORDER BLOCK ///

// Josh Breitfeld - Talgo Capital 2016
/// STRATEGY END ///
- Supertrend and Moving Average Crossover Strategy
- Dual Trend Breakout Strategy
- SSL Channel and Wave Trend Quantitative Trading Strategy
- Super ATR Trend Following Strategy
- Trading-oriented Ichimoku Cloud Nine Strategy
- LPB Microcycles Adaptive Oscillation Contour Tracking Strategy
- Best ABCD Pattern Trading Strategy with Stop Loss and Take Profit Tracking
- Major Trend Indicator Long
- Multi Timeframe Strategy
- Dynamic Balancing Leveraged ETF Investment Strategy
- Gem Forest 1 Minute Breakout Strategy
- Three High Candle Reversal Strategy
- MACD Moving Average Combination Cross-Period Dynamic Trend Strategy
- Gem Forest One Minute Scalping Strategy
- Signal Smoothing Ehlers Cyber Cycle Strategy
- EMA Crossover Trend Following Trading Strategy
- Trend Following Strategy Based on Candlestick Direction
- Dual Confirmation MACD and RSI Strategy
- Williams Double Exponential Moving Average and Ichimoku Kinkou Hyo Strategy
- 3 10 Oscillator Profile Flagging Strategy