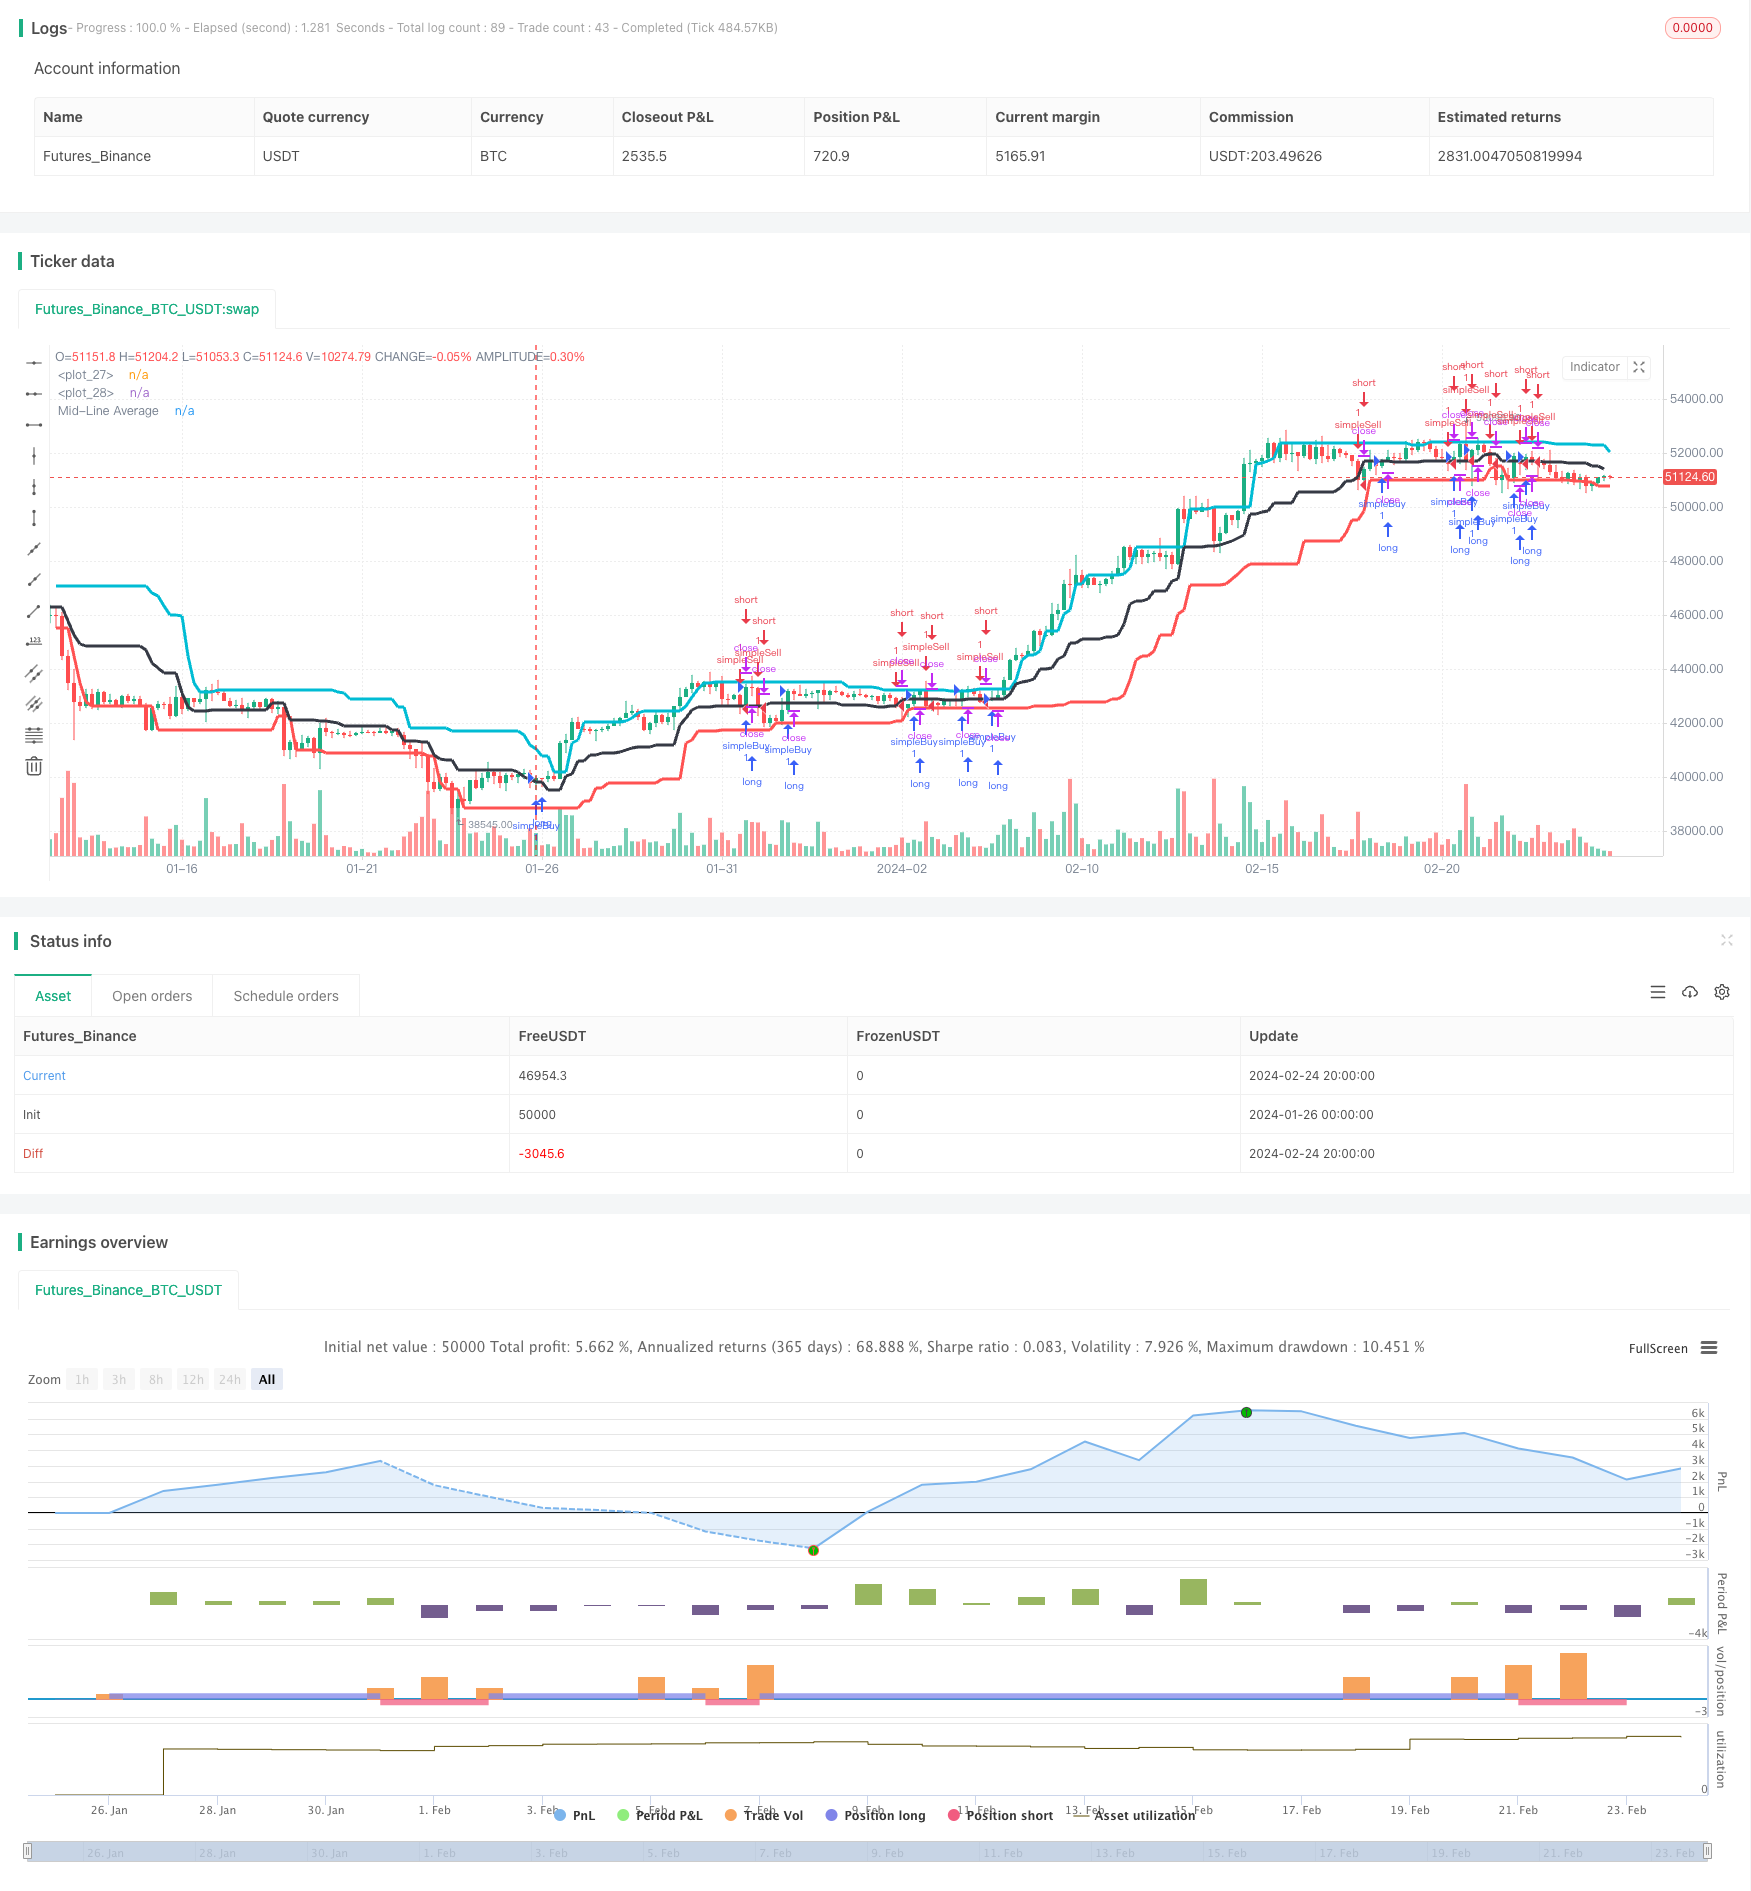
Donchian Channel Breakout Strategy
Author: ChaoZhang, Date: 2024-02-26 14:55:04Tags:

Overview
The Donchian channel breakout strategy is a trend-following strategy based on price channels. It uses the upper band, lower band, and middle line moving average of the Donchian channel to determine price trends and breakouts for generating buy and sell signals.
Strategy Logic
The strategy first calculates the highest high, lowest low, and middle line moving average of prices over a certain period. The upper and lower bands form the price channel, while the middle line sits in the middle of the channel. When the price breaks above the middle line, it signals an upward trend and goes long. When the price breaks below the middle line, it signals a downward trend and goes short.
Specifically, the strategy operates in the following steps:
- Calculate the 20-period highest high, namely dcUpper;
- Calculate the 20-period lowest low, namely dcLower;
- Calculate the average of dcUpper and dcLower to get dcAverage, as the middle line of the channel;
- Plot dcUpper, dcLower, and dcAverage to form the Donchian Channel;
- Go long when close is above the middle line dcAverage, and go short when close is below dcAverage;
- Exit rules: if close is below the lower band dcLower when long, close long position; if close is above the middle line dcAverage when short, close short position.
The above logic describes the basic trading principle of the strategy - capturing trends by price breakouts and switching direction at pivot points.
Advantage Analysis
The strategy has the following advantages:
- Solid theoretical basis - using price channels to determine trends is a proven technical analysis approach;
- Simple and clear logic, easy to understand and implement;
- Breakout-based system with lots of trend-following opportunities, fitting quant trading strategies;
- Clear stop loss mechanism to limit single trade loss;
- Flexibility - parameters can be adjusted for different market environments.
Risk Analysis
There are also some risks:
- High trading frequency leads to higher costs and slippage;
- Improper stop loss placement causes over-stop loss;
- Inappropriate parameters lead to missing or false signals;
- Late trend breakout failures result in losses.
Solutions:
- Optimize parameters and control trade frequency;
- Enhance stop loss logic to prevent over-stop loss;
- Test under different environments and adjust parameters;
- Add filters to avoid late trend breakout failures.
Optimization Directions
The strategy can be further optimized in the following aspects:
- Add market structure metrics to avoid trading against major trends;
- Increase signal filtering to ensure breakout validity and reduce false signals;
- Incorporate volatility metrics to gauge breakout intensity;
- Apply multi-timeframe or multi-asset analysis to improve robustness;
- Utilize machine learning to auto-tune parameters adapting to changing markets.
Conclusion
In conclusion, the Donchian channel breakout strategy is an effective trend-following system, with sound theoretical basis, simple logic, and ability to ride trends through breakouts. Meanwhile, inherent risks of such breakout systems call for parameter tuning and signal filtering. With further research and optimization, Donchian strategies can become more robust and practical for quantitative traders.
/*backtest
start: 2024-01-26 00:00:00
end: 2024-02-25 00:00:00
period: 4h
basePeriod: 15m
exchanges: [{"eid":"Futures_Binance","currency":"BTC_USDT"}]
*/

//@version=3

strategy(title = "dc", overlay = true)


testStartYear = input(2018, "Backtest Start Year")
testStartMonth = input(1, "Backtest Start Month")
testStartDay = input(1, "Backtest Start Day")
testPeriodStart = timestamp(testStartYear,testStartMonth,testStartDay,0,0)

testEndYear = input(2018, "Backtest Start Year")
testEndMonth = input(12)
testEndDay = input(31, "Backtest Start Day")
testPeriodEnd = timestamp(testStartYear,testStartMonth,testStartDay,0,0)


testPeriod() =>
    true
    //time >= testPeriodStart  ? true : false

dcPeriod = input(20, "Period")

dcUpper = highest(close, dcPeriod)[1]
dcLower = lowest(close, dcPeriod)[1]
dcAverage = (dcUpper + dcLower) / 2

plot(dcLower, style=line, linewidth=3, color=red, offset=1)
plot(dcUpper, style=line, linewidth=3, color=aqua, offset=1)

plot(dcAverage, color=black, style=line, linewidth=3, title="Mid-Line Average")

strategy.entry("simpleBuy", strategy.long, when=close > dcAverage)
strategy.close("simpleBuy",when=close < dcLower)

strategy.entry("simpleSell", strategy.short,when=close < dcAverage)
strategy.close("simpleSell",when=close > dcAverage)
- Trend Reversal with Intrabar Volatility Trading Strategy
- Multiple Timeframe EMA Trend Following Trading Strategy
- Momentum Crossover Bollinger Band Trend Tracking Strategy
- Vortex Trend Reversal Strategy
- Momentum Tracking Dual-EMA Crossover Strategy
- Dynamic Self-Adaptive Kaufman Moving Average Trend Tracking Strategy
- Three Factors Model for Price Oscillation Detection
- Momentum Breakthrough EMA 34 Crossover Strategy
- Average True Range Breakout Strategy with Golden Ratio
- Adaptive Exponential Moving Average Range Strategy
- Turtle Trading Strategy Based on Donchian Channels
- The Dual Quant Trading System
- StochRSI Reversal Trading Strategy
- Four DEMA Multi Timeframe Trend Strategy
- Follow The Bear Strategy
- Intelligent Accumulator Buy Strategy
- The Dual EMA Price Swing Strategy
- RSI Indicator Long Short Separation Trading Strategy
- Trend Following Quant Trading Strategy Based on Moving Average
- Inside Bar Breakout Strategy