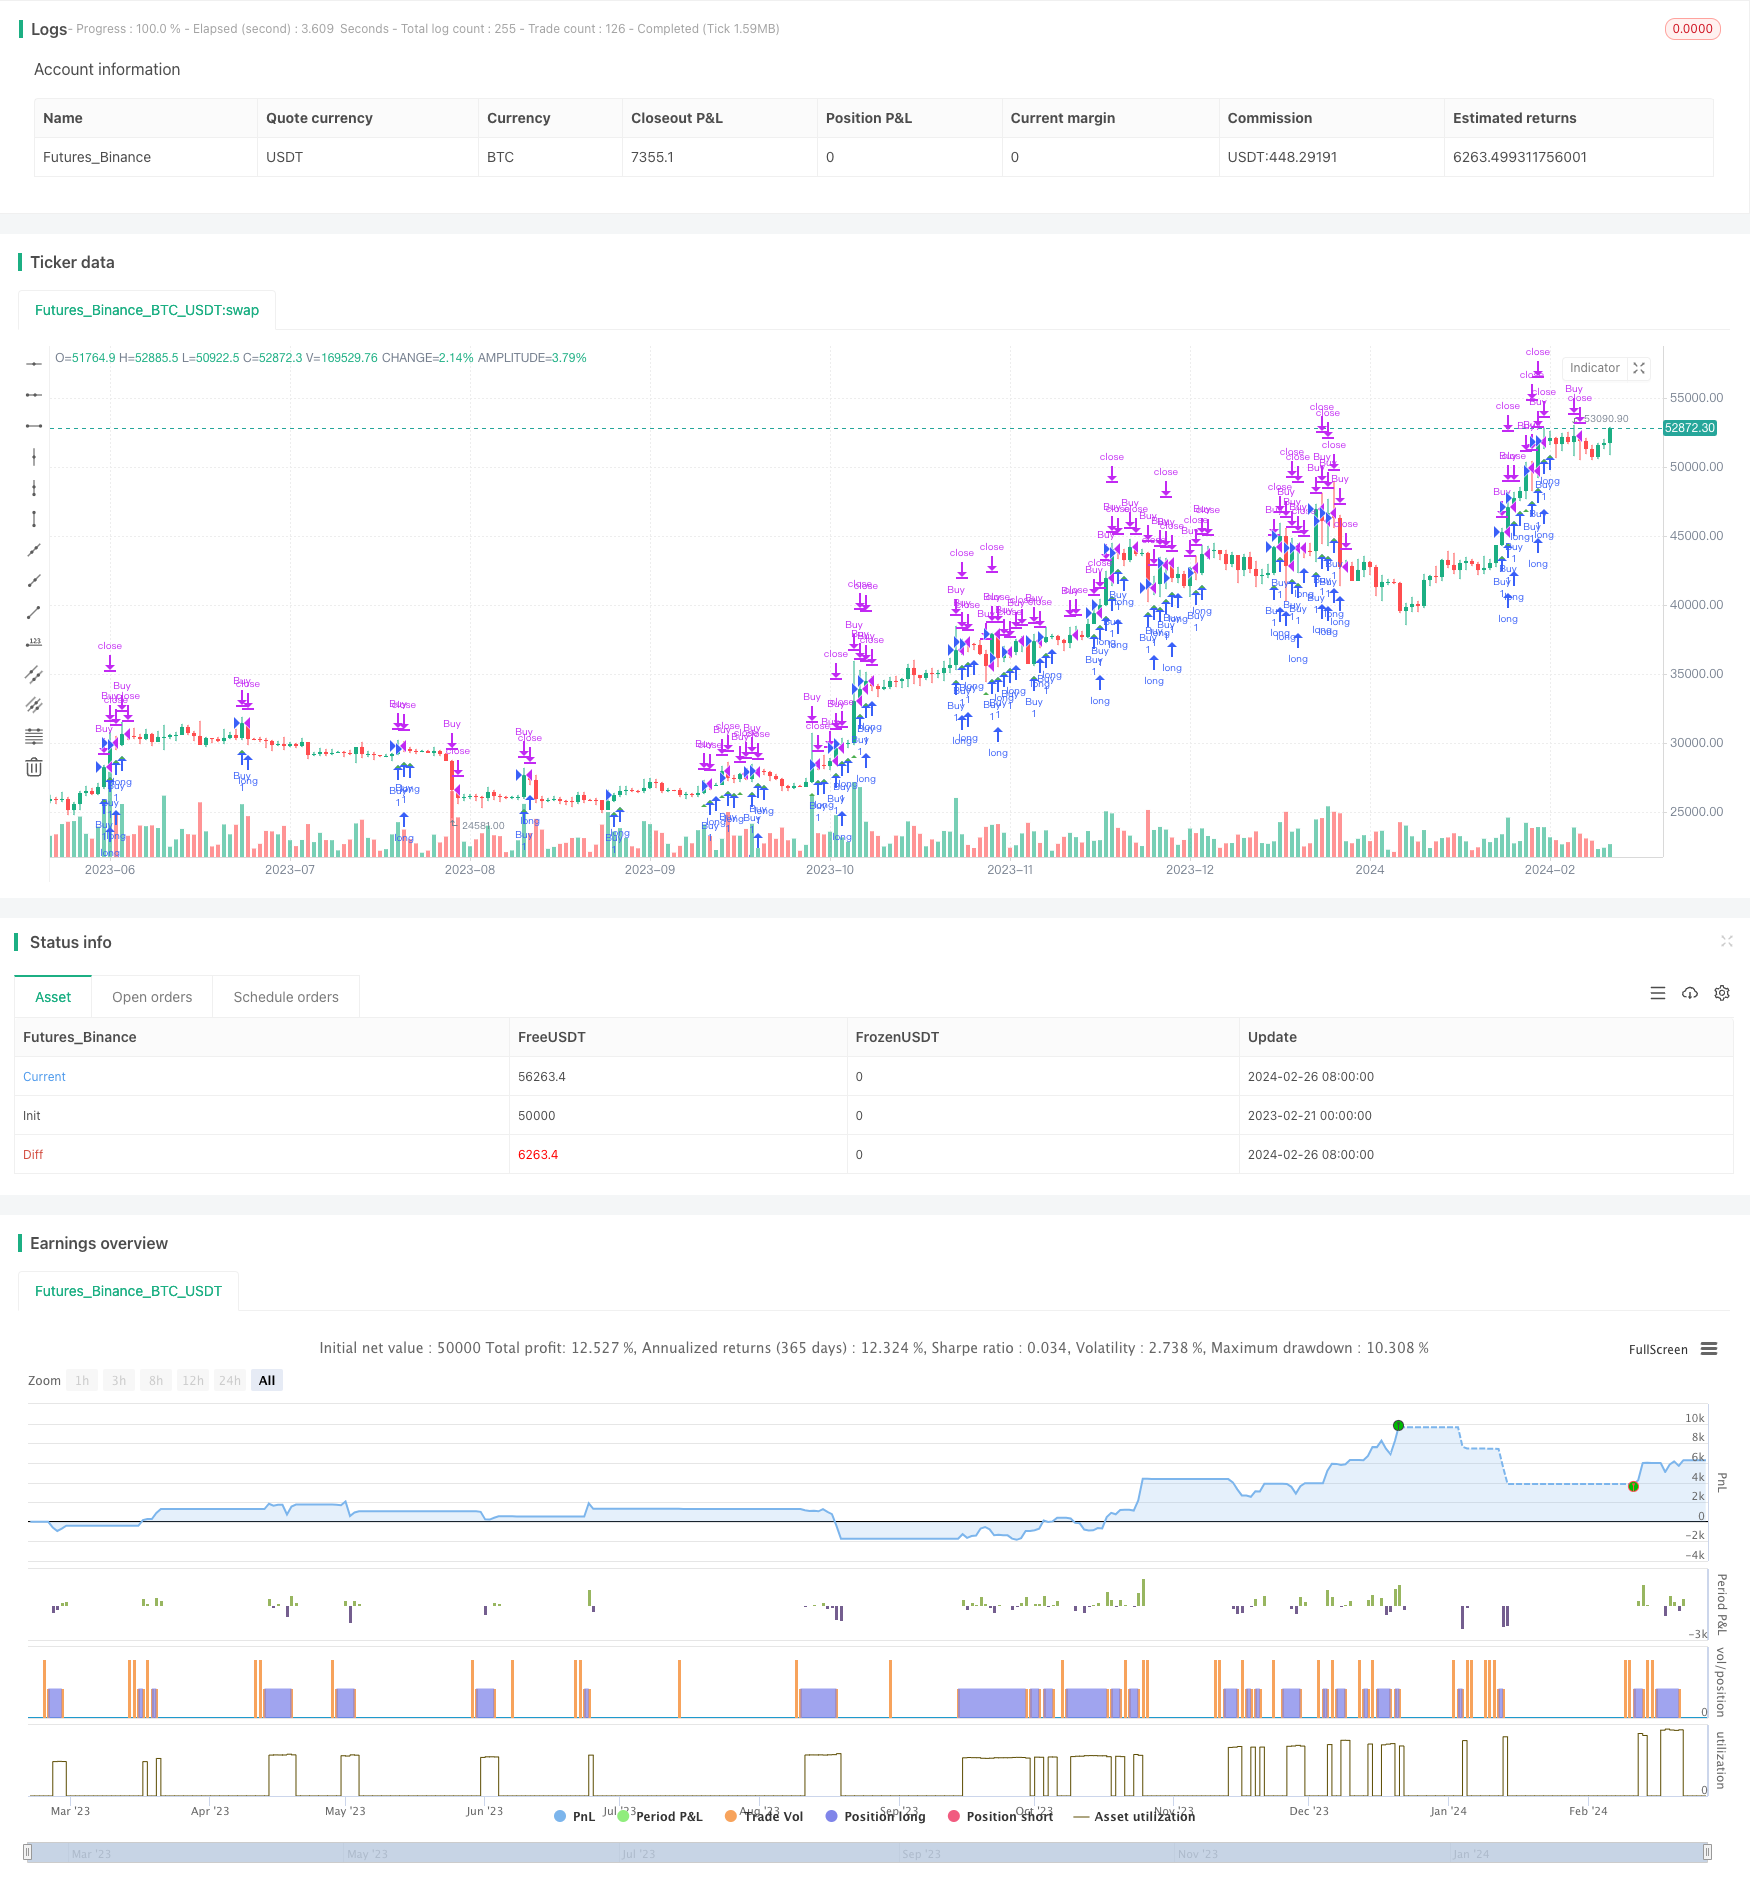
Gap Opening Strategy
Author: ChaoZhang, Date: 2024-02-28 17:12:52Tags:

This strategy judges market trend direction by calculating moving average and price difference to determine long entry, avoiding frequent opening during shocks.
Strategy Overview
- Use 20-period simple moving average to determine overall market trend
- Use 3-period high-low price difference to judge recent price fluctuation
- Go long when price is above MA and difference is greater than 20-period average
- Exit when price drops below 98% of entry price
Strategy Principle
This strategy combines MA and price fluctuation to capture upside opportunities during trends.
When price breaks above MA, it indicates an upward trend. If recent 3-period HL difference is larger than 20-period average, it suggests increased fluctuation and potential for a big rise for entry.
After opening, set a fixed percentage stop loss price. Exit when price drops below to control downside risk.
Advantages
- Avoid frequent opening during shocks by judging both trend and volatility
- More solid breakout signal using price difference
- Stop loss helps control risk
Risks
- Improper parameter tuning leads to missing trades
- Too wide stop loss brings large loss
- Breakout could be false, needs more factors
Risk Solutions:
- Optimize parameters for best combination
- Use multiple stops or adaptive stops per market volatility
- Add indicators like volume to confirm signal reliability
Improvement Direction
- Add volatility indicators like BB for better entry
- Analyze volume to confirm entry signals
- Judge overall market using stock index to avoid bad trades
- Use moving/trailing stop to lock in more profit
Conclusion
This strategy effectively filters out shocks and volatility before entering in trending markets with simple but useful indicators, avoiding unnecessary trades. Also, risk is well controlled to limit losses. Further optimizations can lead to even better results.
/*backtest
start: 2023-02-21 00:00:00
end: 2024-02-27 00:00:00
period: 1d
basePeriod: 1h
exchanges: [{"eid":"Futures_Binance","currency":"BTC_USDT"}]
*/

//@version=5
strategy("Estrategia de Diferencia HL y MA para Criptomonedas", shorttitle="HL MA Crypto Strategy-Ortiz", overlay=true)

// Definir longitud de MA y HL
ma_length = input(20, title="Longitud MA")
hl_length = input(3, title="Longitud HL")
exit_below_price = input(0.98, title="Salir por debajo de precio")

// Calcular MA
ma = ta.sma(close, ma_length)

// Calcular HL
hh = ta.highest(high, hl_length)
ll = ta.lowest(low, hl_length)
hl = hh - ll

// Condiciones de tendencia alcista
bullish_trend = close > ma

// Condiciones de entrada y salida
long_condition = close > ma and close > ma[1] and hl > ta.sma(hl, ma_length)
short_condition = false // No operar en tendencia bajista
exit_condition = low < close * exit_below_price

// Entrada y salida de la estrategia
if (long_condition)
    strategy.entry("Buy", strategy.long)
if (short_condition)
    strategy.entry("Sell", strategy.short)
if (exit_condition)
    strategy.close("Buy")

// Plot de señales en el gráfico
plotshape(long_condition, style=shape.triangleup, location=location.belowbar, color=color.green, size=size.small, title="Buy Signal")
plotshape(short_condition, style=shape.triangledown, location=location.abovebar, color=color.red, size=size.small, title="Sell Signal")
- Bitlinc MARSI Trading Strategy
- The Bollinger Bands Tracking Strategy
- SuperTrend Breakout Strategy
- The Double EMA Strategy Analysis
- The Breakthrough Callback Trading Strategy
- The Moving Average Crossover Trend Strategy
- Price Channel Robot White Box Strategy
- Simple Moving Average Trend Price Quantitative Strategy
- Time-based ATR Stop Loss Buy Strategy
- Binomial Momentum Breakout Reversal Strategy
- ATR Trailing Stop Strategy with Fibonacci Retracement Targets
- Bollinger Bands Breakout Trend Trading Strategy
- Based on the Moving Average Reversion Strategy
- Short-term Breakthrough Strategy Based on Golden Crossover
- Multi-Timeframe Trend Trading Strategy Based on Compressed Indicators
- Momentum Line Crossover EMA Nine Stock MACD Strategy
- Quantitative Oscillation Indicator Combination Strategy
- Ichimoku Cloud Trend Following Strategy
- Intraday Dual Moving Average Trading Strategy
- Mayan Treasure Hunting Guide