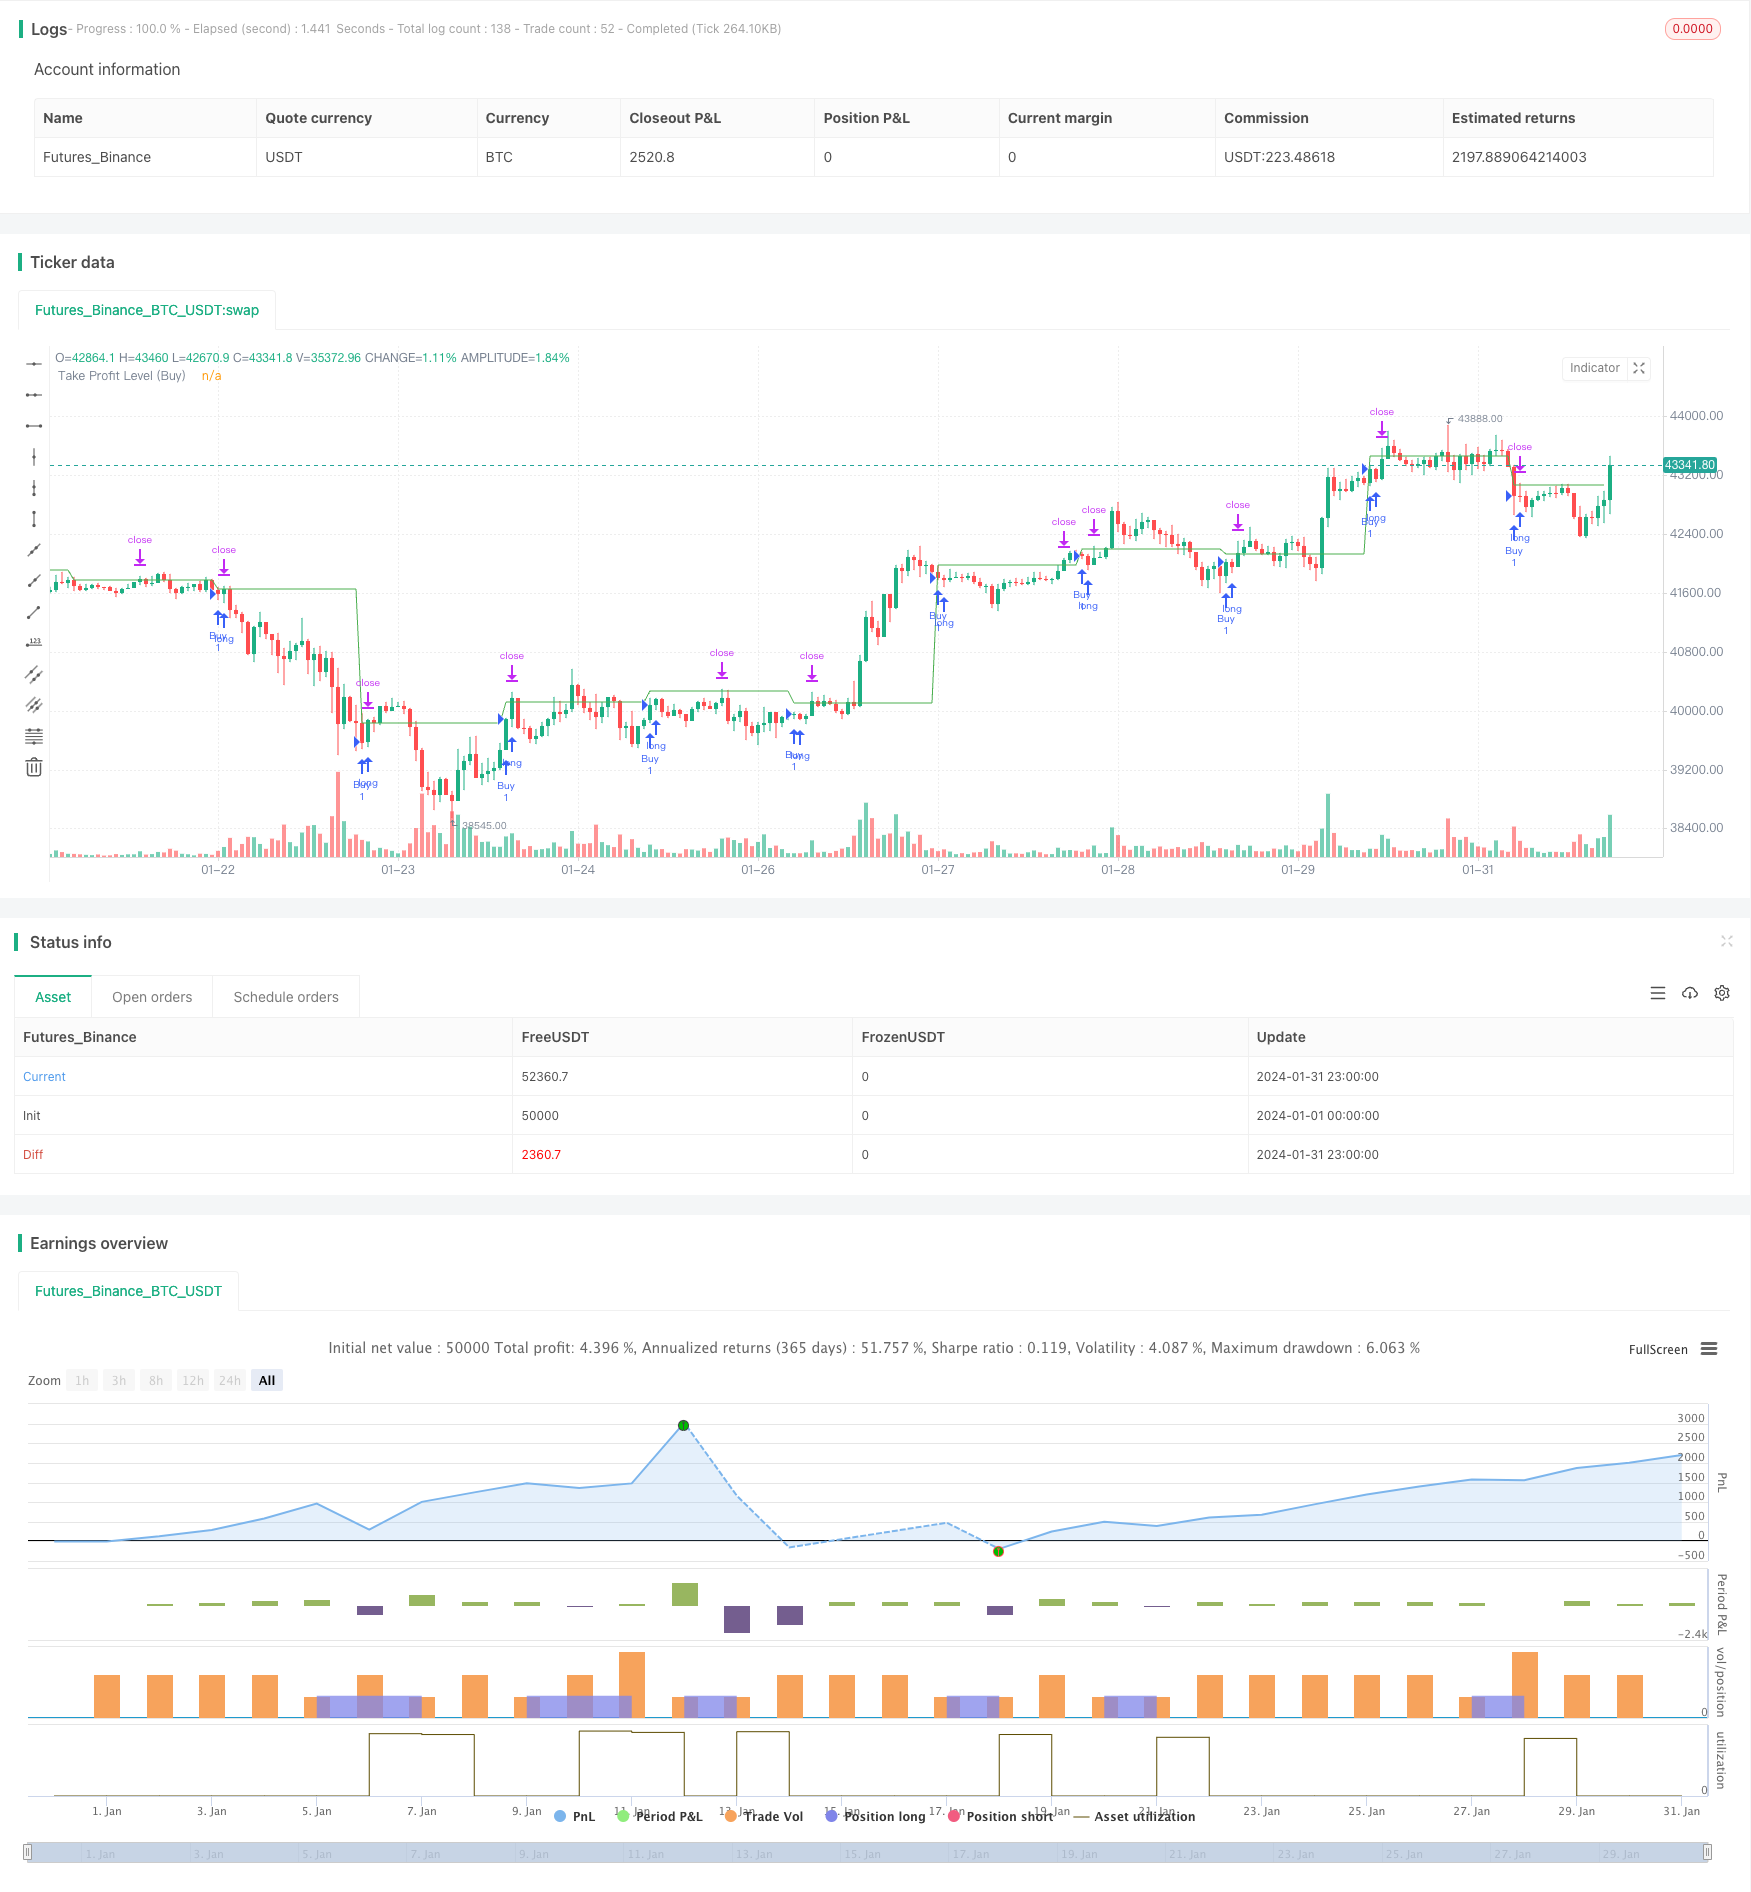
Time-based ATR Stop Loss Buy Strategy
Author: ChaoZhang, Date: 2024-02-28 17:36:50Tags:

Overview
The core idea of this strategy is to combine time and ATR indicators to set the buy-in timing and stop loss points. The strategy issues a timed buy signal at the specified time point, uses the closing price at that time as the purchase price, and then sets the stop loss point at the purchase price plus the ATR value. This can filter out some unsuitable buy-in timings while using ATR to control risks.
Strategy Principle
The strategy consists of the following main parts:
Input parameters: including buy-in time timeTrade and ATR parameter atrLength. timeTrade determines the buy-in time, and atrLength determines the period parameter of ATR.
Calculate ATR indicator: calculate the ATR value atrValue based on the atrLength parameter.
Define buy conditions: generate buy signals when the combination of hours and minutes equals timeTrade.
Issue buy order: go long when the buy condition is met, and record the purchase price buyprice.
Set stop loss point: the stop loss point is set at purchase price plus ATR value. Stop loss exit when price breaks this point.
Plotting: plot the stop loss level line.
Advantage Analysis
The biggest advantage of this strategy is the double confirmation of buy-in timing and stop loss point by time and ATR indicator. This avoids blindly following the market to buy in, and effectively controls risks. Secondly, the stop loss point set by ATR is dynamically changing, which can set a reasonable stop loss range according to market fluctuation. Finally, the strategy logic is simple and easy to understand and track.
Risk Analysis
The main risks of this strategy include:
Improper setting of buy-in time may miss better buy-in opportunities or buy in undesirable markets.
Improper parameter settings of ATR will affect strategy performance if stop loss point is too large or too small.
Unable to track long-term trends effectively, more suitable for short-term operations.
Fundamental analysis factors are not considered.
Optimization Directions
This strategy can be further optimized in the following aspects:
Determine a more scientific buy-in time by combining multi-factor models.
Optimize ATR parameter settings by combining volatility models.
Increase trend tracking mechanism to adapt to longer holding periods.
Incorporate fundamental analysis to judge the reasonableness of buy-in timing.
Conclusion
Overall, this is a relatively simple and intuitive high frequency intraday trading strategy. The core idea is to use the double confirmation of time and ATR indicators to determine the buy-in timing and stop loss points. The advantages are controllable risks and relatively easy to implement. But there are also problems like insufficient selection of buy-in timing and inadequate parameter optimization. Future optimizations can be made from introducing more factors, dynamic parameter optimization, trend tracking etc.
/*backtest
start: 2024-01-01 00:00:00
end: 2024-01-31 23:59:59
period: 1h
basePeriod: 15m
exchanges: [{"eid":"Futures_Binance","currency":"BTC_USDT"}]
*/

//@version=5
strategy("Time-based Strategy with ATR Take Profit", overlay=true)

// Initialize take profit levels
var float takeProfitLevel = na
var float takeProfitLevelForSell = na
var float buyprice = na
var float sellprice = na


// Input for the time when the trade should be executed
tradeTime = input(0700, "Trade Execution Time (HHMM)", "Specify the time in HHMM format", group="Time Settings")

// Calculate ATR for the last 5 minutes
atrLength = input(14, "ATR Length", "Specify ATR length", group="ATR Settings")
atrValue = request.security(syminfo.tickerid, "5", ta.atr(atrLength))

// Define conditions for buy and sell
buyCondition = hour * 100 + minute == tradeTime // and strategy.position_size == 0
sellCondition = hour * 100 + minute == tradeTime // and strategy.position_size > 0
// Execute Buy and Sell orders


if (buyCondition)
    strategy.entry("Buy", strategy.long)
    buyprice := close
    takeProfitLevel := buyprice + atrValue
strategy.exit("Take Profit BUY", from_entry="Buy", limit =takeProfitLevel)


// if (sellCondition)
//     strategy.entry("Sell", strategy.short)
//     sellprice := close
//     takeProfitLevelForSell := sellprice -atrValue
// strategy.exit("Take Profit Sell", from_entry="Sell", limit=takeProfitLevelForSell)


// Plot horizontal lines for take profit levels


plot(takeProfitLevel, color=color.green, title="Take Profit Level (Buy)")
plot(takeProfitLevelForSell, color=color.red, title="Take Profit Level (Sell)")
- Trend Riding Strategy Based on MOST and KAMA
- Dual Timeframe Trend Following Strategy
- Bitlinc MARSI Trading Strategy
- The Bollinger Bands Tracking Strategy
- SuperTrend Breakout Strategy
- The Double EMA Strategy Analysis
- The Breakthrough Callback Trading Strategy
- The Moving Average Crossover Trend Strategy
- Price Channel Robot White Box Strategy
- Simple Moving Average Trend Price Quantitative Strategy
- Binomial Momentum Breakout Reversal Strategy
- Gap Opening Strategy
- ATR Trailing Stop Strategy with Fibonacci Retracement Targets
- Bollinger Bands Breakout Trend Trading Strategy
- Based on the Moving Average Reversion Strategy
- Short-term Breakthrough Strategy Based on Golden Crossover
- Multi-Timeframe Trend Trading Strategy Based on Compressed Indicators
- Momentum Line Crossover EMA Nine Stock MACD Strategy
- Quantitative Oscillation Indicator Combination Strategy
- Ichimoku Cloud Trend Following Strategy