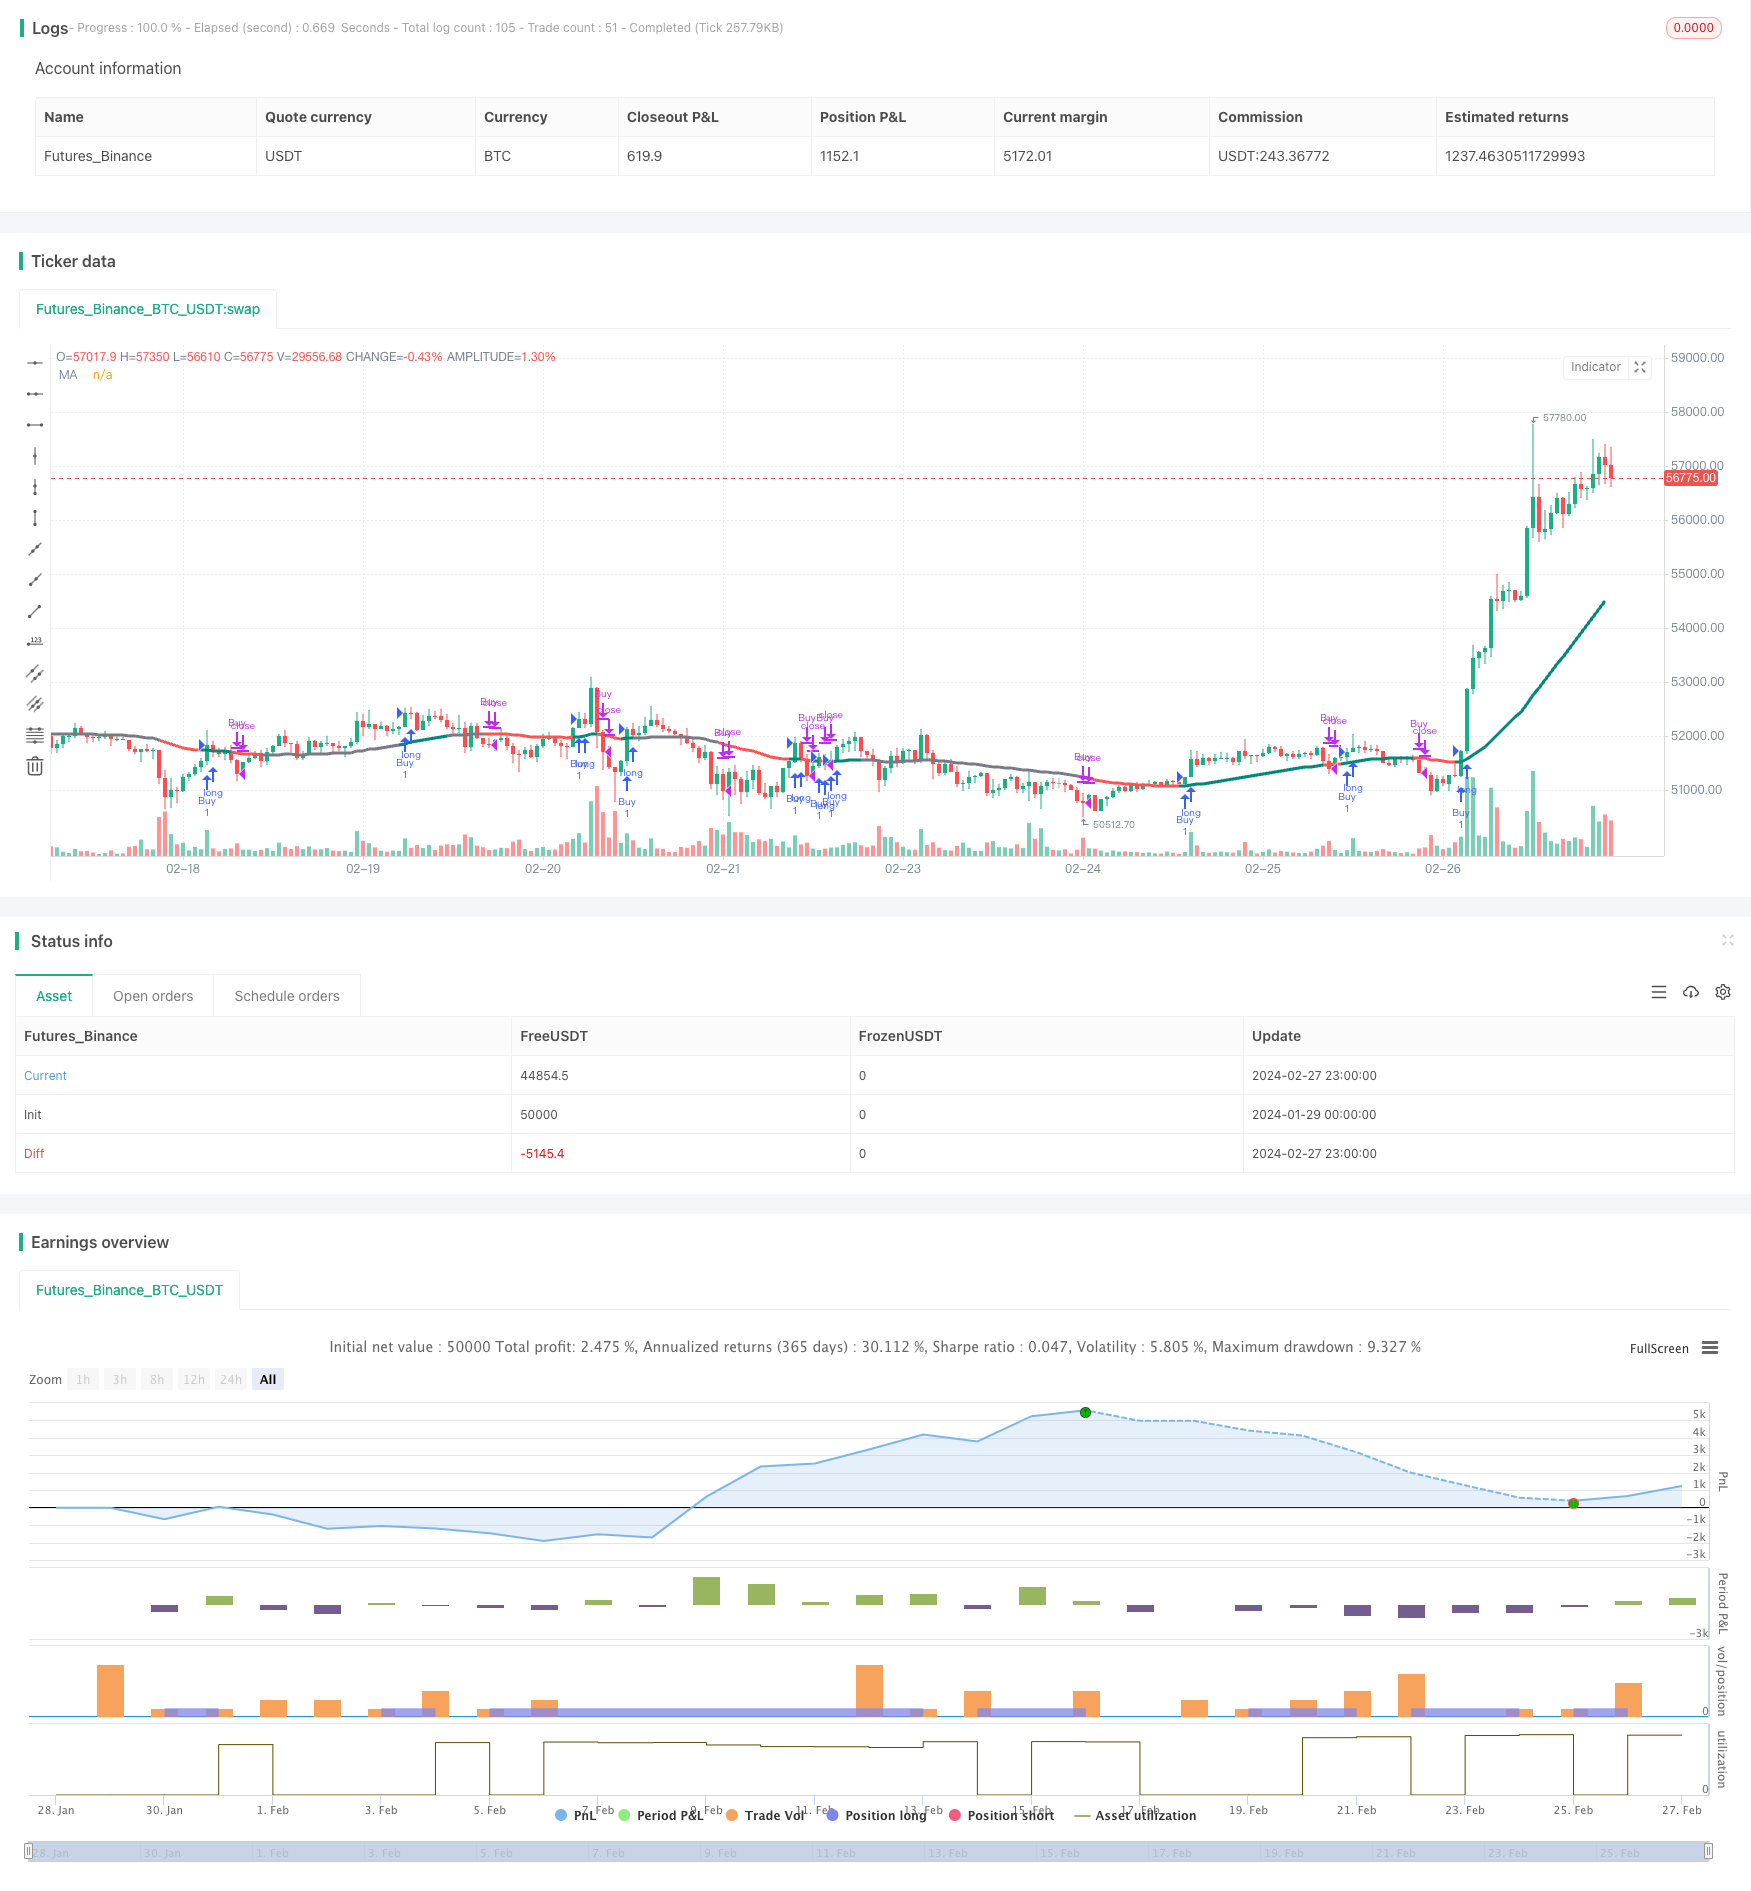
Momentum Average Directional Movement Index Moving Average Crossover Strategy
Author: ChaoZhang, Date: 2024-02-29 11:50:49Tags:

Overview
The Momentum Average Directional Movement Index Moving Average Crossover Strategy combines two powerful technical indicators, Moving Average (MA) and Average Directional Index (ADX), to provide traders with enhanced technical precision. Designed for dynamic market analysis, this strategy offers clear trading signals.
Strategy Logic
The strategy calculates a Weighted Moving Average (WMA) to track price momentum and smooth out price fluctuations to generate trend signals. At the same time, it calculates the Average Directional Index (ADX) and positive/negative directional movement indices (+/-DI) to determine the existence and strength of a trend. When ADX is above a specified parameter, a trend is considered to exist. When the positive directional movement index is higher than the negative directional movement index, it is a bullish signal.
The strategy uses the crossover of MA and ADX indicators as the basis for trading decisions. When ADX is above the threshold and DIdiff (DI+ - DI-) is greater than 0, it goes long. When ADX is above the threshold and DIdiff is less than 0, it exits positions.
Advantage Analysis
Combining the advantages of moving average and ADX index, this strategy can effectively identify the existence and direction of trends and reduce false signals. Compared to a single indicator, this combined indicator can provide more reliable trading signals.
In addition, this strategy is a fully quantitative strategy based on parameter calculations with good backtesting results and stable live performance, making it suitable for algorithmic trading.
Risk Analysis
This strategy is prone to trading risks during significant market fluctuations. When prices move violently and the indicators do not react, it can bring losses to the account. In addition, improper parameter settings can also affect strategy performance.
Losses can be controlled by stop loss. At the same time parameters can be optimized and combined with other indicators for filtering to reduce false signals.
Optimization Directions
The following aspects of this strategy can be optimized:
Combine with other indicators for filtering, such as Bollinger Bands, RSI etc. to improve signal quality
Optimize the length parameters of the moving average and ADX to find the optimal parameter combination
Add stop loss mechanisms to control single loss
Test different holding periods to find the optimal holding cycle
Conclusion
The Momentum Average Directional Movement Index Moving Average Crossover Strategy can effectively identify market trend directions by calculating price momentum and trend strength. It is a reliable trend tracking strategy. This strategy has high algorithmic degree, stable backtesting, and good live performance. Further optimization may lead to better strategy efficiency.
/*backtest
start: 2024-01-29 00:00:00
end: 2024-02-28 00:00:00
period: 1h
basePeriod: 15m
exchanges: [{"eid":"Futures_Binance","currency":"BTC_USDT"}]
*/

// © Julien_Eche

//@version=5
strategy("MA ADX Strategy", overlay=true, default_qty_type=strategy.percent_of_equity)

start_date = input(timestamp("1975-01-01T00:00:00"), title="Start Date")
end_date = input(timestamp("2099-01-01T00:00:00"), title="End Date")

// Indicator Inputs
group1 = "MA Parameters"
lengthMA = input.int(50, title="MA Length", minval=1, group=group1)
sourceMA = input(close, title="MA Source", group=group1)

group2 = "ADX Parameters"
diLength = input.int(14, title="DI Length", minval=1, group=group2)
adxSmoothing = input.int(14, title="ADX Smoothing", minval=1, maxval=50, group=group2)
adxMAActive = input.int(15, title="ADX MA Active", minval=1, group=group2)

// Directional Movement calculations
upwardMovement = ta.change(high)
downwardMovement = -ta.change(low)
trueRangeSmoothed = ta.rma(ta.atr(diLength), diLength)
positiveDM = fixnan(100 * ta.rma(upwardMovement > downwardMovement and upwardMovement > 0 ? upwardMovement : 0, diLength) / trueRangeSmoothed)
negativeDM = fixnan(100 * ta.rma(downwardMovement > upwardMovement and downwardMovement > 0 ? downwardMovement : 0, diLength) / trueRangeSmoothed)
dmSum = positiveDM + negativeDM

// Average Directional Index (ADX) calculation
averageDX = 100 * ta.rma(math.abs(positiveDM - negativeDM) / math.max(dmSum, 1), adxSmoothing)

// Line color determination
lineColor = averageDX > adxMAActive and positiveDM > negativeDM ? color.teal : averageDX > adxMAActive and positiveDM < negativeDM ? color.red : color.gray

// Moving Average (MA) calculation
maResult = ta.wma(sourceMA, lengthMA)

// Plotting the Moving Average with color
plot(maResult, color=lineColor, title="MA", linewidth=3)

// Strategy logic
if (averageDX > adxMAActive and positiveDM > negativeDM)
    strategy.entry("Buy", strategy.long)

if (averageDX > adxMAActive and positiveDM < negativeDM)
    strategy.close("Buy")
- The Compound Breakout Strategy
- The Momentum Breakout Strategy
- Trend Following Moving Average Strategy
- Momentum Crossover Strategy with Dynamic Trailing Stop Loss
- EMA and RSI Quantitative Trading Strategy
- Momentum Trend Strategy Based on MACD and Bollinger Bands
- Multi-Timeframe Stochastic Strategy
- Moving Average Crossover Strategy with Intraday Candlestick Patterns
- Bitcoin Scalping Strategy Based on Moving Average Crossover and Candlestick Patterns
- Momentum and Moving Average Combination Long Strategy
- Dual EMA Crossover Trend Tracking Strategy
- Double Moving Average and MACD Combination Trading Strategy
- Dynamic Engulfing Trend Strategy
- Multi Timeframe Moving Average Pullback Trading Strategy
- Dual Moving Average Volatility Tracking Strategy
- Short-term Trading Strategy Based on Bollinger Bands
- Trend Riding Strategy Based on MOST and KAMA
- Dual Timeframe Trend Following Strategy
- Bitlinc MARSI Trading Strategy
- The Bollinger Bands Tracking Strategy