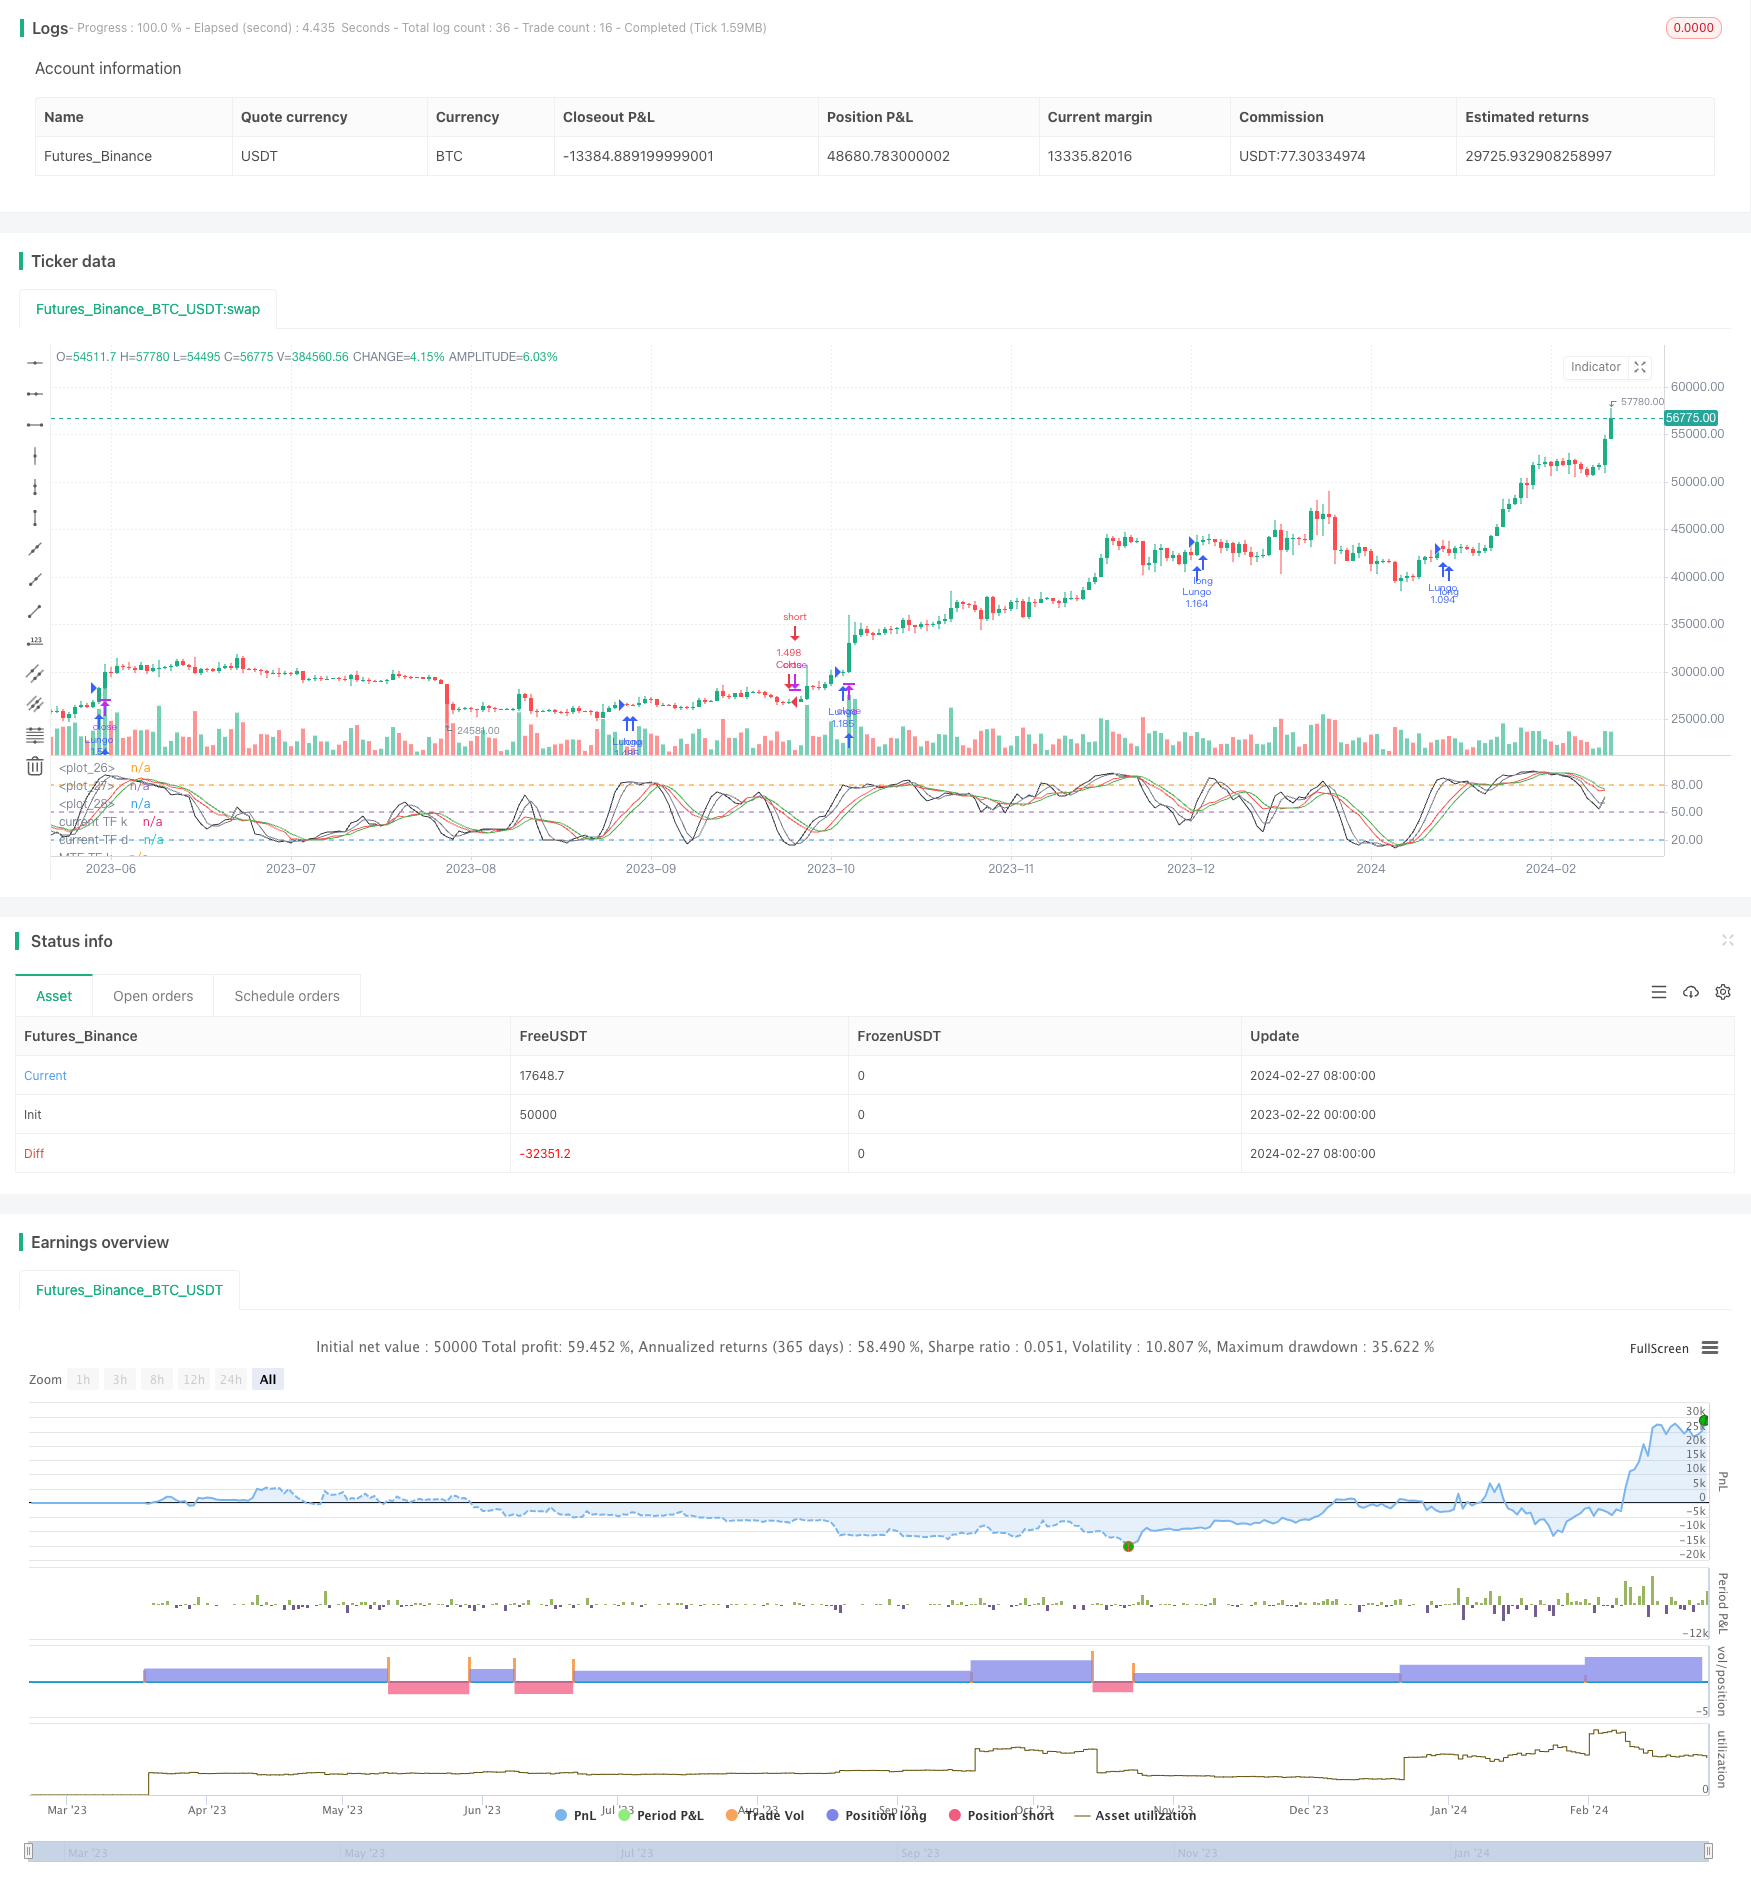
Multi-Timeframe Stochastic Strategy
Author: ChaoZhang, Date: 2024-02-29 12:11:23Tags:

Overview
The Multi-Timeframe Stochastic Strategy is a quantitative trading strategy based on the Stochastic oscillator indicator. It utilizes stochastic moving averages across both the current and higher timeframes to combine trend following and mean reversion trading.
Strategy Logic
The core indicators of this strategy are the Stochastic K and D lines. The K line reflects recent price momentum while the D line is a moving average of the K line. Their relative position and direction can determine price trends and potential reversals.
Specifically, when the short-term K line crosses above the mid-term D line from below, it signals upward momentum in prices short-term. And when the K line crosses below the D line from above, it signals downside breakdown pressure short-term.
This strategy employs stochastic indicators across two timeframes to confirm signals and filter noise. The higher timeframe stochastic defines the overall trend while the current timeframe stochastic identifies short-term inflection points to time entries.
When the higher timeframe stochastic confirms an uptrend and the current timeframe stochastic shows an upside breakout, a long position is taken. When the higher timeframe stochastic indicates a downtrend and the current stochastic signals a downside breakdown, a short position is initiated.
Advantage Analysis
By combining multi-timeframe indicators and current momentum, this strategy can effectively filter out market noise and capture high-probability profitable trades. The main advantages are:
- Higher timeframe ensures trading with the trend to minimize unnecessary whipaws and losing trades.
- Current timeframe allows low-risk entries to capture short-term reversals within the trend.
- Dual stochastic indicators improve signal accuracy and reduce false signals.
Risk Analysis
There are some risks to consider with this strategy:
- Sudden trend reversals may not be captured early by the higher timeframe indicator, increasing losses from late directional switches. Timeframe parameters need to be optimized to get sufficiently timely market data.
- The current timeframe indicator can be too sensitive, increasing trade frequency and costs. Parameters need calibration to filter insignificant noise.
- Although the dual stochastic enhances accuracy, it also slows down reaction time. Fast market moves could lead to missing optimal entry points.
Optimization Directions
The main optimization directions include:
- Optimizing the higher timeframe stochastic smoothers to adapt faster to new trends.
- Adjusting the current timeframe parameters and breakout thresholds to reduce false signals.
- Testing timeframe combinations to find the optimal balance.
- Incorporating stop-loss strategies to control downside risk per trade.
Conclusion
The Multi-Timeframe Stochastic Strategy is a typical trend following system. By utilizing stochastic indicators across two timescales, it aims to precisely capture market movements. Further optimizations can enhance stability and profitability.
/*backtest
start: 2023-02-22 00:00:00
end: 2024-02-28 00:00:00
period: 1d
basePeriod: 1h
exchanges: [{"eid":"Futures_Binance","currency":"BTC_USDT"}]
*/

//@version=3
strategy("MTF stochastic strategy", overlay=false,pyramiding=3,default_qty_type=strategy.percent_of_equity,default_qty_value=100,currency=currency.USD)
//
//this strategy is inspired to bobby thread in forexfactory forum
//
len = input(11, minval=1, title="Length for Main Stochastic")
smoothK = input(3, minval=1, title="SmoothK for Main Stochastic")
smoothD = input(3, minval=1, title="SmoothD for Main Stochastic")
upLine = input(80, minval=50, maxval=90, title="Upper Line Value?")
lowLine = input(20, minval=10, maxval=50, title="Lower Line Value?")
trailStep=input(50,minval=10,title="Trialing step value")

// current stochastic calculation
k = sma(stoch(close, high, low, len), smoothK)
d = sma(k, smoothD)

//mtf stochastic calculation smoothed with period

mtfK= sma(stoch(close, high, low, len), smoothK*3)
mtfD= sma(k, smoothD*3)

plot(k,"current TF k",black,style=linebr)
plot(d,"current TF d",gray,style=linebr)
plot(mtfK,"MTF TF k",red,style=line)
plot(mtfD,"Multi TF d",green,style=line)
hline(upLine)
hline(50)
hline(lowLine)

longCondition = crossover(mtfK, 50) and k>50 and change(k,1)>0 and k>d and mtfK>mtfD
if (longCondition)
    strategy.entry("Lungo", strategy.long)

shortCondition = crossunder(mtfD, 50) and k<50 and change(k,1)<0 and k<d and mtfK<mtfD
if (shortCondition)
    strategy.entry("Corto", strategy.short)

exitlong=crossunder(mtfD, upLine)
exitshort=crossover(mtfK, lowLine)

if (exitlong)
    strategy.exit("Esci lungo","Lungo",trail_points=trailStep)
if (exitshort)
    strategy.exit("Esci corto","Corto",trail_points=trailStep)
- Multiple Moving Average Trading Strategy
- Turtle Trading Decision System
- Wave Buying and Selling Reversal 5 Minutes Timeframe Strategy
- RSI-based Auto Trading Strategy
- The Compound Breakout Strategy
- The Momentum Breakout Strategy
- Trend Following Moving Average Strategy
- Momentum Crossover Strategy with Dynamic Trailing Stop Loss
- EMA and RSI Quantitative Trading Strategy
- Momentum Trend Strategy Based on MACD and Bollinger Bands
- Moving Average Crossover Strategy with Intraday Candlestick Patterns
- Bitcoin Scalping Strategy Based on Moving Average Crossover and Candlestick Patterns
- Momentum and Moving Average Combination Long Strategy
- Momentum Average Directional Movement Index Moving Average Crossover Strategy
- Dual EMA Crossover Trend Tracking Strategy
- Double Moving Average and MACD Combination Trading Strategy
- Dynamic Engulfing Trend Strategy
- Multi Timeframe Moving Average Pullback Trading Strategy
- Dual Moving Average Volatility Tracking Strategy
- Short-term Trading Strategy Based on Bollinger Bands