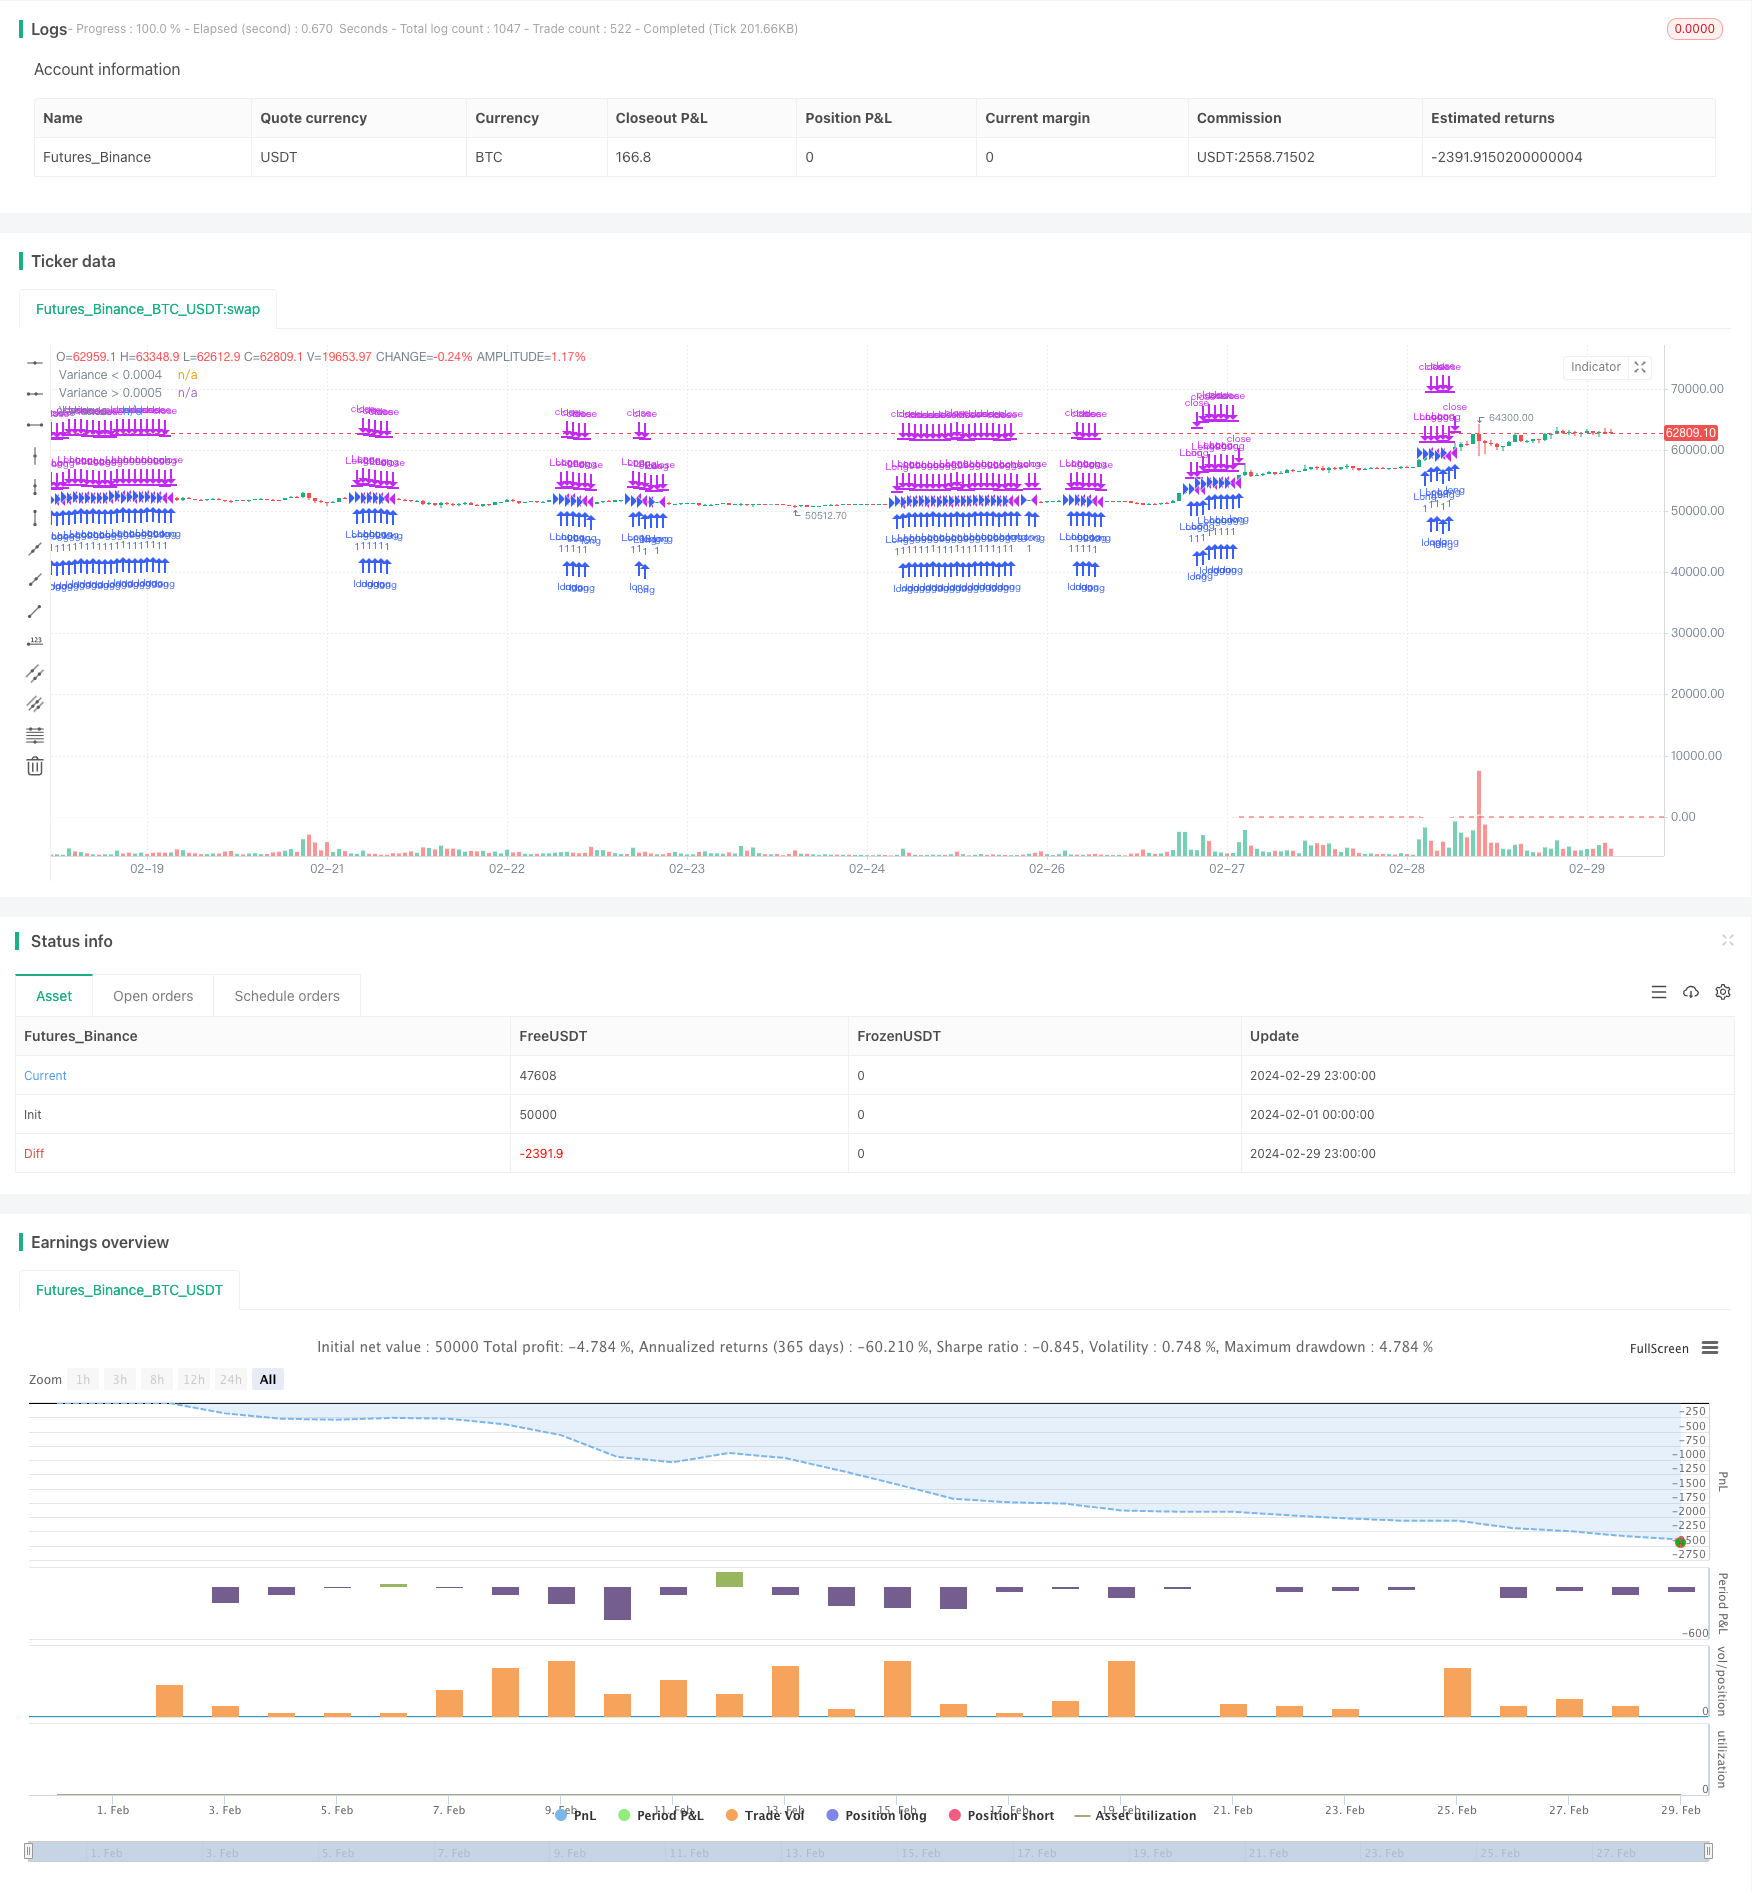
The strategy named “Variance and Moving Averages Based Volatility Strategy” uses the variance of the price volatility over the past 30 candles and three moving averages (MA5, MA15, and MA30) to make trading decisions.
The main idea of the strategy is to measure market volatility by calculating the variance of price volatility and combine it with moving averages of different periods to determine the trend direction. When volatility is low and the short-term moving average is above the long-term moving average, the strategy enters a long position. At the same time, the strategy sets stop-loss and take-profit conditions to control risk and lock in profits.
The principle of the strategy can be divided into the following steps: 1. Calculate the 5-day, 15-day, and 30-day moving averages (MA5, MA15, and MA30). 2. Calculate the variance of the price volatility (the difference between the highest and lowest prices divided by the closing price) over the past 30 candles, and multiply it by 1,000,000 for easier observation. 3. Define the buy condition: variance is less than 35, MA5 is greater than MA15, and MA15 is greater than MA30. 4. Define the stop-loss condition: the closing price is lower than MA30 or MA5 is lower than MA30. 5. Define the take-profit condition: variance is greater than 500. 6. When the buy condition is met, the strategy enters a long position; when the stop-loss or take-profit condition is met, the strategy closes the position.
The advantages of this strategy include: 1. By combining volatility and trend indicators, it can trade when the trend is clear and volatility is low, avoiding trading in highly volatile market conditions. 2. Using multiple moving averages allows for a more comprehensive assessment of the trend direction, improving the accuracy of trades. 3. Setting clear stop-loss and take-profit conditions effectively controls risk and locks in profits.
The risks of the strategy mainly include: 1. When the market trend is unclear or volatility suddenly increases, the strategy may experience frequent trades or false signals. 2. The stop-loss and take-profit conditions may not fully adapt to all market environments and may require adjustments based on actual situations. 3. The strategy relies on historical data and may not react quickly to unexpected events or abnormal market fluctuations.
To optimize this strategy, the following directions can be considered: 1. For the variance threshold and moving average combination in the buy condition, the optimal values can be found through backtesting and parameter optimization. 2. More technical indicators or market sentiment indicators, such as RSI and MACD, can be introduced into the stop-loss and take-profit conditions to improve the reliability of signals. 3. Market risk management mechanisms, such as dynamic position adjustment and volatility adjustment, can be introduced to adapt to changes in market conditions.
In summary, the “Variance and Moving Averages Based Volatility Strategy” is a trading strategy that combines volatility and trend indicators. It measures market volatility by calculating the variance of price volatility and combines it with moving averages of different periods to determine the trend direction, entering trades in appropriate market conditions. The strategy sets clear stop-loss and take-profit conditions, which can effectively control risk and lock in profits. At the same time, the strategy has room for optimization and can improve its adaptability and robustness through parameter optimization, introducing more indicators, and implementing risk management mechanisms.
/*backtest
start: 2024-02-01 00:00:00
end: 2024-02-29 23:59:59
period: 1h
basePeriod: 15m
exchanges: [{"eid":"Futures_Binance","currency":"BTC_USDT"}]
*/

//@version=5
strategy("Variance and Moving Averages Strategy", overlay=true)

// 计算MA5、MA15和MA30
ma5 = ta.sma(close, 5)
ma15 = ta.sma(close, 15)
ma30 = ta.sma(close, 30)

// 计算过去30根K线的波动幅度(最高价和最低价)的方差
variance = ta.variance((high - low) / close, 30) * 1000000

// 定义买入条件
buy_condition = variance < 35 and ma5 > ma15 and ma15 > ma30

// 定义止损条件 close < ma30 or ma5 < ma30
stop_loss_condition = true

// 定义止盈条件
take_profit_condition = variance > 500

// 执行交易逻辑
if (buy_condition)
    strategy.entry("Long", strategy.long)
if (stop_loss_condition)
    strategy.close("Long")
if (take_profit_condition)
    strategy.close("Long")

// 绘制MA5、MA15和MA30
// plot(ma5, color=color.blue, title="MA5")
// plot(ma15, color=color.orange, title="MA15")
// plot(ma30, color=color.red, title="MA30")

// 绘制方差
hline(0.0004, color=color.green, linestyle=hline.style_dashed, title="Variance < 0.0004")
hline(0.0005, color=color.red, linestyle=hline.style_dashed, title="Variance > 0.0005")
plot(variance, color=color.white, title="Variance")