RSI Stop Loss Tracking Trading Strategy
Author: ChaoZhang, Date: 2024-03-28 17:56:58Tags:

Overview
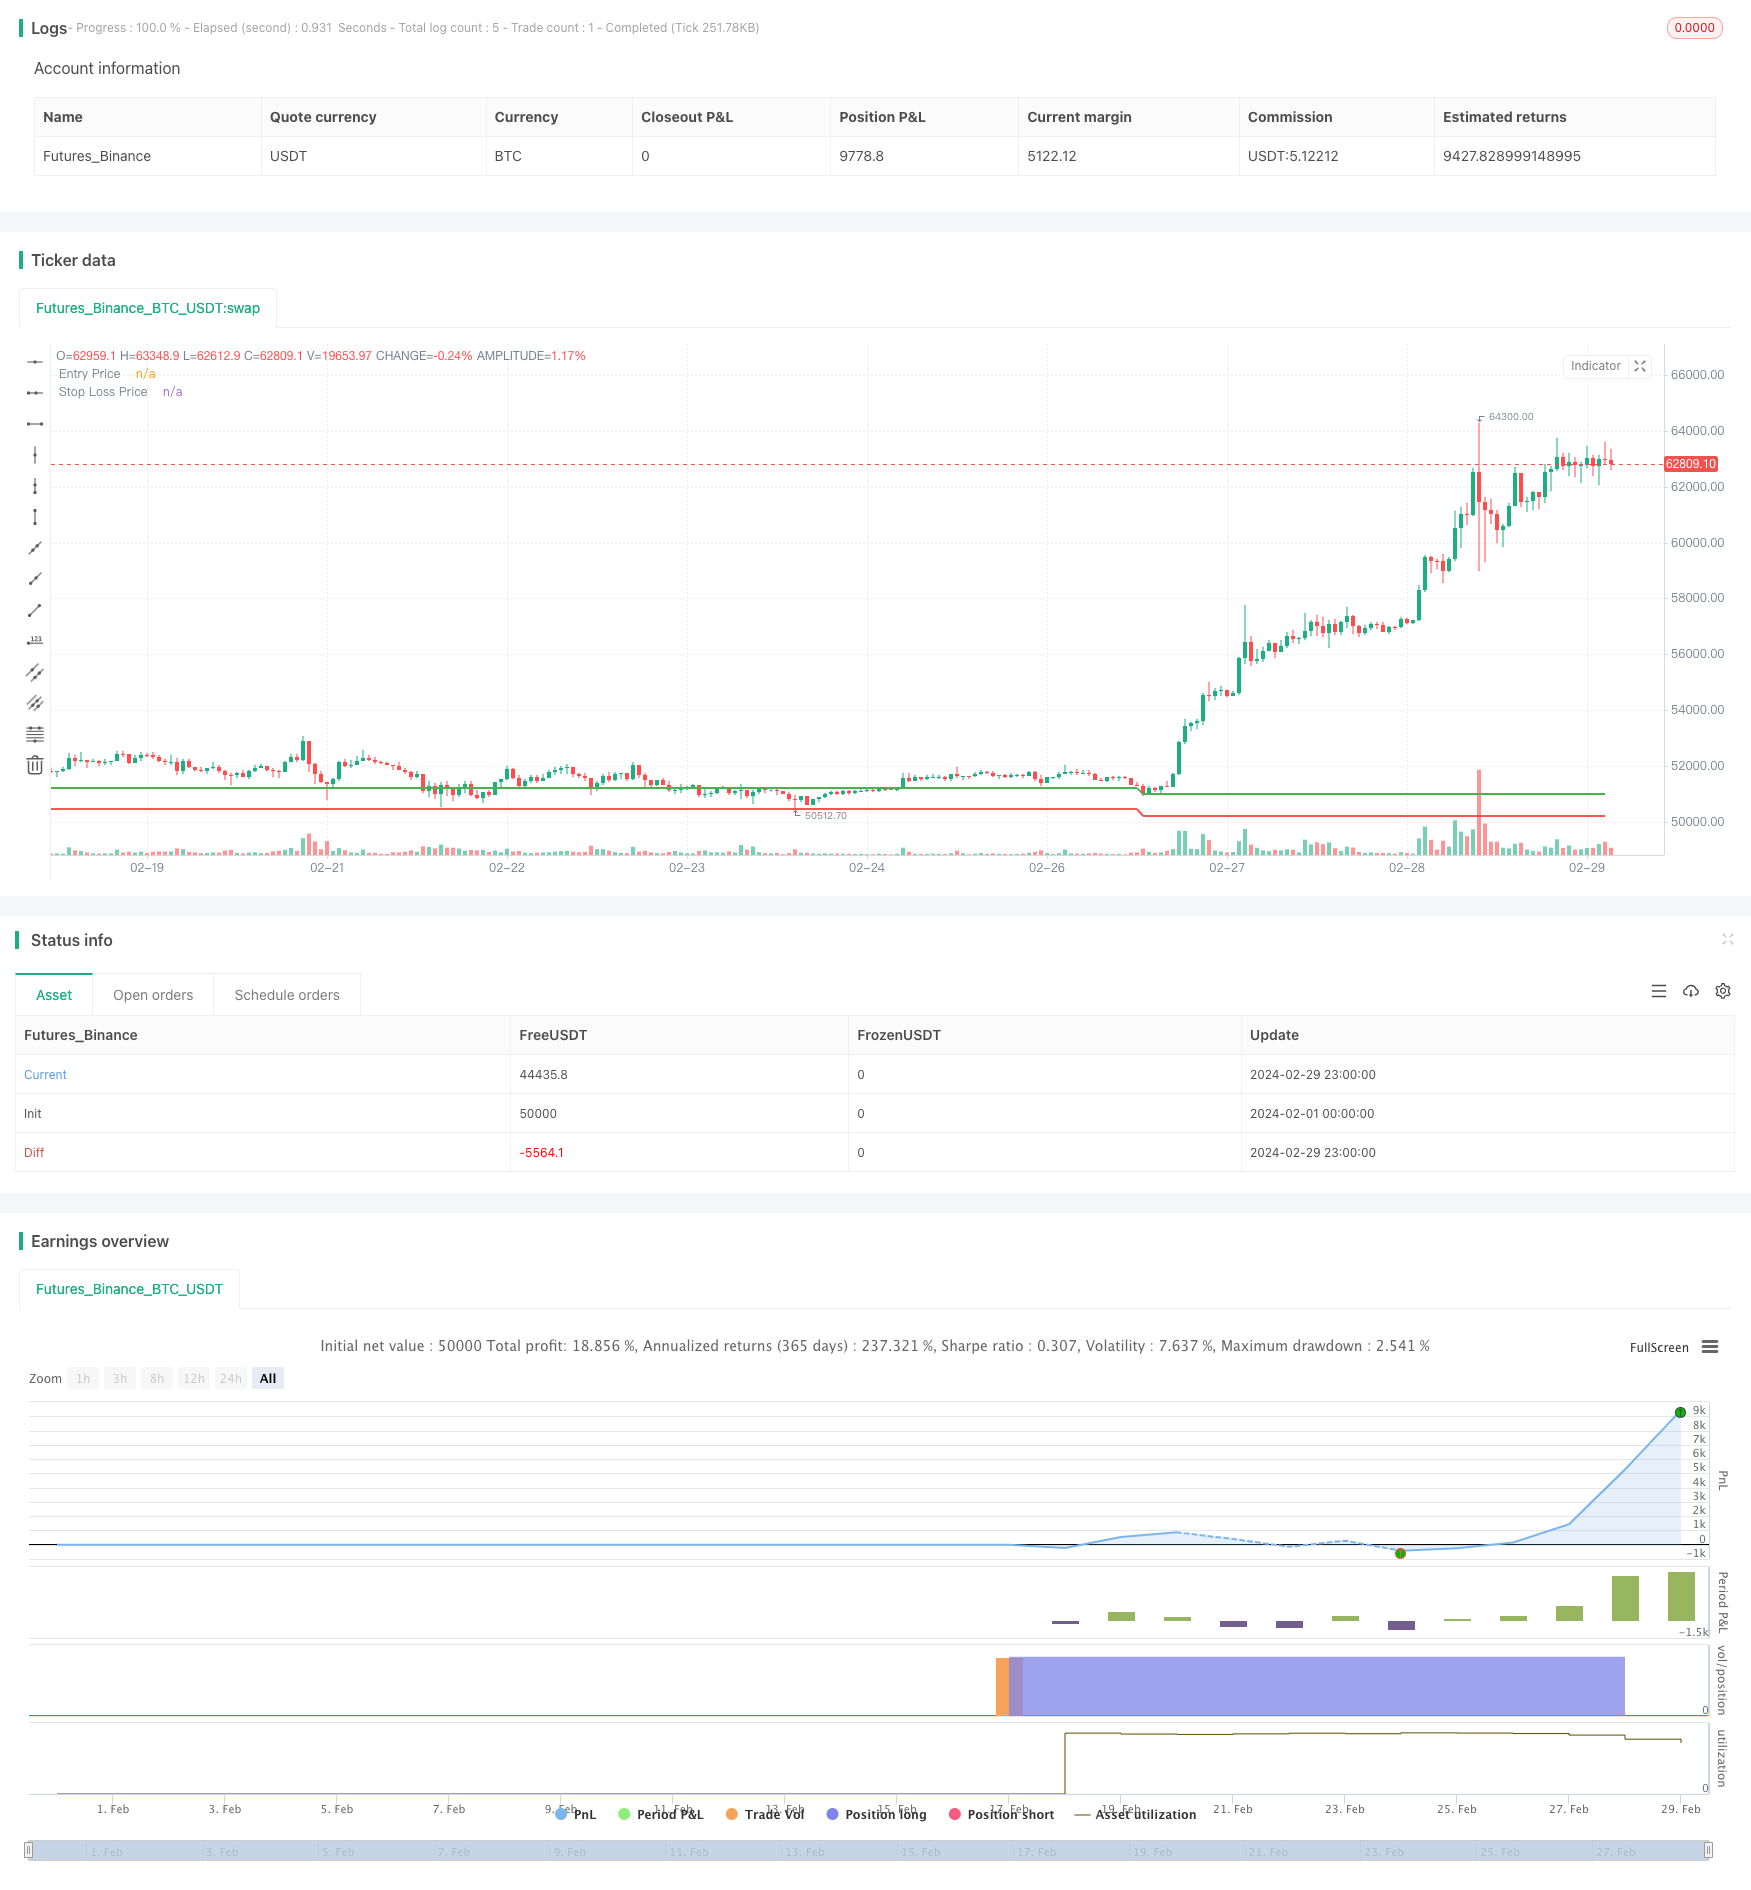
This strategy utilizes the Relative Strength Index (RSI) indicator to determine oversold market conditions. When the RSI falls below 30, a long position is entered, and the stop loss price is set at 98.5% of the entry price. The main idea behind this strategy is to enter the market when an oversold signal appears while strictly controlling risk. Once the price falls below the stop loss price, the position is immediately closed to stop the loss.
Strategy Principle
- Calculate the RSI indicator using the closing prices of 14 bars.
- When the RSI falls below 30, an oversold signal is generated, and a long position is entered.
- At the time of entry, record the entry price and calculate the stop loss price based on the entry price and the stop loss percentage (1.5%).
- When the price falls below the stop loss price, immediately close the position to stop the loss.
- After closing the position, reset the entry price and stop loss price, and wait for the next entry opportunity.
Strategy Advantages
- Simple and easy to understand, with clear logic, suitable for beginners to learn and use.
- Strict risk control by setting a stop loss price. Once the stop loss price is triggered, the position is immediately closed, minimizing the expansion of losses.
- Utilizes the RSI indicator to determine oversold conditions, allowing timely entry into the market after a short-term oversold period to seize rebound opportunities.
- The code is concise and efficient, with fast execution speed, ensuring that trading signals are not missed.
Strategy Risks
- The RSI indicator is a lagging indicator, and there may be situations where the indicator is oversold, but the price continues to fall. In such cases, entering the market may face the risk of further losses.
- A fixed stop loss percentage may not be able to dynamically respond to market volatility. In times of intense market fluctuations, a fixed stop loss may lead to frequent stop-outs, missing subsequent rebound opportunities.
- The strategy lacks a profit target and relies entirely on stop losses to control risk, which may result in low overall profitability.
Strategy Optimization Directions
- Introduce other technical indicators in addition to the RSI indicator to assist in judgment and improve signal accuracy, such as MACD, KDJ, etc.
- Optimize the stop loss percentage by testing different stop loss percentages based on historical data to find the optimal stop loss setting.
- Add dynamic stop loss mechanisms such as trailing stop losses on top of the fixed stop loss to make stop losses more flexible and effective.
- Set profit targets and actively close positions when a certain profit level is reached, rather than relying solely on stop losses for exiting.
Summary
The RSI Stop Loss Tracking Trading Strategy uses the RSI indicator to determine oversold conditions while setting a fixed stop loss percentage to strictly control risk. The overall idea is simple and easy to understand, suitable for beginners to learn and use. However, this strategy also has problems such as lagging, simple stop loss mechanism, and low profitability. It needs to be continuously optimized and improved in actual application to enhance the stability and profitability of the strategy.
/*backtest
start: 2024-02-01 00:00:00
end: 2024-02-29 23:59:59
period: 1h
basePeriod: 15m
exchanges: [{"eid":"Futures_Binance","currency":"BTC_USDT"}]
*/

//@version=5
strategy('RSI Trading Bot', overlay=true)

// RSI threshold value and stop loss percentage
rsiThreshold = 30
stopLossPercentage = 1.5

// Calculate RSI
rsiLength = 14
rsiValue = ta.rsi(close, rsiLength)

// Initialize variables
var bool positionOpen = false
var float entryPrice = na
var float stopLossPrice = na

// Enter position when RSI crosses below threshold
if ta.crossunder(rsiValue, rsiThreshold)
    strategy.entry('Long', strategy.long)
    positionOpen := true
    entryPrice := close
    stopLossPrice := entryPrice * (1 - stopLossPercentage / 100)
    stopLossPrice

// Exit position on stop loss
if positionOpen and close < stopLossPrice
    strategy.close('Long')
    positionOpen := false
    entryPrice := na
    stopLossPrice := na
    stopLossPrice

// Plot entry and stop loss prices
plot(entryPrice, title='Entry Price', color=color.new(color.green, 0), linewidth=2)
plot(stopLossPrice, title='Stop Loss Price', color=color.new(color.red, 0), linewidth=2)
- Dynamic Trend Following Strategy
- Supertrend ATR Strategy
- Triple Exponential Moving Average Convergence Divergence and Relative Strength Index Combined 1-Minute Chart Cryptocurrency Quantitative Trading Strategy
- RSI and Dual Moving Average Based 1-Hour Trend Following Strategy
- Exponential Moving Average Crossover Quantitative Trading Strategy
- SMA-based Trading Strategy for BankNifty Futures
- Bollinger Bands and RSI Trading Strategy
- Gaussian Channel Adaptive Moving Average Strategy
- EMA Crossover Strategy with Target/Stop-loss Ratio and Fixed Position Size
- Moving Average Pullback Tracking Strategy
- SMA Moving Average Crossover Strategy
- Bollinger 5-Minute Breakout Intraday Trading Strategy
- Variance and Moving Averages Based Volatility Strategy
- Moving Average Crossover Quantitative Strategy
- EMA Cross ADR Strategy - A Multidimensional Technical Indicator-Based Trading Method with Strict Risk Management
- Bullish and Bearish Engulfing Strategy Based on Candlestick Patterns
- Bollinger Bands Long Only Strategy
- AlphaTrend and Bollinger Bands Combined Mean Reversion + Trend Following Strategy
- Grid Dollar-Cost Averaging Strategy
- Quantitative Trading Strategy Based on Three Consecutive Bullish/Bearish Candles and Dual Moving Averages