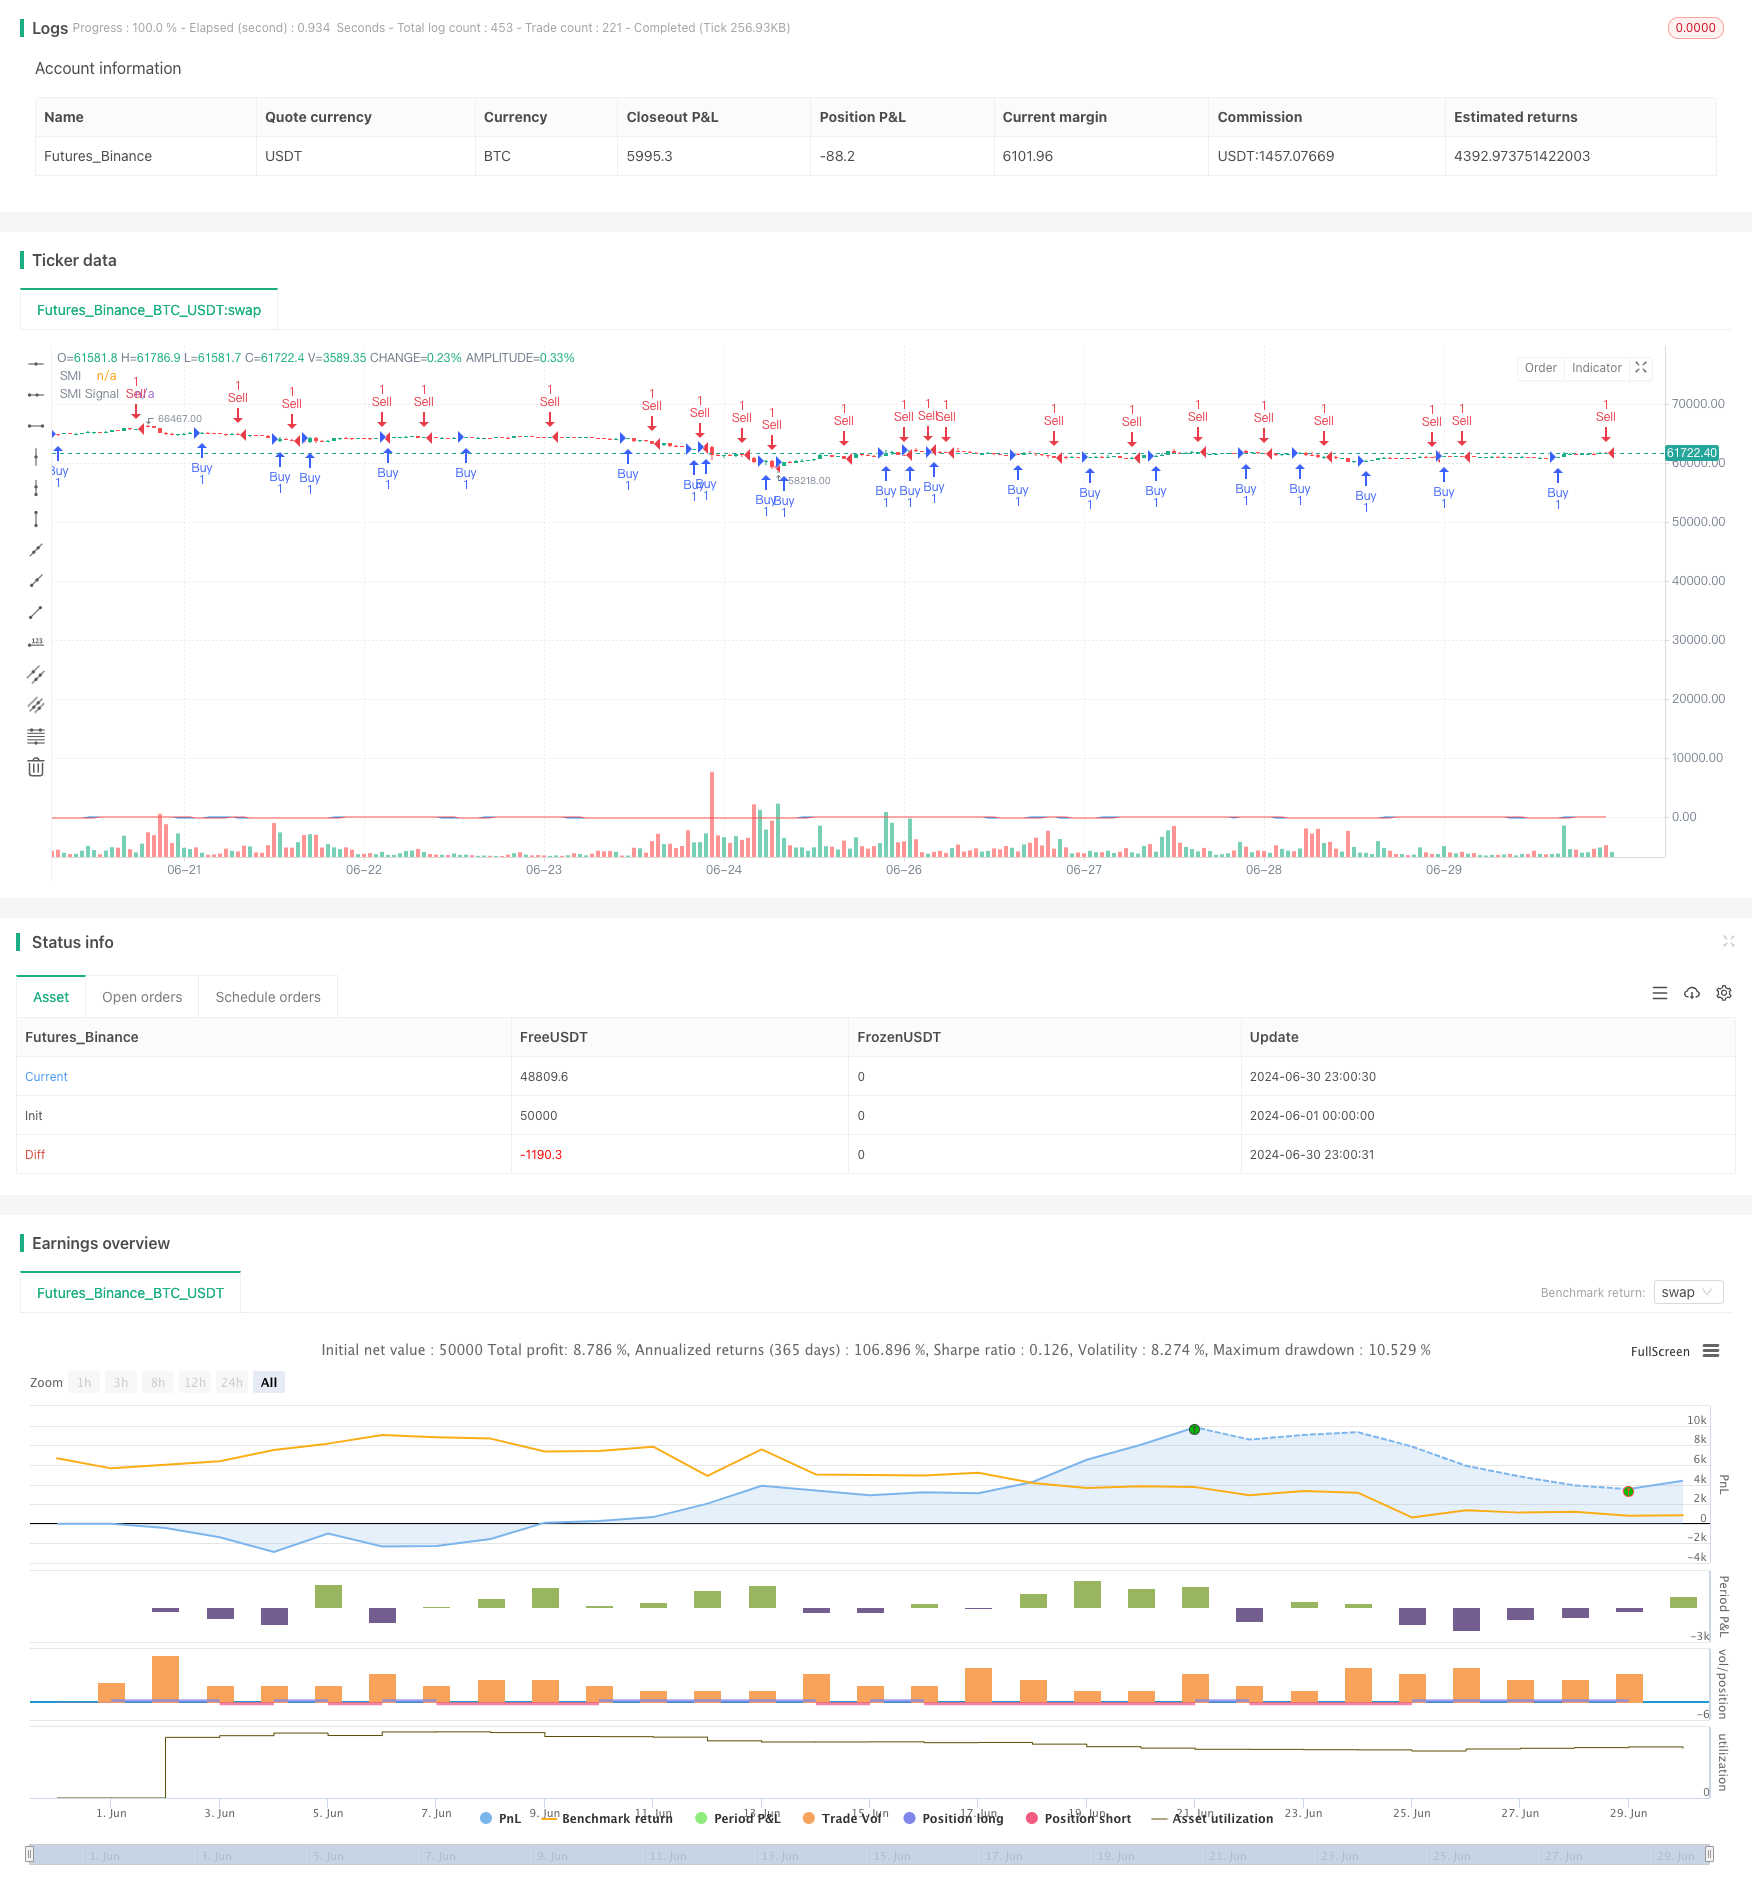
Overview
This strategy is a trading system that combines the Stochastic Momentum Index (SMI) with standard pivot points. It primarily uses the crossover signals from the SMI indicator to determine changes in market momentum, while incorporating price position near pivot points to determine entry timing. This approach aims to capture momentum shifts in the market while utilizing important support and resistance levels to enhance trading accuracy.
Strategy Principles
The core of this strategy is based on the calculation and signal generation of the SMI indicator. SMI is a momentum indicator that measures market momentum by calculating the closing price’s position relative to the high and low prices. The specific steps are as follows:
Calculate SMI components:
- Find the highest (h) and lowest (l) prices within a given period
- Calculate the midpoint m = (h + l) / 2
- Calculate the percentage difference between price and midpoint d = (price - m) / (h - l) * 100
Calculate SMI value:
- Apply a simple moving average of K periods to d to get SMI
- Apply another simple moving average of D periods to SMI to get the SMI signal line
Generate trading signals:
- When the SMI line crosses above the signal line, generate a buy signal
- When the SMI line crosses below the signal line, generate a sell signal
Incorporate pivot points:
- Execute the above trading signals only when the price is near standard pivot point levels
This method combines the trend-following capability of momentum indicators with the support and resistance concept of pivot points, aiming to improve trading accuracy and profitability.
Strategy Advantages
Momentum Capture: The SMI indicator effectively captures changes in market momentum, helping to timely identify potential trend reversals or continuations.
False Signal Filtering: By incorporating pivot points, the strategy can filter out some potential false signals, only trading when price is near key support or resistance levels.
Flexibility: Strategy parameters can be adjusted according to different market conditions and trading instruments to adapt to various trading environments.
Visualization: The strategy plots SMI and signal lines on the chart, allowing traders to visually observe changes in market momentum.
Automation: The strategy can be implemented through programming for fully automated trading, reducing human emotional interference.
Strategy Risks
Lag: Due to the use of moving averages, the SMI indicator may have some lag, potentially missing some trading opportunities in rapidly changing markets.
False Breakouts: In range-bound markets, SMI may produce frequent crossover signals, leading to erroneous trades.
Pivot Point Definition: The strategy relies on standard pivot points, but different pivot point calculation methods may lead to different results.
Parameter Sensitivity: The strategy’s performance may be sensitive to SMI length and smoothing parameters, requiring careful optimization.
Market Condition Dependence: The strategy may underperform in certain market conditions, such as high volatility or unclear trends.
To mitigate these risks, consider the following measures: - Add additional filtering conditions, such as trend filters or volatility indicators - Use adaptive parameters to dynamically adjust SMI calculation periods - Combine with other technical indicators or fundamental analysis to confirm signals - Implement strict risk management, such as setting stop-losses and profit targets
Strategy Optimization Directions
Dynamic Parameter Adjustment: Automatically adjust SMI length and smoothing parameters based on market volatility to adapt to different market environments.
Multi-timeframe Analysis: Introduce SMI signals from longer timeframes as filters to reduce the impact of short-term noise.
Quantify Pivot Point Impact: Adjust position size or set different entry conditions based on the distance between price and pivot points.
Optimize Exit Strategy: The current strategy only focuses on entry; add exit logic based on the SMI indicator, such as reverse crossovers or overbought/oversold levels.
Introduce Volatility Filtering: Adjust strategy parameters or pause trading during high volatility periods to avoid false signals.
Integrate Trend Indicators: Combine with trend indicators like moving averages or ADX to trade only in the direction of the main trend.
Backtesting and Optimization: Conduct comprehensive backtests on different parameter combinations to find the optimal parameter settings.
These optimization directions aim to improve the strategy’s stability and adaptability while reducing false signals and increasing profitability.
Summary
The SMI and Pivot Point Momentum Crossover Strategy is a trading method that combines technical analysis and price action. It uses the SMI indicator to capture changes in market momentum while using pivot points to identify important price levels. The advantage of this method lies in its ability to effectively identify potential trend changes while utilizing key support and resistance levels to improve trading accuracy.
However, the strategy also faces some challenges, such as signal lag and the risk of false breakouts. To overcome these issues, traders need to carefully optimize parameters and consider introducing additional filtering conditions. Through continuous backtesting and optimization, as well as combining other technical indicators and analysis methods, the strategy’s performance and stability can be further improved.
Overall, this is a promising trading strategy framework suitable for traders who wish to build a systematic trading method based on technical analysis. With proper risk management and continuous strategy improvement, it has the potential to become a reliable trading tool.
/*backtest
start: 2024-06-01 00:00:00
end: 2024-06-30 23:59:59
period: 1h
basePeriod: 15m
exchanges: [{"eid":"Futures_Binance","currency":"BTC_USDT"}]
*/

//@version=5
strategy("SMI Strategy", overlay=true)

// Parameters for SMI
smiLength = input.int(8, title="SMI Length")
smiK = input.int(6, title="SMI K Length")
smiD = input.int(6, title="SMI D Length")
smiSource = input.source(close, title="SMI Source")

// Calculate SMI components
h = ta.highest(smiSource, smiLength)
l = ta.lowest(smiSource, smiLength)
m = (h + l) / 2
d = (smiSource - m) / (h - l) * 100

// Calculate SMI
smi = ta.sma(d, smiK)
smiSignal = ta.sma(smi, smiD)

// Define conditions for buy and sell signals
bullishCondition = ta.crossover(smi, smiSignal)
bearishCondition = ta.crossunder(smi, smiSignal)

// Generate buy and sell signals
if (bullishCondition)
    strategy.entry("Buy", strategy.long)

if (bearishCondition)
    strategy.entry("Sell", strategy.short)

// Plot SMI and SMI Signal
plot(smi, title="SMI", color=color.blue)
plot(smiSignal, title="SMI Signal", color=color.red)