概述
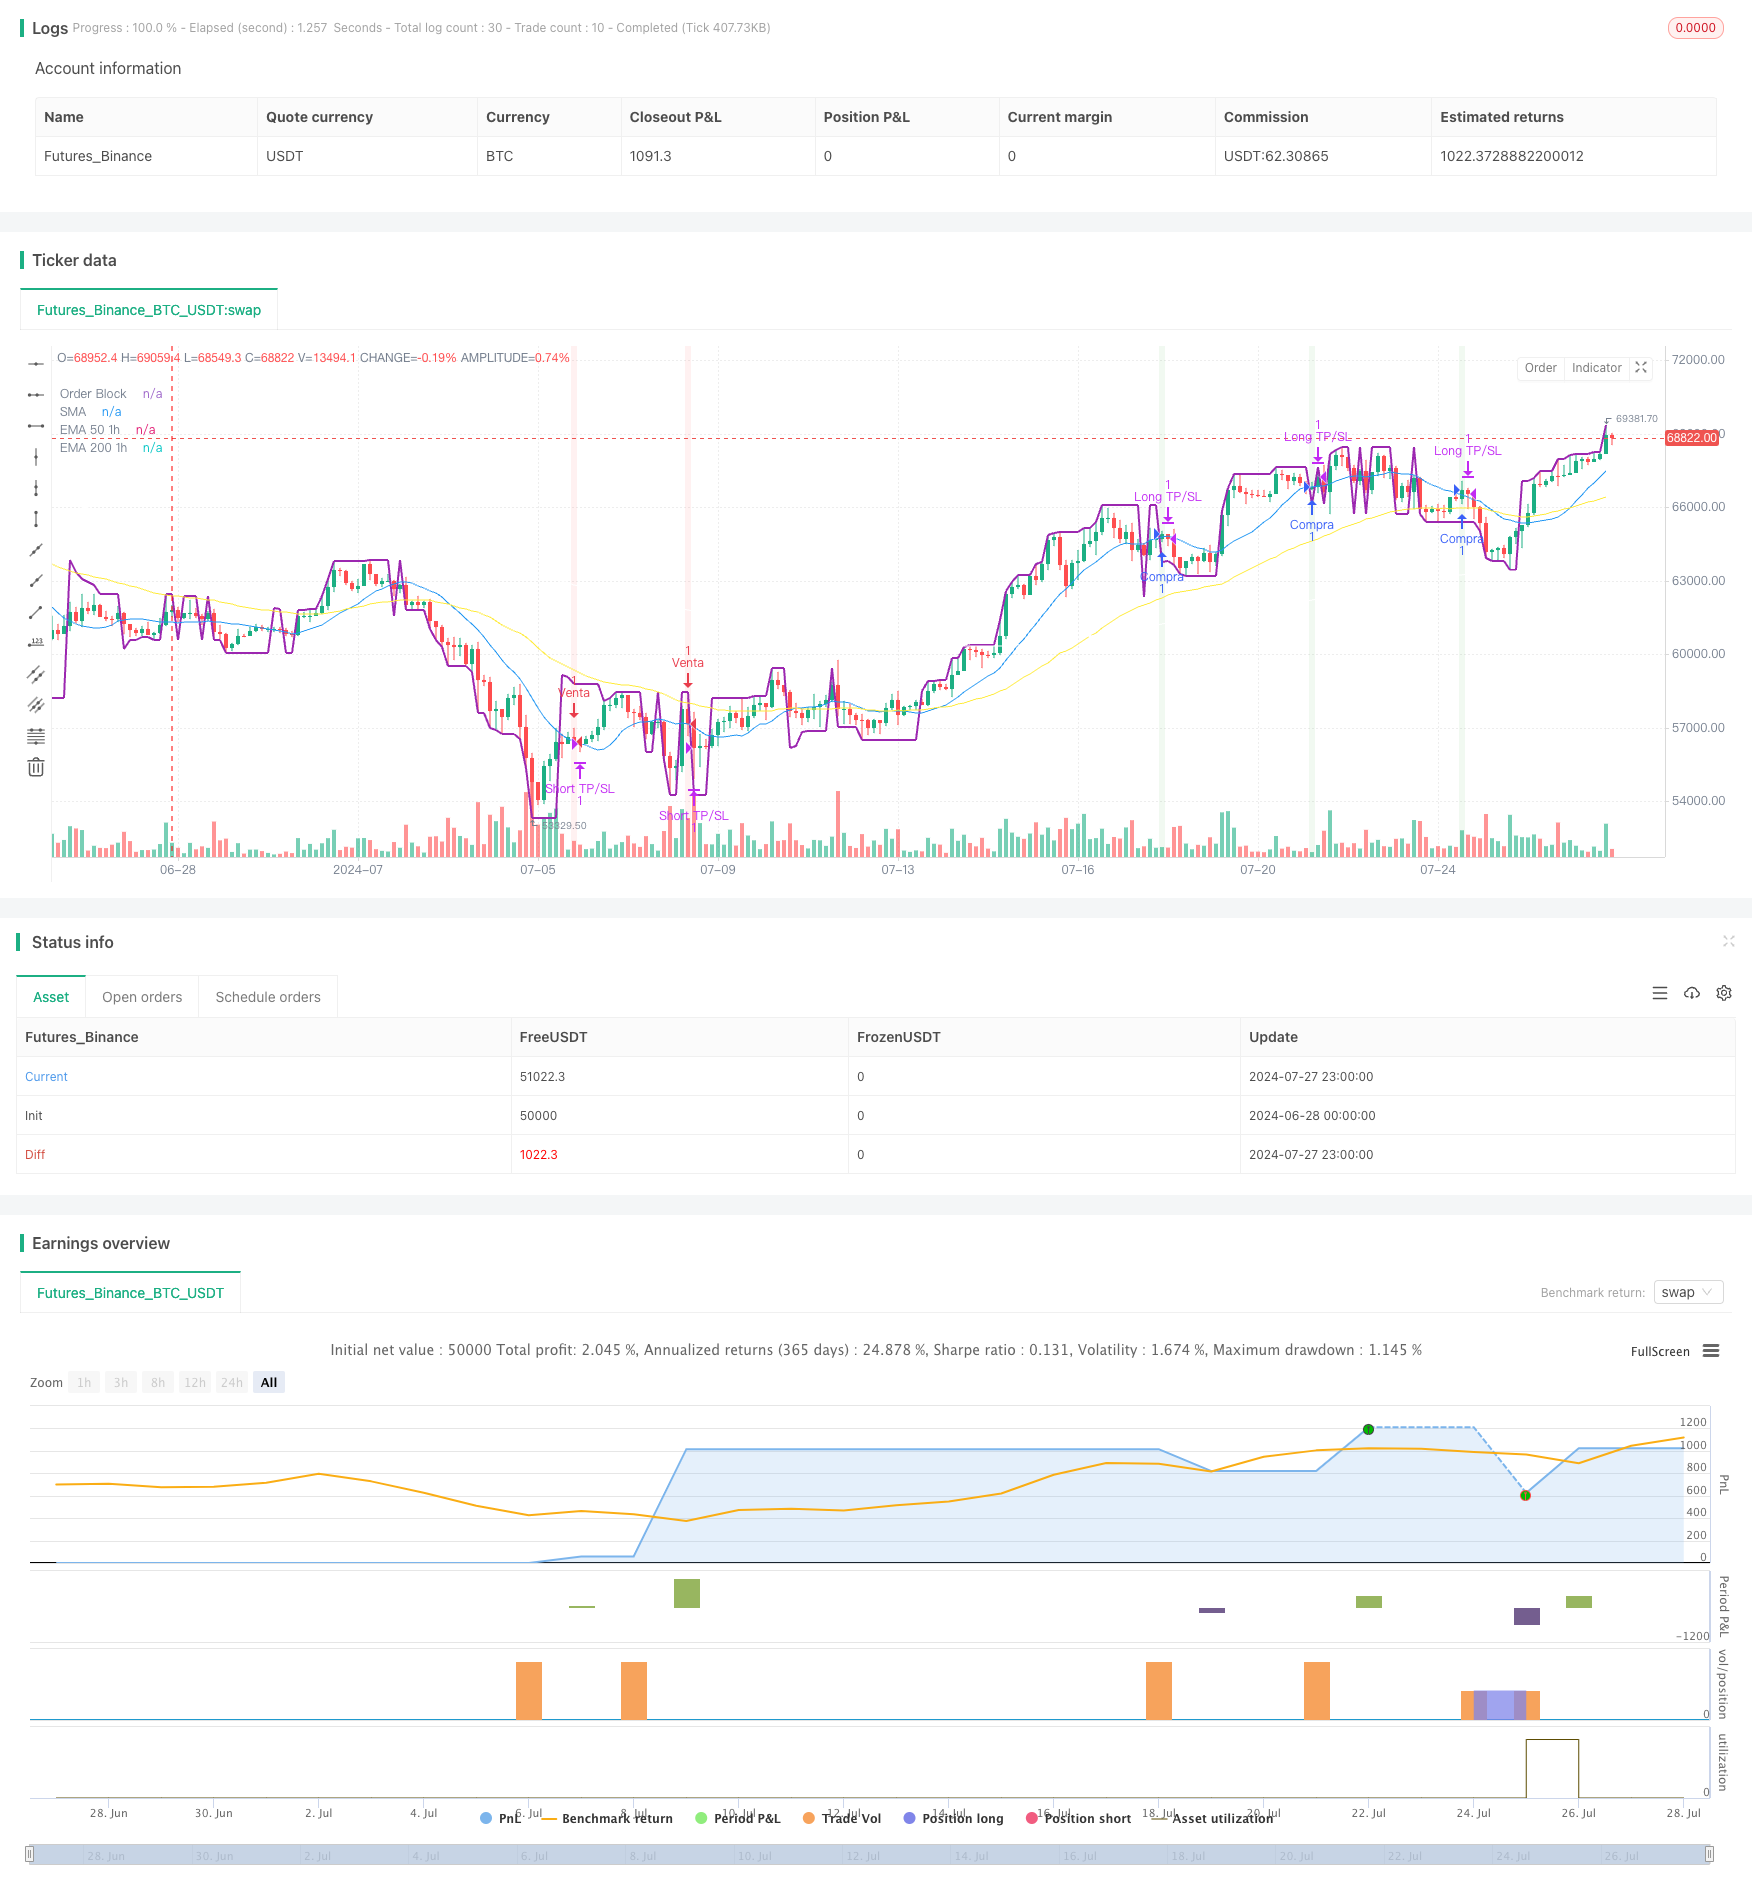
这是一个结合了多个技术指标和交易理念的复杂量化交易策略。该策略主要基于订单区块(Order Block)、趋势变化检测、移动平均线交叉以及多时间框架分析来生成交易信号。策略的核心思想是在较大时间框架(1小时)的趋势方向上,利用较小时间框架(5分钟)的价格行为和技术指标来精确入场和出场。
策略原理
订单区块(Order Block):策略使用自定义函数计算订单区块,这是一个重要的价格水平,通常代表大型机构订单的集中区域。
趋势变化检测:使用简单移动平均线(SMA)的交叉来识别潜在的趋势变化。
多时间框架分析:在1小时时间框架上计算50周期和200周期的指数移动平均线(EMA),用于确定更大的市场趋势。
入场条件:
- 多头:当5分钟图上出现上升趋势信号,价格突破订单区块,且1小时图上50EMA位于200EMA之上时。
- 空头:当5分钟图上出现下降趋势信号,价格跌破订单区块,且1小时图上50EMA位于200EMA之下时。
出场策略:使用固定百分比的止盈和止损水平来管理风险和锁定利润。
策略优势
多维度分析:结合了多个时间框架和技术指标,提供了更全面的市场视角。
趋势跟踪:通过在大趋势方向上交易,提高了盈利概率。
精确入场:利用订单区块和短期趋势变化来优化入场时机。
风险管理:采用预设的止盈和止损百分比,有效控制每笔交易的风险。
适应性强:策略参数可调,能够适应不同市场环境。
策略风险
过度交易:在波动剧烈的市场中可能产生频繁的交易信号,增加交易成本。
滑点风险:在流动性较差的市场中,实际执行价格可能与理想价格有较大偏差。
趋势反转风险:在趋势转折点附近,策略可能会遭受连续亏损。
参数敏感性:策略表现可能对参数设置高度敏感,需要持续优化。
市场环境依赖:在横盘市场或快速震荡市场中,策略效果可能不佳。
策略优化方向
动态参数调整:考虑根据市场波动性自动调整止盈止损百分比。
增加过滤器:引入额外的技术指标或市场情绪指标来减少虚假信号。
时间过滤:加入交易时间窗口限制,避开低流动性时段。
仓位管理:实施更复杂的仓位管理策略,如基于波动性的仓位调整。
回测与优化:进行更广泛的历史数据回测,找出最优参数组合。
增加市场环境识别:开发算法来识别不同的市场状态,并相应调整策略。
总结
这是一个综合性强、逻辑复杂的量化交易策略,结合了多时间框架分析、订单区块理论和趋势跟踪技术。通过在大趋势方向上寻找精确的入场点,策略旨在提高交易的成功率。然而,由于其复杂性,策略也面临着过度拟合和参数敏感性等挑战。未来的优化应该集中在提高策略的适应性和稳健性上,包括动态参数调整、增加过滤器以及更sophisticated的仓位管理方法。总的来说,这个策略为高频交易提供了一个很好的框架,但需要谨慎的实施和持续的监控与调整。
/*backtest
start: 2024-06-28 00:00:00
end: 2024-07-28 00:00:00
period: 3h
basePeriod: 15m
exchanges: [{"eid":"Futures_Binance","currency":"BTC_USDT"}]
*/

//@version=5
strategy("S&P 500", overlay=true)
// Parámetros
length = input(14, "Longitud")
src = input(close, "Fuente")
profit_percent = input.float(0.08955, "Porcentaje de ganancia", step=0.00001, minval=0)
stop_loss_percent = input.float(0.04477, "Porcentaje de stop loss", step=0.00001, minval=0)
// Función para calcular el Order Block
order_block(src, len) =>
    highest = ta.highest(high, len)
    lowest = ta.lowest(low, len)
    mid = (highest + lowest) / 2
    ob = src > mid ? highest : lowest
    ob
// Cálculo del Order Block
ob = order_block(src, length)
// Función para detectar cambios de tendencia
trend_change(src, len) =>
    up = ta.crossover(src, ta.sma(src, len))
    down = ta.crossunder(src, ta.sma(src, len))
    [up, down]
// Detectar cambios de tendencia
[trend_up, trend_down] = trend_change(src, length)
// Calcular EMA 50 y EMA 200 en timeframe de 1 hora
ema50_1h = request.security(syminfo.tickerid, "60", ta.ema(close, 50))
ema200_1h = request.security(syminfo.tickerid, "60", ta.ema(close, 200))
// Condiciones de EMA
ema_buy_condition = ema50_1h > ema200_1h
ema_sell_condition = ema50_1h < ema200_1h
// Señales de compra y venta
buy_signal = trend_up and close > ob and ema_buy_condition
sell_signal = trend_down and close < ob and ema_sell_condition
// Ejecutar la estrategia
if (buy_signal)
    strategy.entry("Compra", strategy.long)
if (sell_signal)
    strategy.entry("Venta", strategy.short)
// Calcular precios de toma de ganancias y stop loss
if (strategy.position_size != 0)
    entry_price = strategy.position_avg_price
    is_long = strategy.position_size > 0
    take_profit = entry_price * (1 + (is_long ? 1 : -1) * profit_percent / 100)
    stop_loss = entry_price * (1 + (is_long ? -1 : 1) * stop_loss_percent / 100)
    strategy.exit(is_long ? "Long TP/SL" : "Short TP/SL", limit=take_profit, stop=stop_loss)
// Visualización
plot(ob, "Order Block", color.purple, 2)
plot(ta.sma(src, length), "SMA", color.blue)
plot(ema50_1h, "EMA 50 1h", color.yellow)
plot(ema200_1h, "EMA 200 1h", color.white)
bgcolor(buy_signal ? color.new(color.green, 90) : sell_signal ? color.new(color.red, 90) : na)