Multi-Period Dynamic Channel Crossover Strategy
Author: ChaoZhang, Date: 2024-07-30 11:59:06Tags:
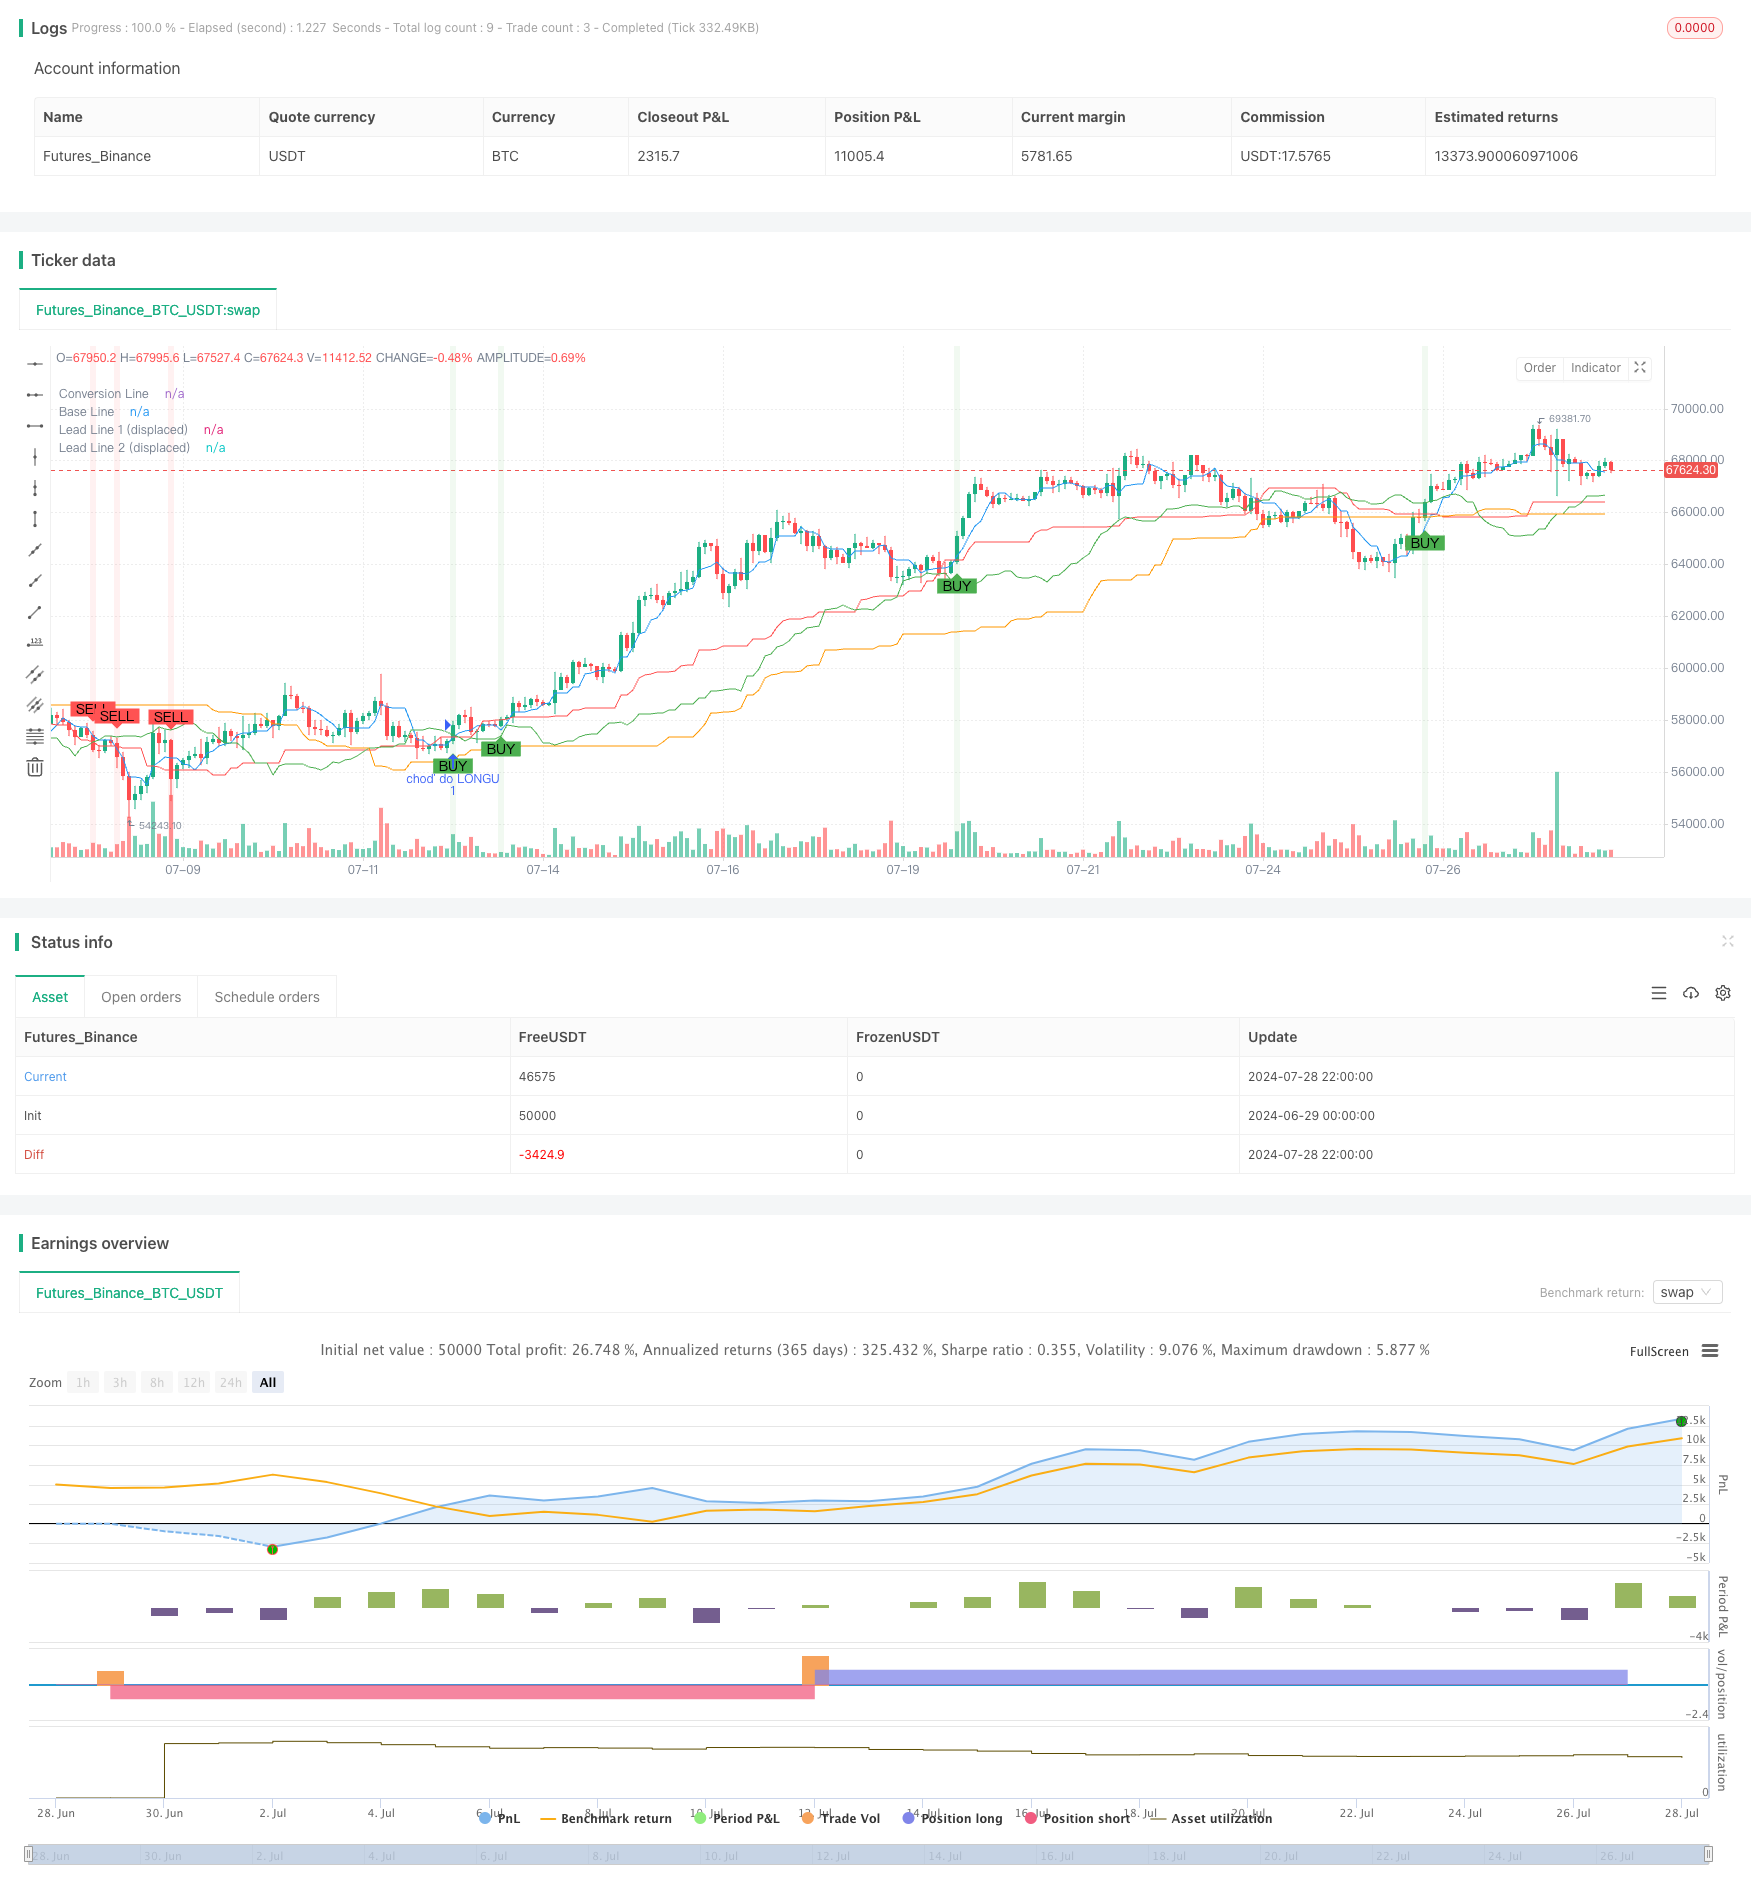
Overview
The Multi-Period Dynamic Channel Crossover Strategy is a quantitative trading approach based on the principles of Donchian Channels and Ichimoku Cloud. This strategy utilizes price channels and moving averages from different time periods to identify market trends and potential trading opportunities. By analyzing multiple timeframes, the strategy aims to capture medium to long-term market trends while leveraging short-term price movements for entry and exit points.
Strategy Principles
The core principles of this strategy are based on the following key components:
Donchian Channels: The strategy uses Donchian Channels of three different periods (conversionPeriods, basePeriods, and laggingSpan2Periods) to calculate various indicator lines. Donchian Channels are volatility indicators formed by the midpoint of the highest high and lowest low prices.
Conversion Line: Uses the midpoint of the Donchian Channel with a shorter period (conversionPeriods).
Base Line: Uses the midpoint of the Donchian Channel with a medium period (basePeriods).
Lead Line 1: The average of the Conversion Line and Base Line.
Lead Line 2: Uses the midpoint of the Donchian Channel with a longer period (laggingSpan2Periods).
Displacement: Both Lead Line 1 and Lead Line 2 are shifted forward by a certain number of periods (displacement) to project future price ranges.
Trading signals are generated based on the following conditions:
Buy Signal: - Current closing price is above the displaced Lead Line 2 - Displaced Lead Line 1 is above displaced Lead Line 2 - Price crosses above the Base Line
Sell Signal: - Current closing price is below the displaced Lead Line 1 - Displaced Lead Line 1 is below displaced Lead Line 2 - Price crosses below the Base Line
Strategy Advantages
Multi-period analysis: By combining indicators from different timeframes, the strategy can capture short, medium, and long-term market trends, improving trading accuracy and stability.
Trend following: The strategy design is based on trend-following principles, helping to capture significant gains in strong trends while avoiding frequent trading in choppy markets.
Dynamic adaptation: The dynamic nature of Donchian Channels allows the strategy to automatically adapt to changes in market volatility, maintaining effectiveness in different market environments.
Visual aids: The strategy plots various indicator lines and background colors on the chart, helping traders visually understand market conditions and potential trading opportunities.
Risk management: By using multiple conditions to confirm trading signals, the strategy reduces the risk of false breakouts and erroneous signals.
Flexibility: Strategy parameters can be optimized for different trading instruments and market conditions, enhancing the strategy’s adaptability.
Strategy Risks
Lag: Due to the use of moving averages and displacement, the strategy may react slowly in rapidly reversing markets, leading to delayed entries or exits.
False breakouts: In sideways or choppy markets, the strategy may generate false trading signals, increasing trading costs.
Over-optimization: Excessive parameter adjustment may lead to good performance on historical data but poor results in future live trading.
Market environment dependency: The strategy performs well in strong trending markets but may underperform in ranging or quickly reversing markets.
Capital management: The strategy lacks explicit stop-loss and take-profit mechanisms, which may lead to excessive losses on individual trades.
Optimization Directions
Dynamic parameter adjustment: Introduce adaptive mechanisms to automatically adjust Donchian Channel and displacement periods based on market volatility, adapting to different market environments.
Add filters: Incorporate other technical indicators (such as RSI, MACD) as filters to reduce false breakout signals.
Improve capital management: Introduce dynamic position sizing and stop-loss/take-profit mechanisms to control risk and optimize returns.
Multi-timeframe confirmation: Add trend confirmation from higher timeframes to increase the reliability of trading signals.
Volatility adjustment: Dynamically adjust trading thresholds based on market volatility, reducing trading frequency during low volatility periods.
Machine learning optimization: Use machine learning algorithms to optimize parameter selection and signal generation processes, improving strategy adaptability and performance.
Conclusion
The Multi-Period Dynamic Channel Crossover Strategy is a comprehensive trading system that combines the principles of Donchian Channels and Ichimoku Cloud. By analyzing price channels and moving averages across multiple timeframes, the strategy aims to capture major market trends and trade at appropriate times. Its strengths lie in multi-period analysis, dynamic market adaptation, and intuitive visualization, but it also faces risks such as lag and false breakouts. Through further optimization, such as introducing dynamic parameter adjustments, strengthening risk management, and utilizing machine learning techniques, this strategy has the potential to achieve more stable and reliable performance across various market environments. For investors seeking medium to long-term trend trading opportunities, this strategy framework is worth considering.
/*backtest
start: 2024-06-29 00:00:00
end: 2024-07-29 00:00:00
period: 2h
basePeriod: 15m
exchanges: [{"eid":"Futures_Binance","currency":"BTC_USDT"}]
*/

//@version=5
strategy("***special edition***", shorttitle="***special edition***", overlay=true)

// Nastavenia Donchian kanála s možnosťou optimalizácie
conversionPeriods   = input.int(5, minval=1, maxval=20, title="prvá")
basePeriods         = input.int(51, minval=1, maxval=100, title="druhá")
laggingSpan2Periods = input.int(68, minval=1, maxval=100, title="tretia")
displacement        = input.int(21, minval=1, maxval=30, title="byebye")

// Definícia funkcie Donchian
donchian(len) =>
    (ta.lowest(low, len) + ta.highest(high, len)) / 2

// Vypočítavanie čiar
conversionLine = donchian(conversionPeriods)
baseLine  = donchian(basePeriods)
leadLine1 = (conversionLine + baseLine) / 2
leadLine2 = donchian(laggingSpan2Periods)
leadLineDisp1 = leadLine1[displacement]
leadLineDisp2 = leadLine2[displacement]

// Definícia signálov pre nákup a predaj
buySignal = close > leadLineDisp2 and leadLineDisp1 > leadLineDisp2 and ta.crossover(close, baseLine)
sellSignal = close < leadLineDisp1 and leadLineDisp1 < leadLineDisp2 and ta.crossunder(close, baseLine)

// Spustenie vstupu stratégie na základe signálov
if buySignal
    strategy.entry("choď do LONGU", strategy.long)
if sellSignal
    strategy.entry("choď do SHORTU", strategy.short)

// Kreslenie čiar na grafe
plot(conversionLine, color=color.blue, title="Conversion Line")
plot(baseLine, color=color.red, title="Base Line")
plot(leadLineDisp1, color=color.green, title="Lead Line 1 (displaced)")
plot(leadLineDisp2, color=color.orange, title="Lead Line 2 (displaced)")

// Zvýraznenie buy a sell signálov
plotshape(series=buySignal, location=location.belowbar, color=color.green, style=shape.labelup, title="Buy Signal", text="BUY")
plotshape(series=sellSignal, location=location.abovebar, color=color.red, style=shape.labeldown, title="Sell Signal", text="SELL")

// Pridanie pozadia pre buy a sell zóny
bgcolor(buySignal ? color.new(color.green, 90) : na, title="Buy Zone Background")
bgcolor(sellSignal ? color.new(color.red, 90) : na, title="Sell Zone Background")
- Multi-Level Oversold Oscillator Buy Strategy
- Adaptive Trend Following Strategy Combining AlphaTrend and KAMA with Risk Management
- Dual Indicator Cross-Confirmation Momentum Volume Quantitative Trading Strategy
- Dynamic Trend Following Strategy - Multi-Indicator Integrated Momentum Analysis System
- Multi-EMA and Supertrend Crossover Strategy
- Dynamic Mean Reversion and Momentum Strategy
- Dual EMA Dynamic Trend Capture Trading System
- Multi-Confirmation Reversal Buy Strategy
- Enhanced Dual EMA Pullback Breakout Trading Strategy
- Multi-Timeframe Exponential Moving Average Crossover Strategy
- Comprehensive Price Gap Short-Term Trend Capture Strategy
- Multi-Stochastic Oscillation and Momentum Analysis System
- Multi-Timeframe Moving Average and RSI Trend Trading Strategy
- Multi-Period Moving Average Crossover Trend Following Strategy
- Three-Week High-Low Momentum Trading Strategy
- Adaptive Moving Average Crossover Strategy
- Technical Indicator Strategy, Risk Management Strategy, Adaptive Trend Following Strategy
- Bollinger Bands Momentum Optimization Strategy
- Multi-Level Dynamic Trend Following System
- Advanced Mean Reversion Trading Strategy: Dynamic Range Breakout System Based on Standard Deviation