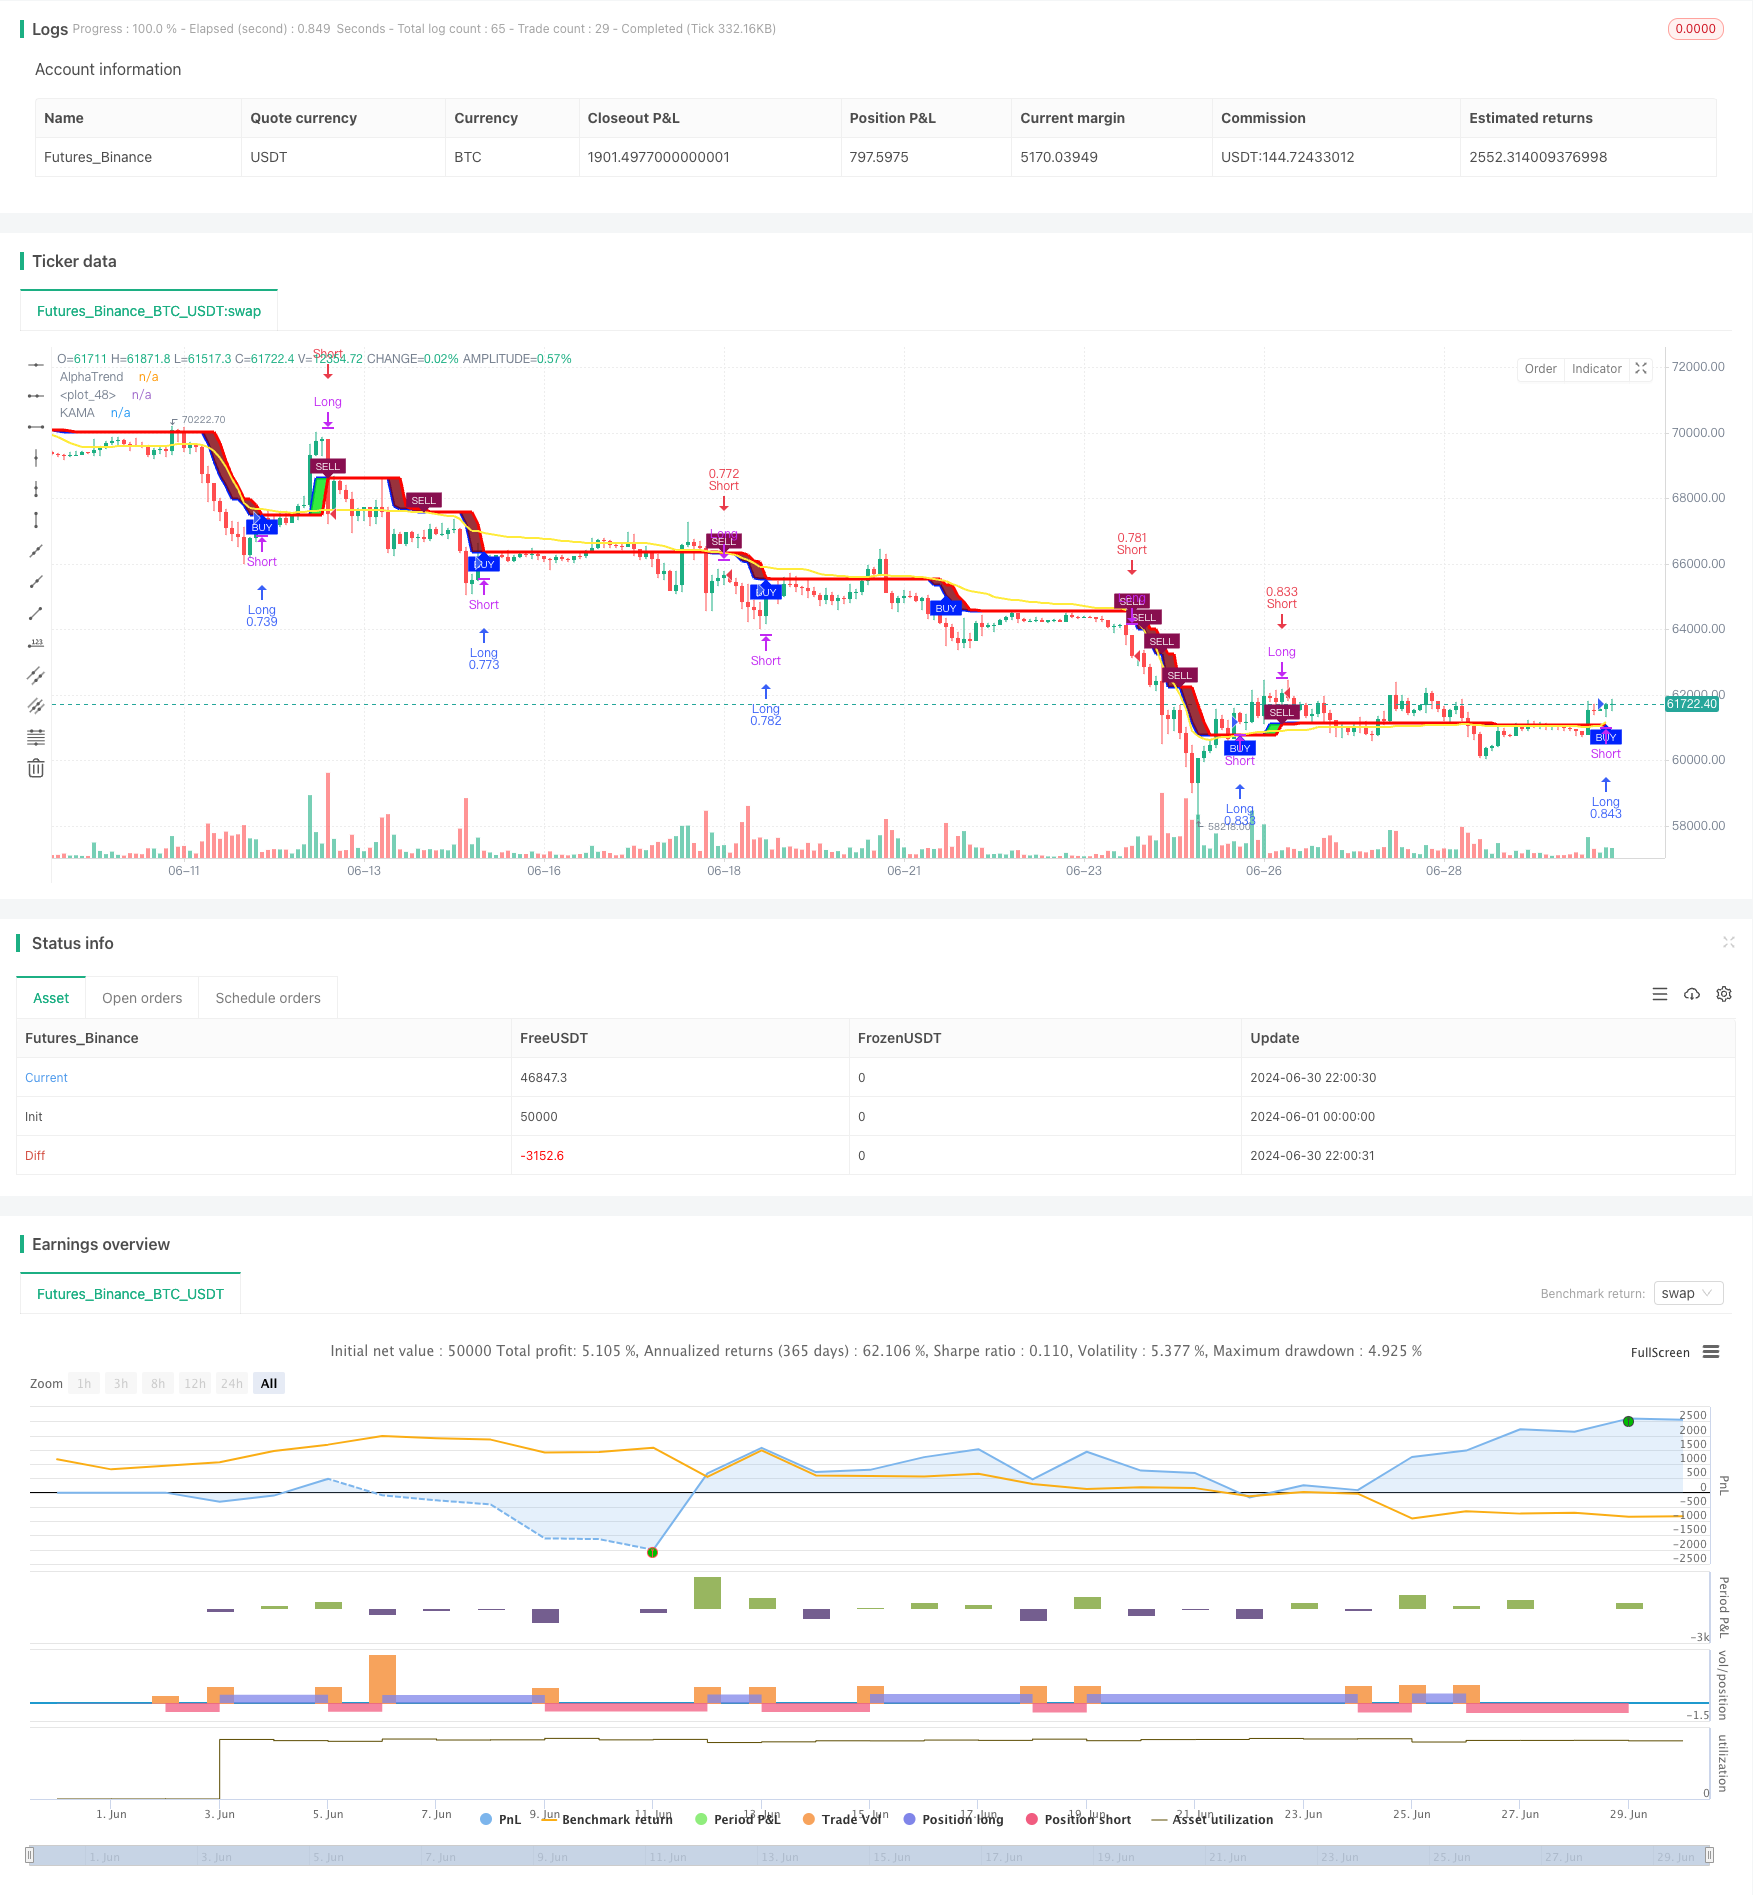
概述
本策略是一个结合了AlphaTrend指标和考夫曼自适应移动平均线(KAMA)的趋势跟踪系统,同时整合了风险管理功能。该策略旨在捕捉市场趋势,同时通过部分止盈来管理风险。策略的核心在于利用AlphaTrend指标识别总体趋势方向,而KAMA则用于生成更精确的入场和出场信号。此外,策略还包含了一个基于百分比的部分止盈机制,以在达到特定盈利目标时锁定部分利润。
策略原理
AlphaTrend指标计算:
- 使用平均真实范围(ATR)来计算上下通道。
- 根据市场资金流向指标(MFI)或相对强弱指标(RSI)的值来确定趋势方向。
KAMA计算:
- 采用考夫曼自适应移动平均线,根据市场波动性动态调整其敏感度。
交易信号生成:
- 买入信号:当KAMA线上穿AlphaTrend线时触发。
- 卖出信号:当KAMA线下穿AlphaTrend线时触发。
风险管理:
- 实现部分止盈机制,在达到预设的盈利百分比时平掉一半仓位。
仓位管理:
- 采用账户净值百分比方式进行仓位管理,确保资金利用的灵活性。
策略优势
趋势适应性强:结合AlphaTrend和KAMA,能够更好地适应不同市场环境。
信号可靠性高:通过多重条件确认,提高了交易信号的可靠性。
风险管理完善:部分止盈机制有助于在波动市场中锁定利润。
灵活的仓位管理:基于账户净值的仓位管理方式,适应不同的资金规模。
可视化效果佳:策略提供了清晰的图形界面,便于分析和监控。
策略风险
假突破风险:在震荡市场中可能产生频繁的假突破信号。
滞后性:作为趋势跟踪策略,在趋势反转初期可能反应较慢。
参数敏感性:策略表现可能对参数设置较为敏感。
回撤风险:在强趋势市场中,部分止盈可能导致错过大行情。
市场适应性:策略可能在某些特定市场条件下表现欠佳。
策略优化方向
动态参数调整:
- 实现AlphaTrend和KAMA参数的自适应调整,以适应不同的市场环境。
- 原因:提高策略在不同市场周期的适应性。
多时间框架分析:
- 引入多时间框架确认机制,提高信号的可靠性。
- 原因:减少假突破,提高交易成功率。
波动率过滤:
- 增加基于ATR的波动率过滤器,在低波动率环境下减少交易。
- 原因:避免在盘整市场中过度交易。
智能止损:
- 实现基于ATR的动态止损,提高风险管理的灵活性。
- 原因:更好地适应市场波动,保护利润。
市场状态分类:
- 引入市场状态分类机制,在不同市场状态下采用不同的交易策略。
- 原因:提高策略在各种市场环境下的表现。
总结
AlphaTrend与KAMA结合的自适应趋势跟踪与风险管理策略是一个全面而强大的交易系统。它通过结合AlphaTrend指标和KAMA的优势,实现了对市场趋势的精准把握。策略的风险管理机制,特别是部分止盈功能,为投资者提供了在波动市场中保护利润的有效工具。尽管存在一些固有的风险,如假突破和参数敏感性,但通过持续优化和调整,该策略有潜力成为一个可靠的交易系统。未来的优化方向,如动态参数调整和多时间框架分析,将进一步增强策略的适应性和稳健性。总的来说,这是一个值得深入研究和实践的策略,特别适合那些寻求在趋势跟踪与风险管理之间取得平衡的交易者。
/*backtest
start: 2024-06-01 00:00:00
end: 2024-06-30 23:59:59
period: 2h
basePeriod: 15m
exchanges: [{"eid":"Futures_Binance","currency":"BTC_USDT"}]
*/

//@version=5
strategy('AlphaTrend with KAMA and Risk Management', shorttitle='AT+KAMA+RM', overlay=true, format=format.price, precision=2, initial_capital=100000, default_qty_type=strategy.percent_of_equity, default_qty_value=100)

// AlphaTrend Inputs
coeff = input.float(1, 'AT Multiplier', step=0.1)
AP = input.int(14, 'AT Common Period', minval=1)
src = input.source(close, 'AT Source')
showsignals = input.bool(true, 'Show Signals?')
novolumedata = input.bool(false, 'Change calculation (no volume data)?')

// KAMA Inputs
kamaLength = input.int(21, 'KAMA Length', minval=1)

// Risk Management Inputs
profitTarget = input.float(10, 'Profit Target for Partial Exit (%)', minval=1, step=0.1)

// Yeni değişkenler
var float entryPrice = na
var string currentPosition = "flat"  // "long", "short", veya "flat"
var float partialExitPrice = na

// AlphaTrend Calculation
ATR = ta.sma(ta.tr, AP)
upT = low - ATR * coeff
downT = high + ATR * coeff
AlphaTrend = 0.0
AlphaTrend := (novolumedata ? ta.rsi(src, AP) >= 50 : ta.mfi(hlc3, AP) >= 50) ? upT < nz(AlphaTrend[1]) ? nz(AlphaTrend[1]) : upT : downT > nz(AlphaTrend[1]) ? nz(AlphaTrend[1]) : downT

// KAMA Calculation
xPrice = close
xvnoise = math.abs(xPrice - xPrice[1])
nAMA = 0.0
nfastend = 0.666
nslowend = 0.0645
nsignal = math.abs(xPrice - xPrice[kamaLength])

// Manual calculation of sum
nnoise = 0.0
for i = 0 to kamaLength-1
    nnoise := nnoise + xvnoise[i]
nefratio = nnoise != 0 ? nsignal / nnoise : 0
nsmooth = math.pow(nefratio * (nfastend - nslowend) + nslowend, 2)
nAMA := nz(nAMA[1]) + nsmooth * (xPrice - nz(nAMA[1]))

// Plotting
color1 = AlphaTrend > AlphaTrend[2] ? #00E60F : AlphaTrend < AlphaTrend[2] ? #80000B : AlphaTrend[1] > AlphaTrend[3] ? #00E60F : #80000B
k1 = plot(AlphaTrend, color=color.new(#0022FC, 0), linewidth=3, title='AlphaTrend')
k2 = plot(AlphaTrend[2], color=color.new(#FC0400, 0), linewidth=3)
fill(k1, k2, color=color1)
plot(nAMA, color=color.yellow, linewidth=2, title='KAMA')

// Sinyal koşulları
buyCondition = (ta.crossover(nAMA, AlphaTrend) and ta.crossover(nAMA, AlphaTrend[2])) or
             (ta.crossover(nAMA, AlphaTrend) and nAMA > AlphaTrend[2]) or
             (ta.crossover(nAMA, AlphaTrend[2]) and nAMA > AlphaTrend)
sellCondition = (ta.crossunder(nAMA, AlphaTrend) and ta.crossunder(nAMA, AlphaTrend[2])) or
              (ta.crossunder(nAMA, AlphaTrend) and nAMA < AlphaTrend[2]) or
              (ta.crossunder(nAMA, AlphaTrend[2]) and nAMA < AlphaTrend)

// Yeni Sinyaller
buySignal = buyCondition
sellSignal = sellCondition

// Alım satım mantığı
if (buySignal and currentPosition != "long")
    if (currentPosition == "short")
        strategy.close("Short")
    strategy.entry("Long", strategy.long)
    entryPrice := close
    currentPosition := "long"
    partialExitPrice := entryPrice * (1 + profitTarget / 100)

if (sellSignal and currentPosition != "short")
    if (currentPosition == "long")
        strategy.close("Long")
    strategy.entry("Short", strategy.short)
    entryPrice := close
    currentPosition := "short"
    partialExitPrice := entryPrice * (1 - profitTarget / 100)

// Kısmi çıkış mantığı
if (currentPosition == "long" and high >= partialExitPrice)
    strategy.close("Long", comment="Partial Exit at " + str.tostring(profitTarget) + "% profit", qty_percent=50)
    partialExitPrice := na
if (currentPosition == "short" and low <= partialExitPrice)
    strategy.close("Short", comment="Partial Exit at " + str.tostring(profitTarget) + "% profit", qty_percent=50)
    partialExitPrice := na

// Plotting signals
plotshape(buySignal and showsignals ? AlphaTrend * 0.9999 : na, title='BUY', text='BUY', location=location.absolute, style=shape.labelup, size=size.tiny, color=color.new(#0022FC, 0), textcolor=color.new(color.white, 0))
plotshape(sellSignal and showsignals ? AlphaTrend * 1.0001 : na, title='SELL', text='SELL', location=location.absolute, style=shape.labeldown, size=size.tiny, color=color.new(color.maroon, 0), textcolor=color.new(color.white, 0))
plotshape(currentPosition == "long" and high >= partialExitPrice ? high : na, title='PARTIAL EXIT LONG', text='PARTIAL', location=location.absolute, style=shape.labeldown, size=size.tiny, color=color.new(color.orange, 0), textcolor=color.new(color.white, 0))
plotshape(currentPosition == "short" and low <= partialExitPrice ? low : na, title='PARTIAL EXIT SHORT', text='PARTIAL', location=location.absolute, style=shape.labelup, size=size.tiny, color=color.new(color.orange, 0), textcolor=color.new(color.white, 0))

// Alerts
alertcondition(buySignal, title='BUY Signal', message='KAMA crossed above AlphaTrend - BUY!')
alertcondition(sellSignal, title='SELL Signal', message='KAMA crossed below AlphaTrend - SELL!')
alertcondition((currentPosition == "long" and high >= partialExitPrice) or (currentPosition == "short" and low <= partialExitPrice), title='Partial Exit', message='Profit target reached - Closing half position!')