Overview
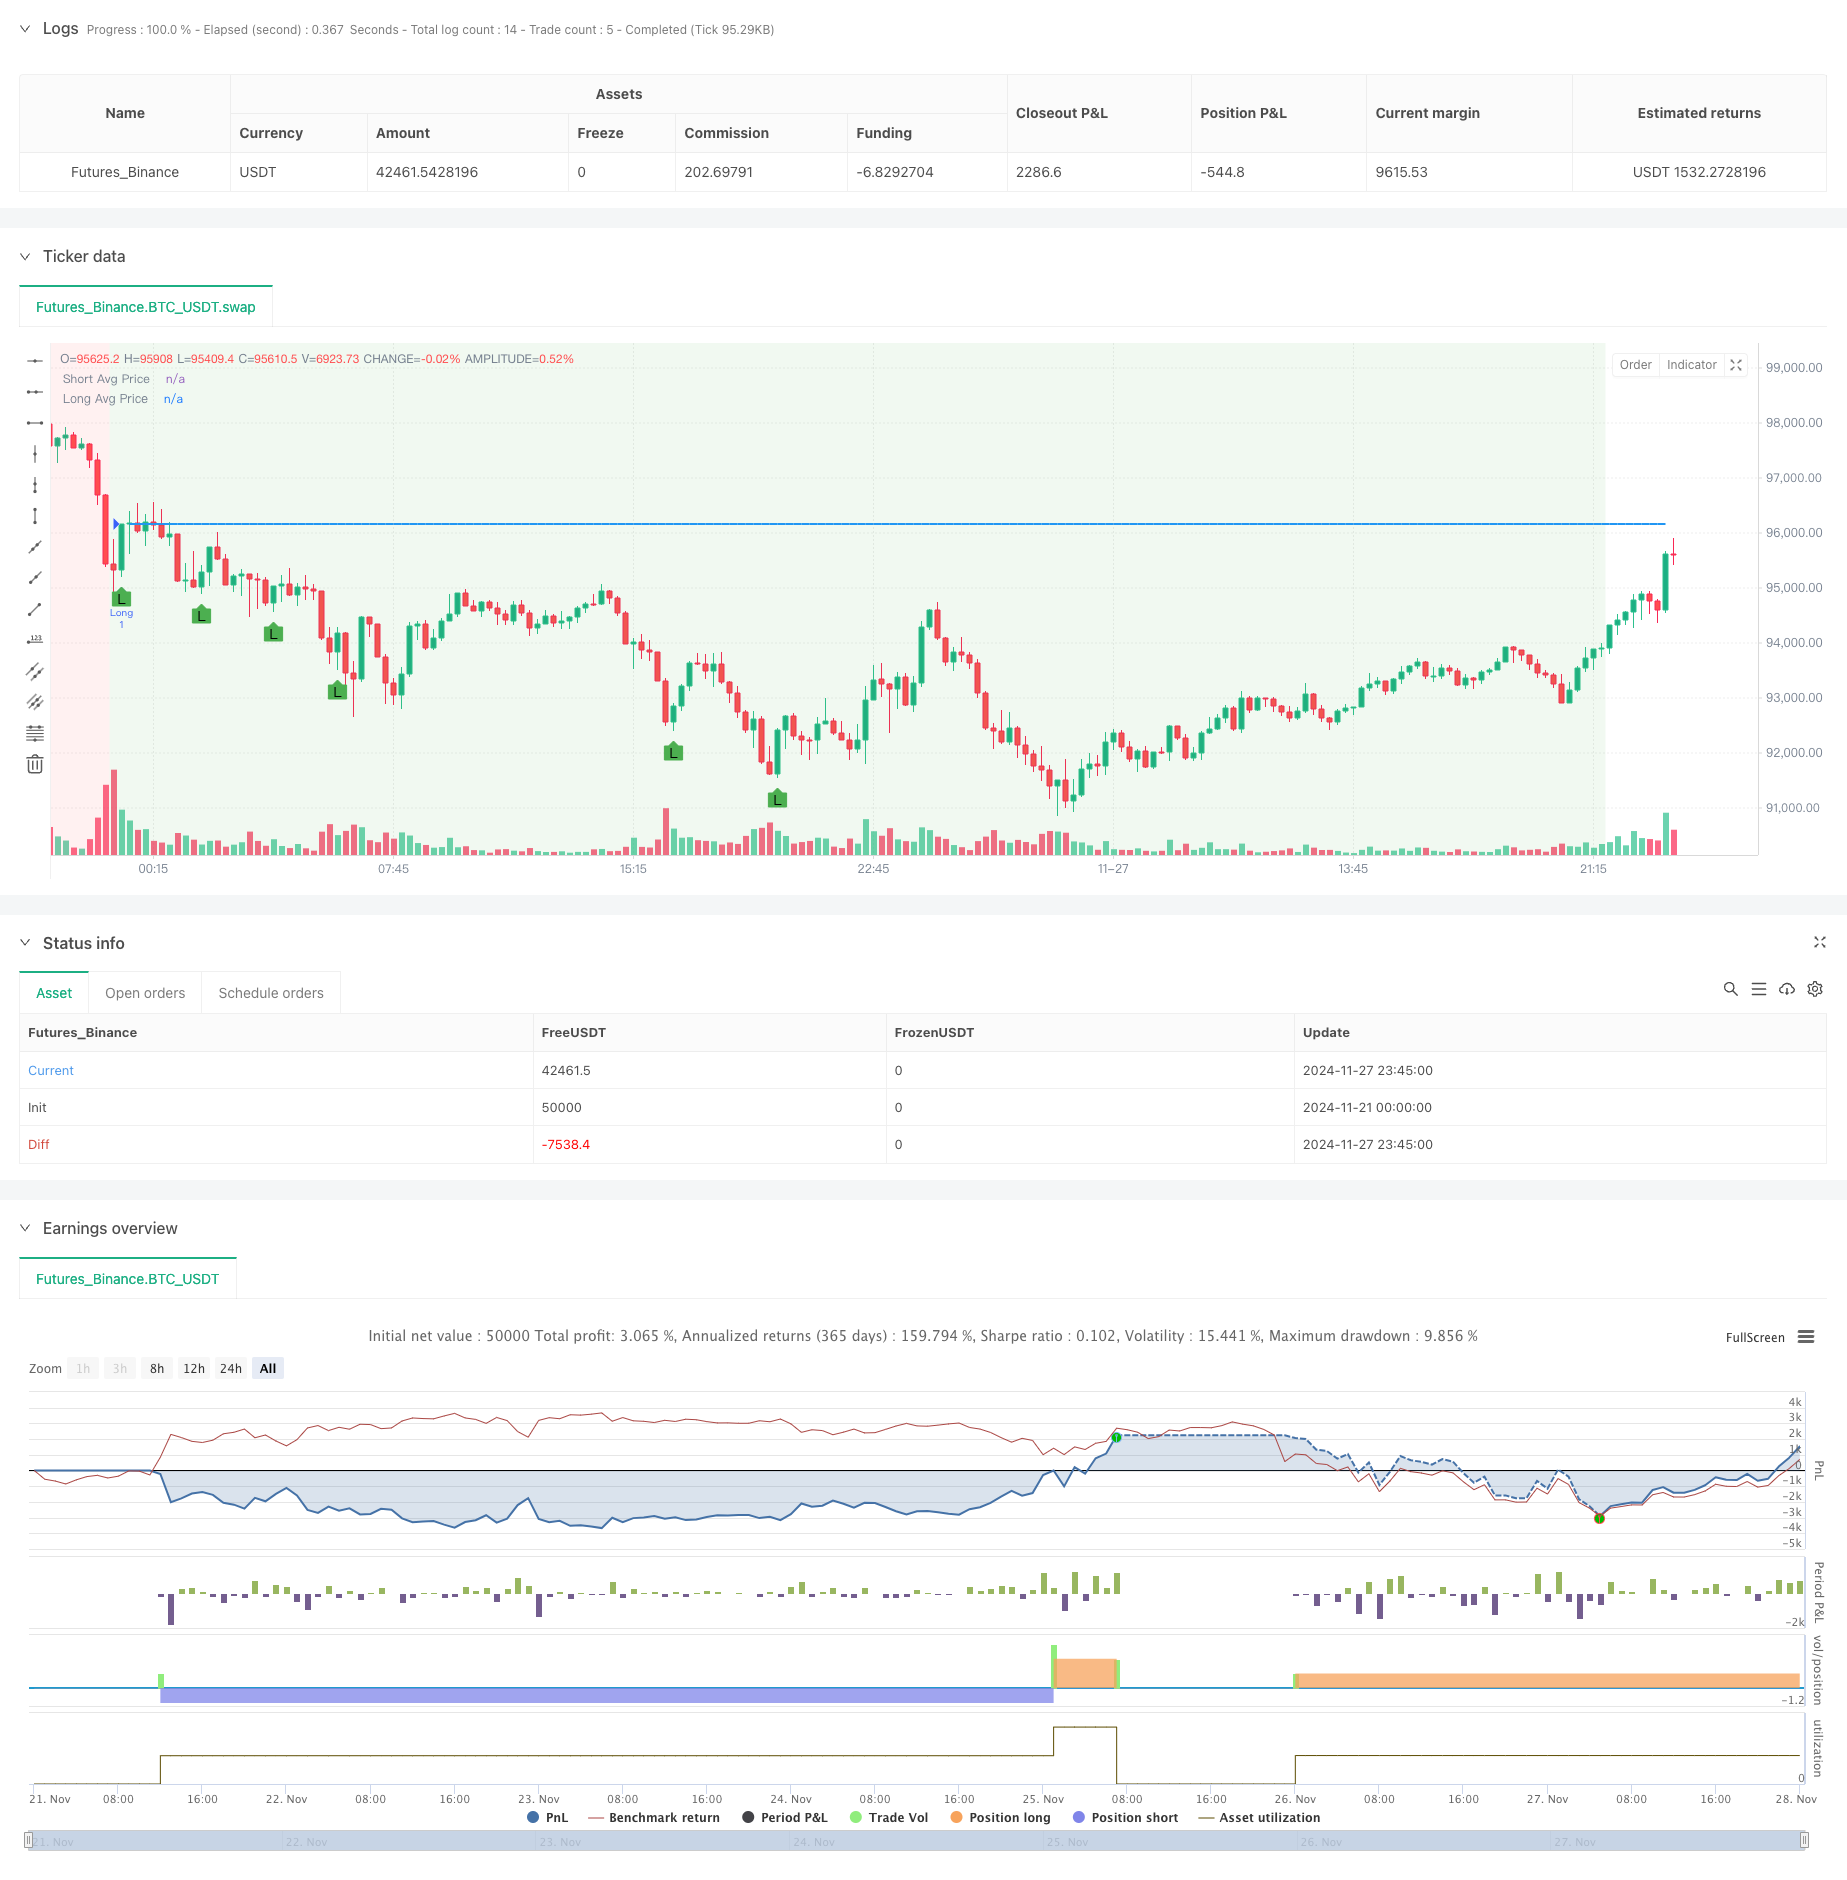
This is a momentum trading strategy based on RSI and EMA indicators, combining technical analysis across multiple timeframes. The strategy executes trades based on RSI overbought/oversold signals with EMA trend confirmation and employs dynamic position sizing. The core concept lies in combining short-term RSI (2-period) with medium-term RSI (14-period) signals, while using three different period EMAs (50/100/200) for trend direction confirmation.
Strategy Principles
The strategy employs a multi-layer validation mechanism for trading decisions. Long conditions require RSI14 below 31 and RSI2 crossing above 10, along with EMA50, EMA100, and EMA200 in bearish alignment. Short conditions require RSI14 above 69 and RSI2 crossing below 90, with EMAs in bullish alignment. The strategy includes an RSI-based take-profit mechanism, automatically closing positions when RSI reaches extreme values and price movement favors the position. A notable feature is the dynamic position sizing system based on account equity, calculating appropriate position sizes for each trade.
Strategy Advantages
- Comprehensive signal confirmation mechanism reduces false signal risks through multiple technical indicator validation
- Dynamic position sizing system automatically adjusts trading volume based on account size
- Multiple period RSI combined with EMA trend confirmation improves trading accuracy
- Clear take-profit mechanism ensures timely profit capture
- Excellent visualization features help traders understand market conditions
- Layered technical indicator combination better captures market momentum changes
Strategy Risks
- High leverage (20x) may lead to significant account volatility
- May generate frequent false breakout signals in ranging markets
- Position multiplication mechanism could amplify losses during consecutive losing trades
- Lack of stop-loss mechanism might result in substantial losses in extreme market conditions
- EMA trend judgment may lag during rapid market reversals
- RSI indicators might generate misleading signals under certain market conditions
Strategy Optimization Directions
- Introduce dynamic stop-loss mechanism based on ATR or volatility
- Optimize position management system with maximum position limits for risk control
- Add volatility filters to adjust trading parameters in high volatility environments
- Consider implementing time filters to avoid unfavorable trading periods
- Incorporate additional market state indicators, such as volume indicators
- Develop adaptive parameter system to dynamically adjust indicator parameters based on market conditions
Summary
This strategy combines momentum trading with trend following characteristics, enhancing trading reliability through multiple technical indicators. While certain risks exist, the suggested optimization directions can further improve strategy stability. The strategy’s main feature is the combination of short-term and medium-term technical indicators with dynamic position management, forming a complete trading system. Through proper risk management and parameter optimization, this strategy shows promise for stable performance in actual trading.
/*backtest
start: 2024-11-21 00:00:00
end: 2024-11-28 00:00:00
period: 15m
basePeriod: 15m
exchanges: [{"eid":"Futures_Binance","currency":"BTC_USDT"}]
*/

//@version=5
strategy("Custom RSI EMA Strategy", overlay=true, default_qty_type=strategy.fixed, default_qty_value=1)

// Definování vstupních podmínek
rsi_14 = ta.rsi(close, 14)
rsi_2 = ta.rsi(close, 2)
ema_50 = ta.ema(close, 50)
ema_100 = ta.ema(close, 100)
ema_200 = ta.ema(close, 200)

// Pákový efekt
leverage = 20

// Podmínky pro long pozici
longCondition = (rsi_14[1] < 31) and ta.crossover(rsi_2, 10) and (ema_50 < ema_100) and (ema_100 < ema_200)

// Podmínky pro short pozici
shortCondition = (rsi_14[1] > 69) and ta.crossunder(rsi_2, 90) and (ema_50 > ema_100) and (ema_100 > ema_200)

// Definování průměrné ceny pozice
var float long_avg_price = na
var float short_avg_price = na

// Sledujeme, zda se velikost pozice změnila
var float last_position_size = na

// Přerušení průměrné ceny pozice při změně pozice
if (last_position_size != strategy.position_size)
    long_avg_price := na
    short_avg_price := na

// Aktualizace průměrné ceny pozice
if (strategy.position_size > 0)
    long_avg_price := strategy.position_avg_price
    short_avg_price := na
else if (strategy.position_size < 0)
    short_avg_price := strategy.position_avg_price
    long_avg_price := na

// Uložení aktuální velikosti pozice pro příští bar
last_position_size := strategy.position_size

// Podmínky pro take profit
takeProfitLongCondition = (rsi_14 > 69) and (rsi_2 > 90) and (long_avg_price < close)
takeProfitShortCondition = (rsi_14 < 31) and (rsi_2 < 10) and (short_avg_price > close)

// Velikost pozice
new_position_size = strategy.position_size == 0 ? na : math.abs(strategy.position_size) * 2

// Úprava velikosti pozice s ohledem na pákový efekt
position_value = strategy.equity * leverage
trade_qty = position_value / close

// Vstup do long pozice s dvojnásobkem aktuální pozice nebo standardní velikostí při první pozici
if (longCondition)
    strategy.entry("Long", strategy.long, qty=new_position_size == na ? trade_qty : new_position_size)

// Vstup do short pozice s dvojnásobkem aktuální pozice nebo standardní velikostí při první pozici
if (shortCondition)
    strategy.entry("Short", strategy.short, qty=new_position_size == na ? trade_qty : new_position_size)

// Výstup z long pozice při splnění podmínek pro take profit
if (takeProfitLongCondition)
    strategy.close("Long")

// Výstup z short pozice při splnění podmínek pro take profit
if (takeProfitShortCondition)
    strategy.close("Short")

// Zvýraznění části grafu, kde platí podmínky pro long
highlightLongCondition = (ema_50 < ema_100) and (ema_100 < ema_200)
bgcolor(highlightLongCondition ? color.new(color.green, 90) : na)

// Zvýraznění části grafu, kde platí podmínky pro short
highlightShortCondition = (ema_50 > ema_100) and (ema_100 > ema_200)
bgcolor(highlightShortCondition ? color.new(color.red, 90) : na)

// Přidání bodů pozic do grafu
plotshape(series=longCondition, location=location.belowbar, color=color.green, style=shape.labelup, text="L")
plotshape(series=shortCondition, location=location.abovebar, color=color.red, style=shape.labeldown, text="S")

// Vykreslení průměrné ceny pozice pro long a short
plot(long_avg_price, title="Long Avg Price", color=color.blue, linewidth=2)
plot(short_avg_price, title="Short Avg Price", color=color.orange, linewidth=2)