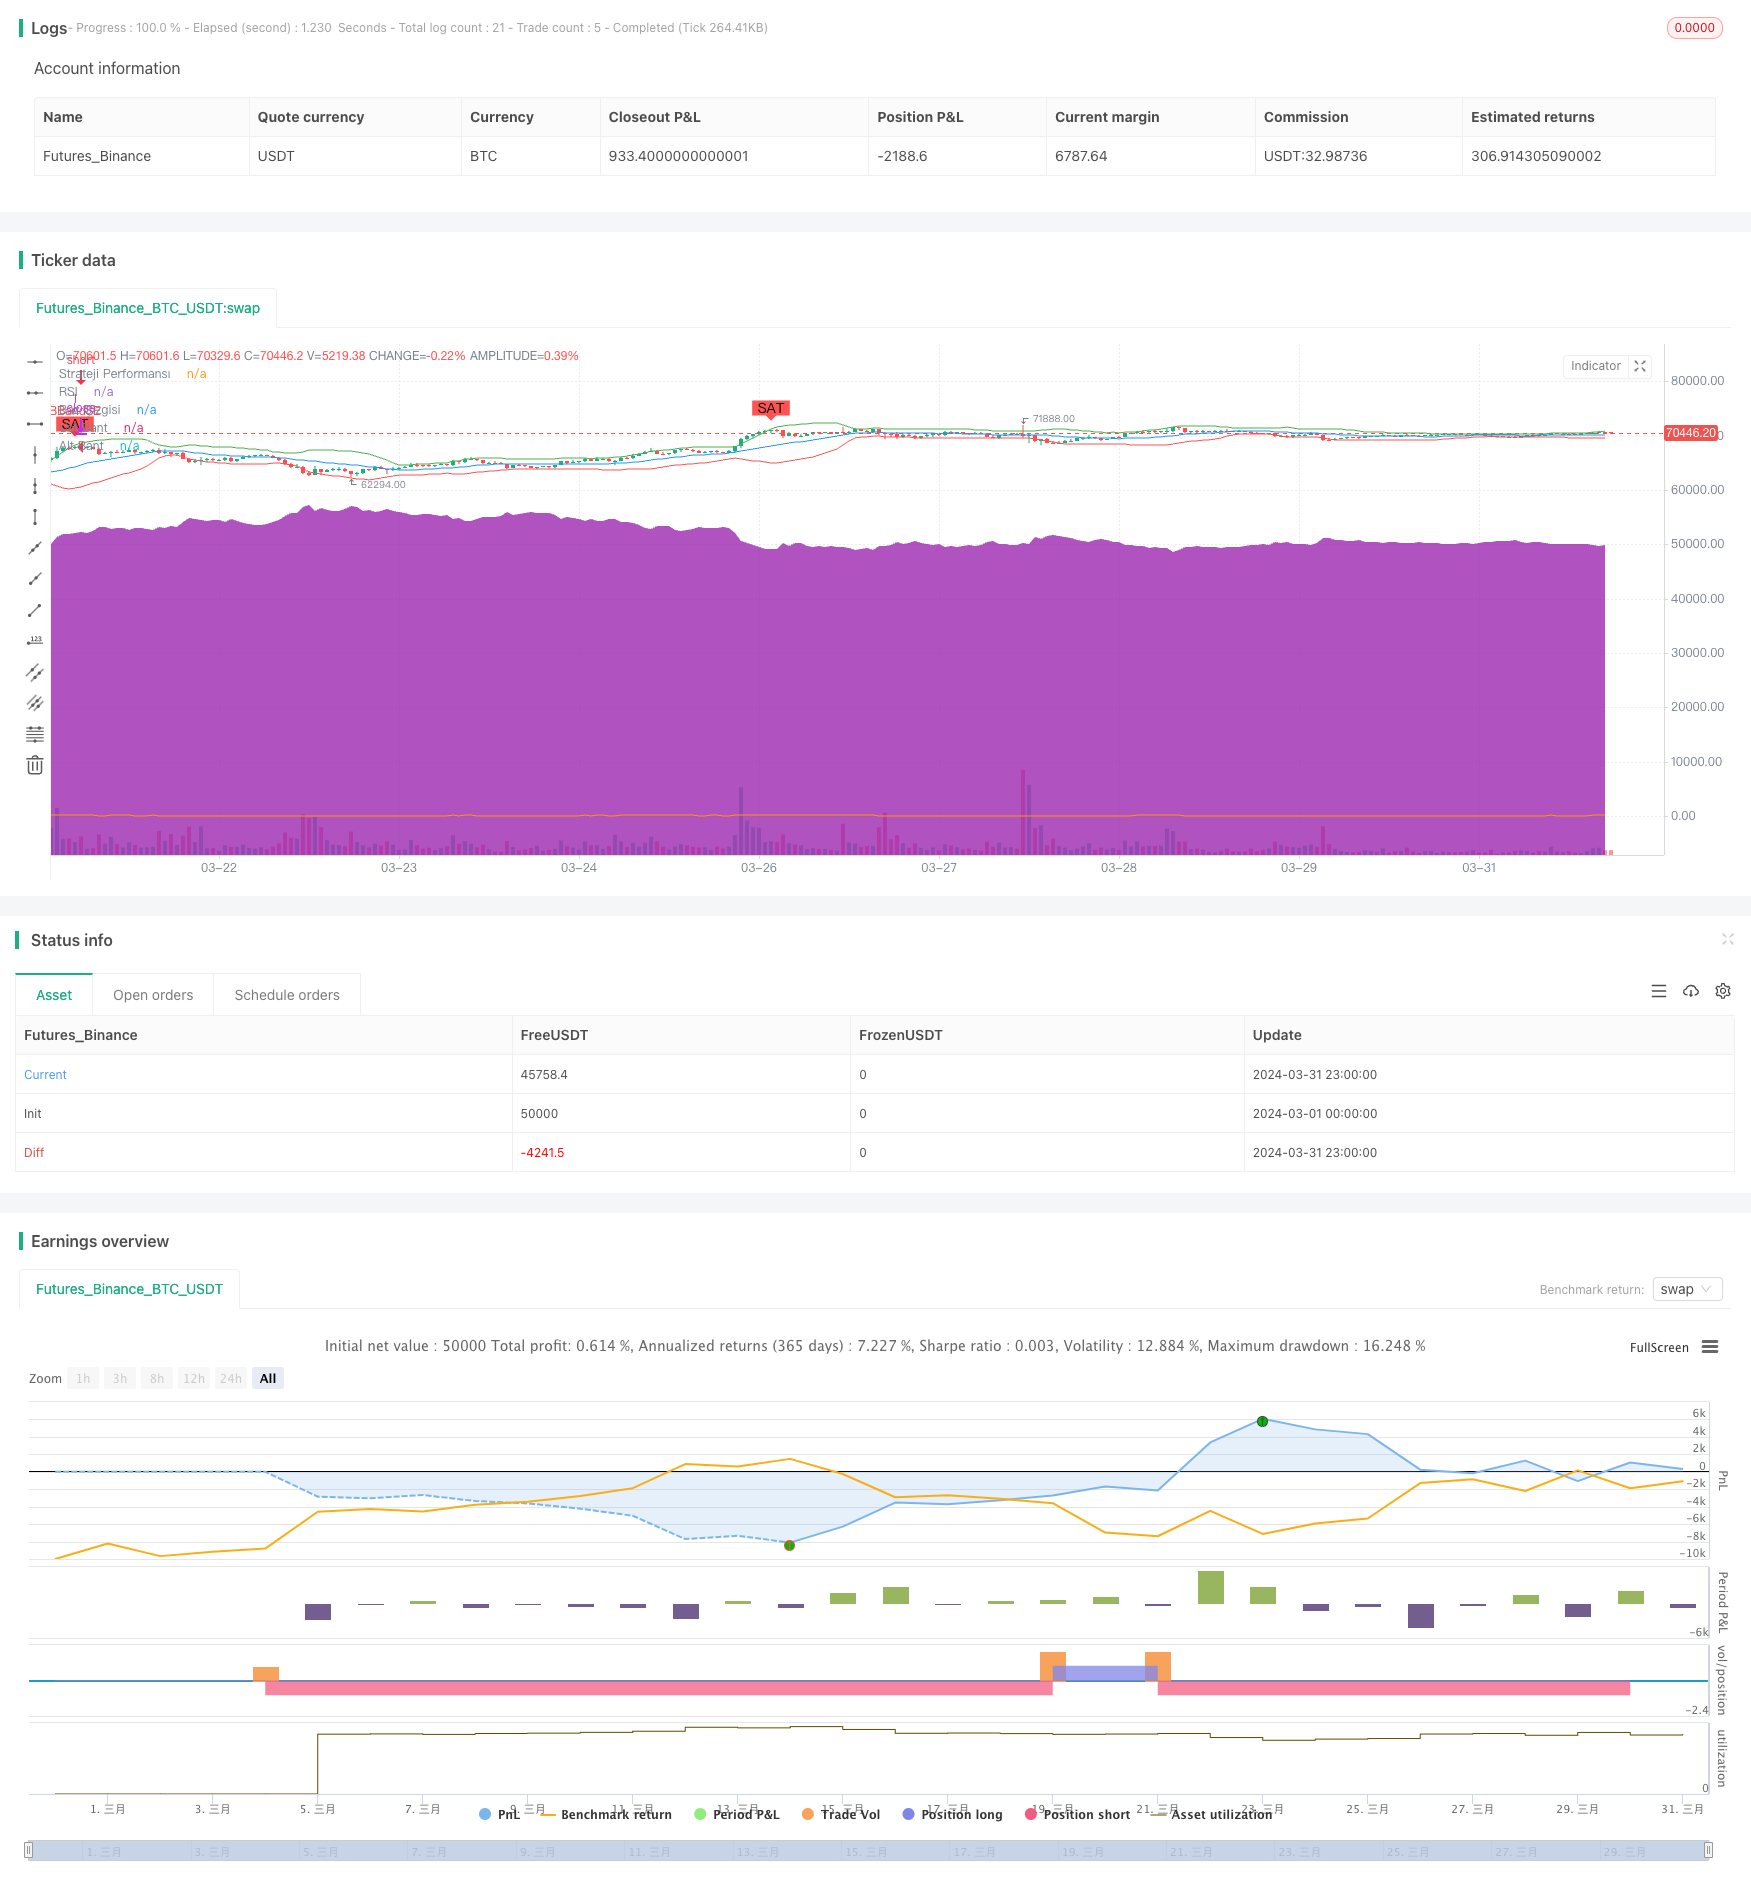
增强型布林带相对强弱指标交易策略
Author: ChaoZhang, Date: 2024-04-30 16:54:45Tags: EMARSI

####概述 该策略结合了布林带和相对强弱指标(RSI)两个技术指标,通过布林带捕捉价格的波动范围,并利用RSI指标确认价格的超买超卖状态,以此作为交易信号的判断依据。当价格突破布林带下轨且RSI低于30时,产生做多信号;当价格突破布林带上轨且RSI高于70时,产生做空信号。
####策略原理 1. 计算布林带上轨、中轨和下轨。中轨为收盘价的简单移动平均线,上下轨为中轨加减一定的标准差。
计算RSI指标。RSI用于衡量一段时间内价格的涨跌幅度,以此判断价格的超买超卖状态。
产生交易信号。当收盘价突破布林带下轨且RSI低于30时,产生做多信号;当收盘价突破布林带上轨且RSI高于70时,产生做空信号。
执行交易。根据交易信号设置限价单,突破布林带上轨做空,下轨做多。同时,取消之前方向的挂单。
####优势分析 1. 布林带能够很好地量化价格的波动范围,RSI指标能够很好地量化价格的超买超卖程度,二者结合能够比较可靠地预测价格的反转时机。
限价单的设置能够避免错误开仓或追高杀跌,止损单的设置能够控制风险。
取消之前方向挂单的设置可防止策略过于频繁交易。
####风险分析 1. 趋势性行情下可能会出现较大回撤。布林带和RSI指标更适合用于判断震荡市的反转点,对于趋势行情的把握能力较弱。
- 参数设置对策略表现影响较大。布林带的参数设置会影响到价格突破的频率,RSI指标的参数设置会影响到超买超卖信号的灵敏度,需要根据不同市场特点和交易周期进行优化。
####优化方向 1. 可以考虑增加趋势判断指标,如MAC 布林带和RSI指标结合趋势指标可进行多空仓位的自适应调整。D等,与
可以考虑使用动态参数优化的方法,根据价格的波动率、趋势强度等特征,自适应调整布林带和RSI指标的参数,提高策略的适应性。
可以在策略中加入资金管理和仓位管理模块,根据账户资金量、风险偏好、历史回撤等因素,动态调整每次交易的资金量和杠杆率。
####总结 该策略通过布林带和RSI指标的结合,可以比较有效地捕捉价格的超买超卖状态,并以此作为交易信号。但是,该策略在趋势性行情下表现可能欠佳,并且策略表现对参数设置较为敏感。未来可以考虑引入趋势判断、动态参数优化、资金管理等模块,以进一步提升策略的稳健性和盈利能力。
/*backtest
start: 2024-03-01 00:00:00
end: 2024-03-31 23:59:59
period: 1h
basePeriod: 15m
exchanges: [{"eid":"Futures_Binance","currency":"BTC_USDT"}]
*/

//@version=5
strategy("Geliştirilmiş Bollinger Bantları Stratejisi", overlay=true)
source = close
length = input.int(20, minval=1, title="Uzunluk")
mult = input.float(2.0, minval=0.001, maxval=50, title="Çarpan")
basis = ta.sma(source, length)
dev = mult * ta.stdev(source, length)
upper = basis + dev
lower = basis - dev
plot(basis, title="Baz Çizgisi", color=color.blue)
plot(upper, title="Üst Bant", color=color.green)
plot(lower, title="Alt Bant", color=color.red)

// RSI göstergesi ekleme
rsiLength = input.int(14, title="RSI Uzunluğu")
rsiSource = close
rsi = ta.rsi(rsiSource, rsiLength)
plot(rsi, title="RSI", color=color.orange)

// RSI ve Bollinger Bantları kombinasyonu ile alım/satım sinyalleri
buyEntry = ta.crossover(source, lower) and rsi < 30
sellEntry = ta.crossunder(source, upper) and rsi > 70
plotshape(series=buyEntry, title="Alım Sinyali", location=location.belowbar, color=color.green, style=shape.labelup, text="AL")
plotshape(series=sellEntry, title="Satım Sinyali", location=location.abovebar, color=color.red, style=shape.labeldown, text="SAT")

// Strateji giriş/çıkış noktaları
if (buyEntry)
	strategy.entry("BBandLE", strategy.long, stop=lower, oca_name="BollingerBands", comment="BBandLE")
else
	strategy.cancel(id="BBandLE")

if (sellEntry)
	strategy.entry("BBandSE", strategy.short, stop=upper, oca_name="BollingerBands", comment="BBandSE")
else
	strategy.cancel(id="BBandSE")

// Strateji performansını gösteren grafik
plot(strategy.equity, title="Strateji Performansı", color=color.purple, linewidth=2, style=plot.style_areabr)
- Low finder
- 动态均线趋势跟踪与相对强弱指标确认交易策略
- RSI与双EMA交叉信号量化策略
- EMA多头均线交叉策略
- 多周期RSI动量与三重EMA趋势跟踪复合策略
- 双均线RSI趋势发散策略:基于指数移动平均和相对强弱的趋势捕捉系统
- RSI与EMA结合的动态多周期量化交易策略
- crypto futures hourly scalping with ma & rsi - ogcheckers
- 均线交叉、相对强弱指标、成交量价格趋势、吞没形态策略
- 双指数移动平均线与相对强弱指数交叉策略
- 双均线RSI趋势反转交易策略 - 基于EMA和RSI的动量突破系统