概述
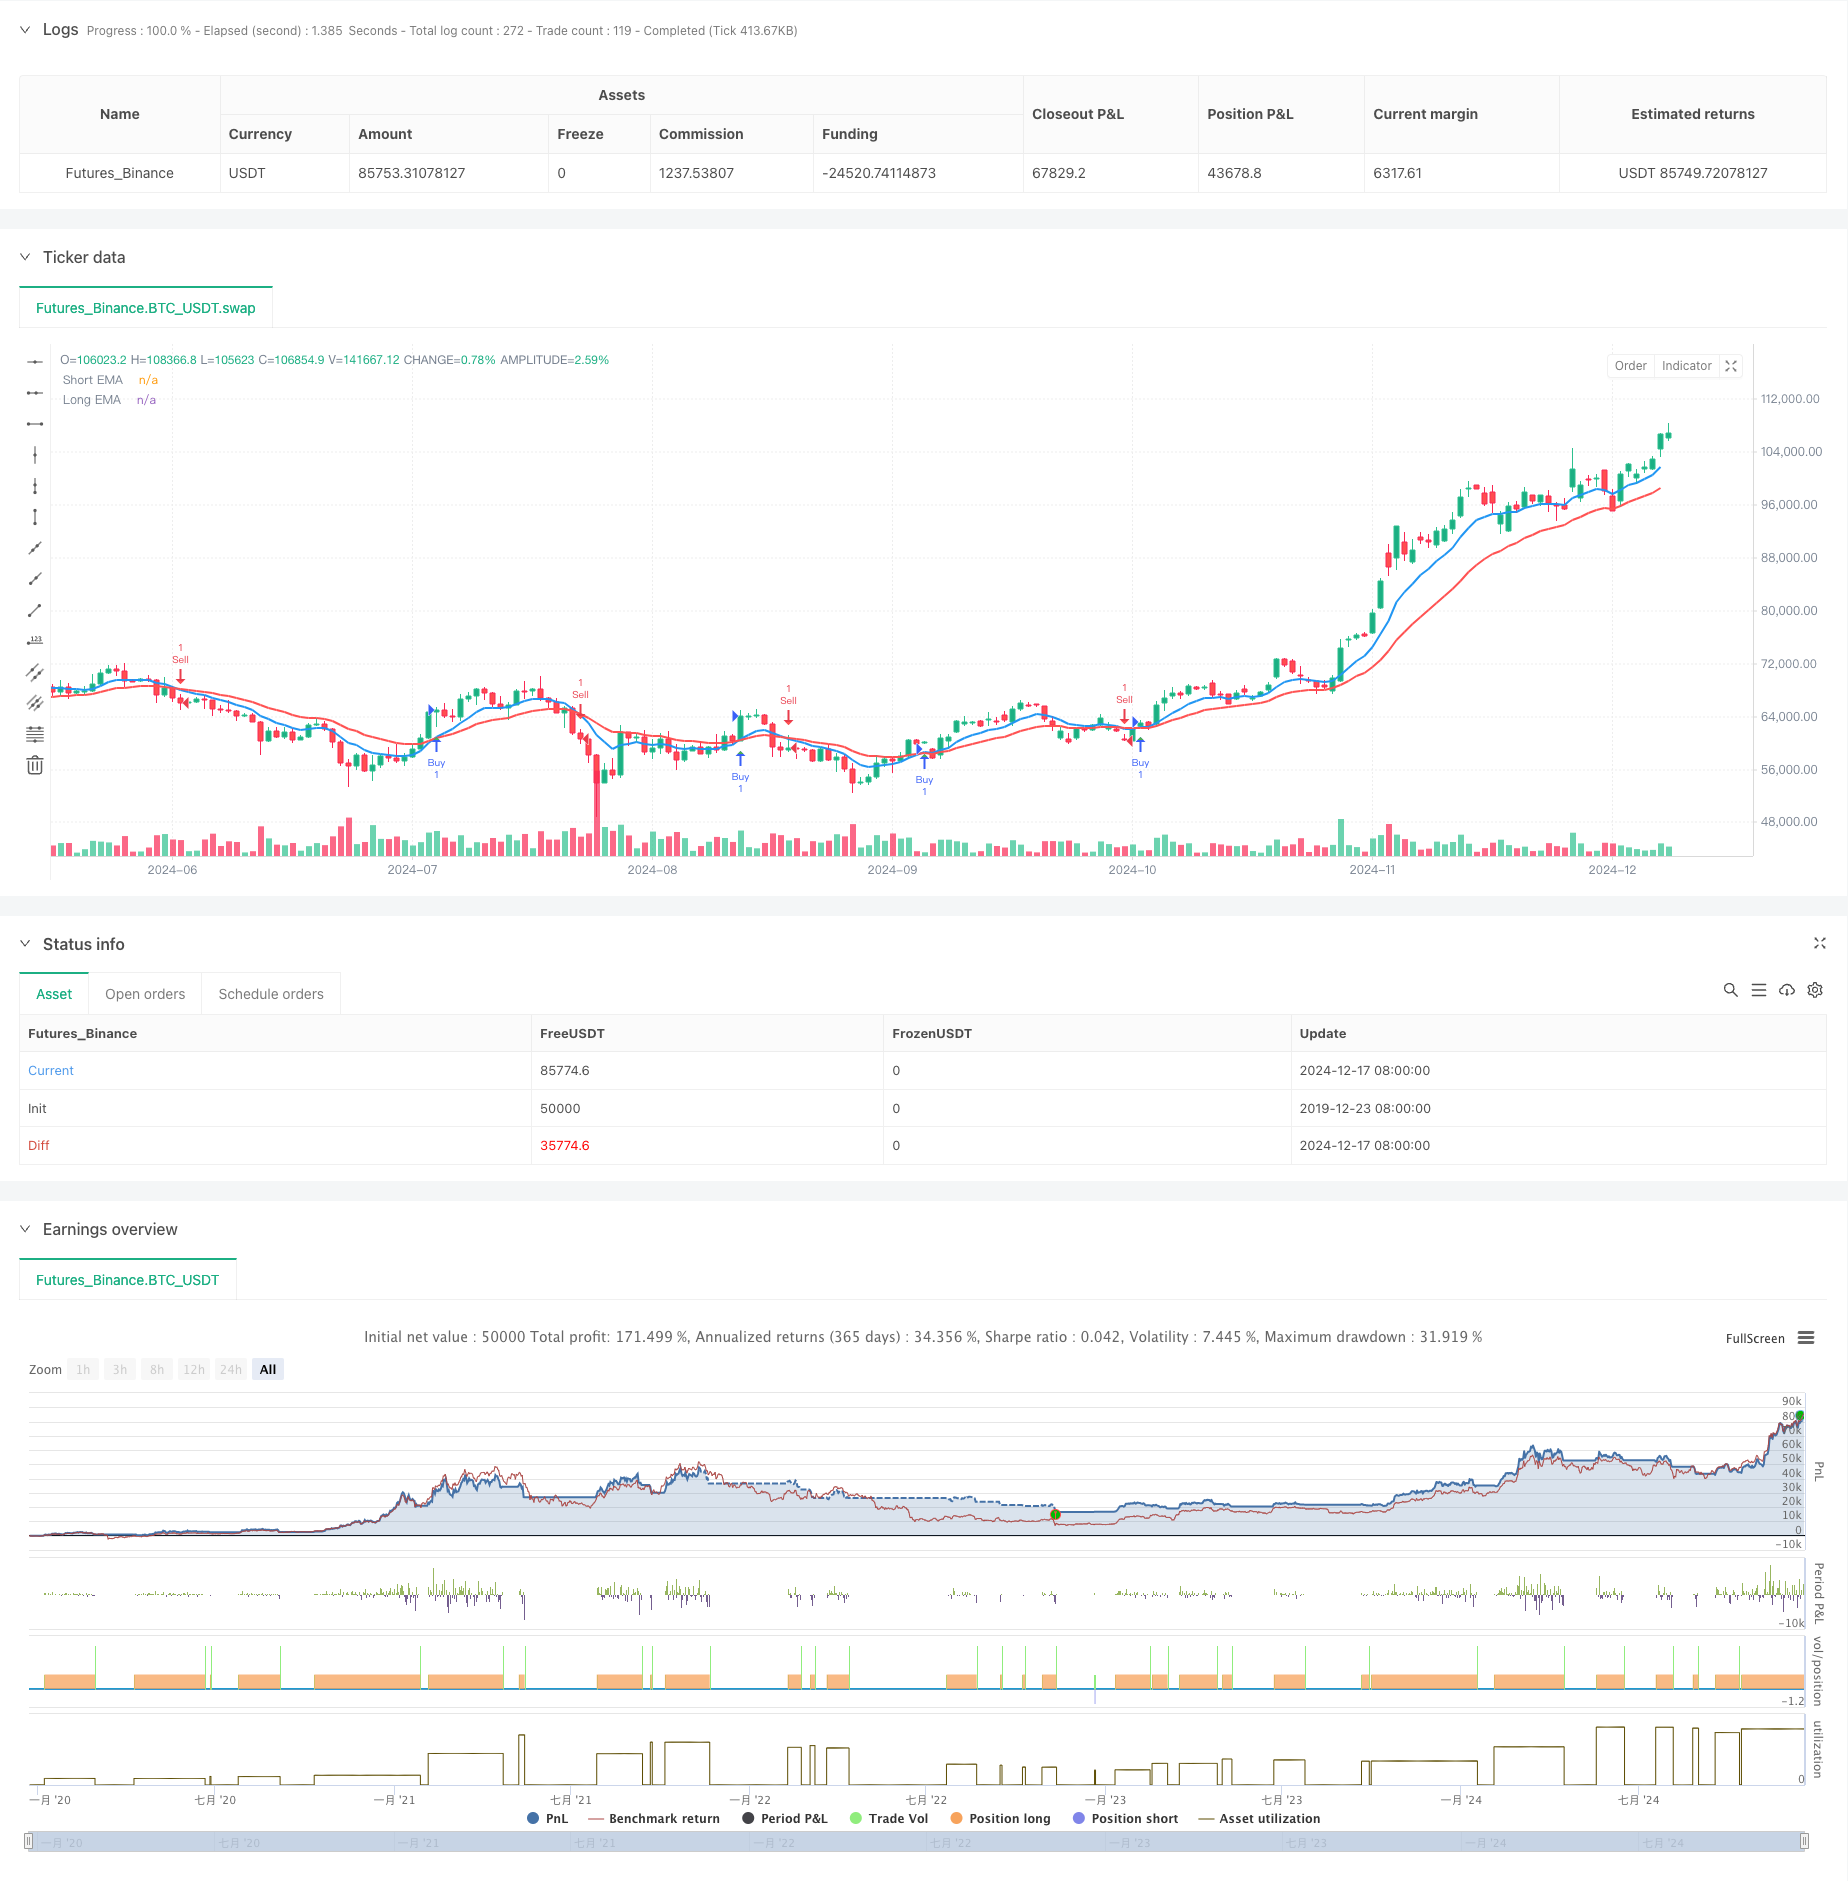
该策略是一个结合了双指数移动平均线(EMA)和相对强弱指数(RSI)的趋势跟踪交易系统。策略在5分钟时间框架上运行,通过短期与长期EMA的交叉以及RSI指标的配合来捕捉市场趋势,同时结合了固定百分比的止盈止损进行风险控制。
策略原理
策略主要基于以下核心组件: 1. 使用9周期和21周期的双EMA系统识别趋势方向 2. 通过14周期的RSI进行趋势确认 3. 当短期EMA向上穿越长期EMA且RSI大于50时,产生做多信号 4. 当短期EMA向下穿越长期EMA且RSI小于50时,产生做空信号 5. 设置1.5%的止盈和0.5%的止损来管理风险
策略优势
- 信号系统稳健:结合趋势指标(EMA)和动量指标(RSI)双重确认,能有效降低虚假信号
- 风险管理完善:采用固定比例的止盈止损,确保每笔交易的风险可控
- 交易逻辑清晰:入场和出场条件明确,易于理解和执行
- 适应性强:可通过参数优化适应不同市场环境
策略风险
- 震荡市场风险:在横盘震荡市场可能产生频繁的假突破信号
- 滑点风险:5分钟周期的高频交易可能面临较大滑点
- 固定止损风险:百分比固定止损可能在波动性较大时被轻易触发
- 趋势反转风险:在趋势突然反转时可能产生较大回撤
策略优化方向
- 动态止损优化:考虑引入ATR指标动态调整止损位置
- 市场环境过滤:添加波动率指标筛选适合的交易环境
- 仓位管理优化:基于波动性和风险度量实现动态仓位管理
- 交易时间优化:分析不同时间段的表现,优化交易时间窗口
总结
这是一个结合技术指标和风险管理的完整交易系统。策略通过EMA和RSI的配合有效识别趋势,并使用固定止盈止损控制风险。虽然存在一定的局限性,但通过建议的优化方向可以进一步提升策略的稳定性和盈利能力。策略适合追求稳健收益的交易者,特别是在趋势明显的市场环境中表现更佳。
策略源码
/*backtest
start: 2019-12-23 08:00:00
end: 2024-12-18 08:00:00
period: 1d
basePeriod: 1d
exchanges: [{"eid":"Futures_Binance","currency":"BTC_USDT"}]
*/

//@version=5
strategy("5-Minute EMA + RSI Strategy", overlay=true, shorttitle="EMA RSI")

// Inputs
ema_short_length = input.int(9, title="Short EMA Length", minval=1)
ema_long_length = input.int(21, title="Long EMA Length", minval=1)
rsi_length = input.int(14, title="RSI Length")
rsi_overbought = input.int(70, title="RSI Overbought Level")
rsi_oversold = input.int(30, title="RSI Oversold Level")

// Calculate EMAs
ema_short = ta.ema(close, ema_short_length)
ema_long = ta.ema(close, ema_long_length)

// Calculate RSI
rsi = ta.rsi(close, rsi_length)

// Plot EMAs
plot(ema_short, title="Short EMA", color=color.blue, linewidth=2)
plot(ema_long, title="Long EMA", color=color.red, linewidth=2)

// Conditions for Entries
long_condition = ta.crossover(ema_short, ema_long) and rsi > 50
short_condition = ta.crossunder(ema_short, ema_long) and rsi < 50

// Execute Trades
if (long_condition)
    strategy.entry("Buy", strategy.long)

if (short_condition)
    strategy.entry("Sell", strategy.short)

// Risk Management: Take Profit & Stop Loss
take_profit_perc = input.float(1.5, title="Take Profit %", step=0.1)  // 1.5% target
stop_loss_perc = input.float(0.5, title="Stop Loss %", step=0.1)      // 0.5% stop

strategy.exit("Take Profit/Stop Loss", "Buy",
              profit=take_profit_perc, loss=stop_loss_perc)
strategy.exit("Take Profit/Stop Loss", "Sell",
              profit=take_profit_perc, loss=stop_loss_perc)

// Add Visual Alerts
plotshape(long_condition, title="Buy Signal", location=location.belowbar, color=color.green, style=shape.triangleup, size=size.small)
plotshape(short_condition, title="Sell Signal", location=location.abovebar, color=color.red, style=shape.triangledown, size=size.small)
相关推荐