RSI与双EMA交叉信号量化策略
Author: ChaoZhang, Date: 2024-04-26 17:36:08Tags: RSIEMA

概述
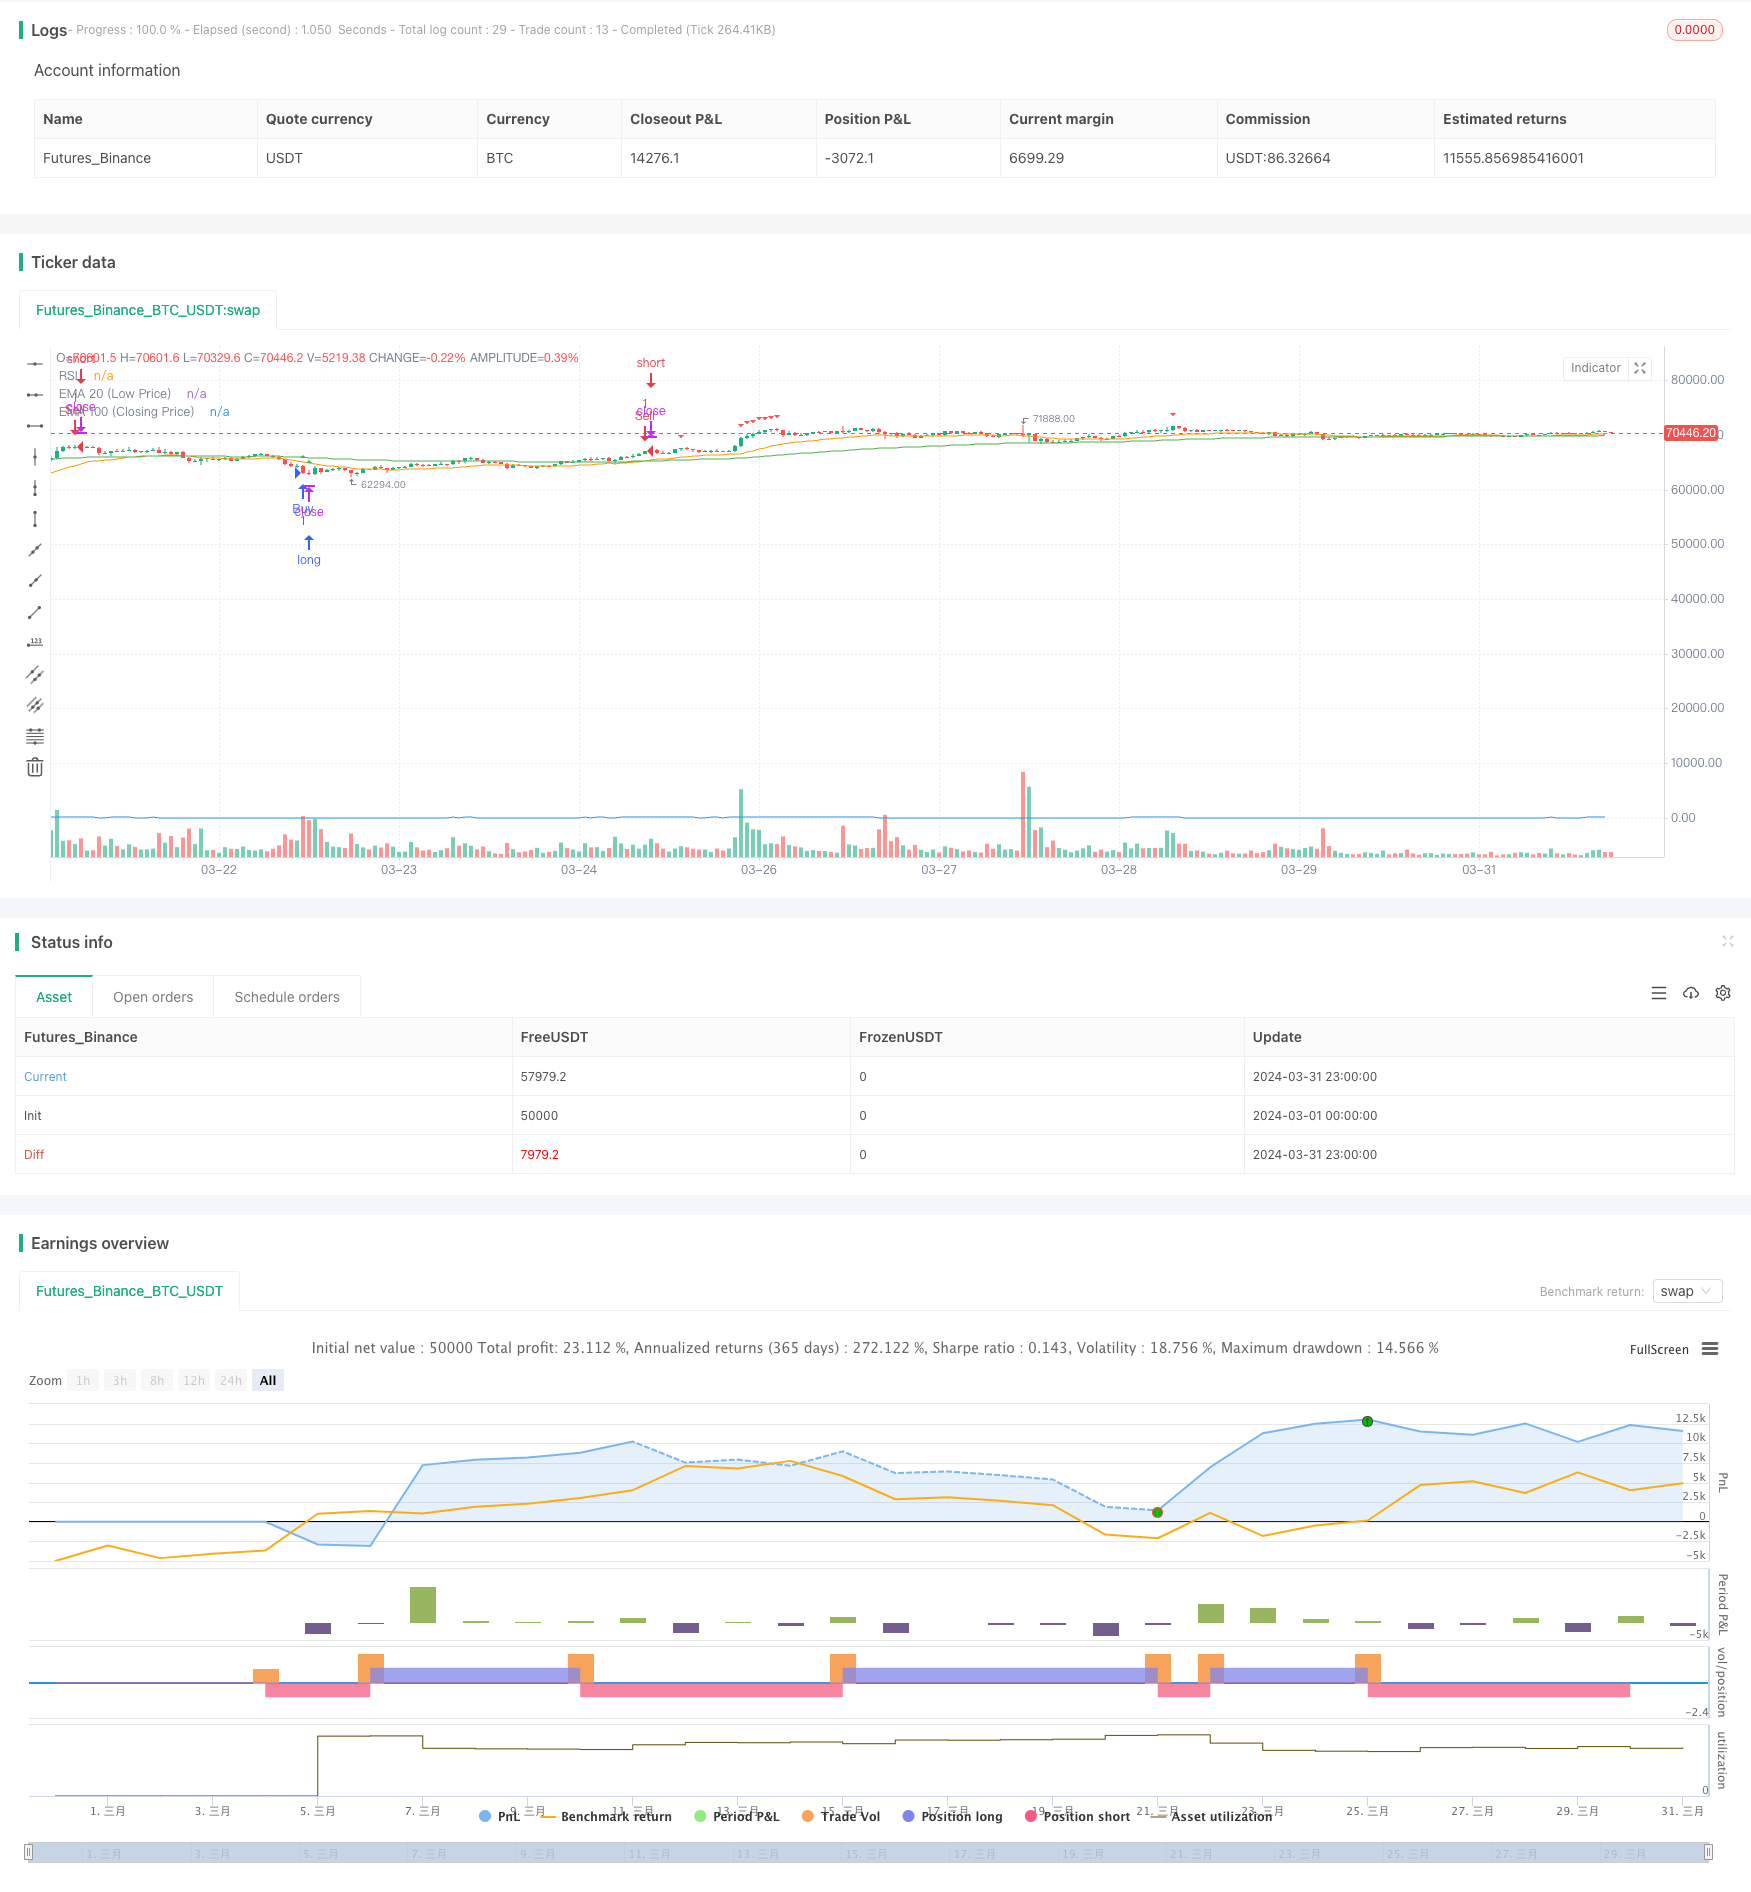
该策略基于RSI指标和两条EMA线的交叉信号来判断买卖点。当收盘价跌破EMA100和EMA20,且RSI值低于30时产生买入信号;当收盘价突破EMA100和EMA20,且RSI值高于70时产生卖出信号。该策略的主要思路是利用RSI指标判断超买超卖情况,同时结合EMA线的趋势判断,以此来捕捉市场的波动低点和高点,进行低吸高抛操作。
策略原理
- 计算RSI指标值,用于判断市场超买超卖情况。当RSI低于30视为超卖区间,高于70视为超买区间。
- 计算收盘价的EMA100和最低价的EMA20两条均线,作为趋势判断依据。
- 当收盘价跌破EMA100和EMA20,且RSI值低于30时,判断为超卖且趋势向下,产生买入信号。
- 当收盘价突破EMA100和EMA20,且RSI值高于70时,判断为超买且趋势向上,产生卖出信号。
- 买入信号触发时开仓做多,卖出信号触发时平仓。
优势分析
- 将RSI指标与EMA均线相结合,能较好地判断趋势拐点和超买超卖时机,减少错误信号。
- 参数可调,可根据不同标的和周期进行优化,具有一定的适应性和灵活性。
- 逻辑简单清晰,容易理解和实现,不需要太多的技术分析基础。
- 适合行情震荡时使用,能抓住波动的高低点,博取价差收益。
风险分析
- 对于单边趋势行情可能失效,趋势形成后会连续产生错误信号而屡屡被套。
- 参数固定,缺乏动态适应市场的能力,容易受到市场节奏变化的影响。
- 在震荡行情中频繁交易可能会产生较大的滑点和手续费,影响策略收益。
- 缺乏仓位管理和风险控制措施,回撤和最大亏损不可控。
优化方向
- 加入趋势判断条件,如MA穿越、DMI等,避免在单边趋势中过早入场而被套。
- 对RSI和EMA的参数进行优化,找到最适合标的和周期的参数组合,提高信号准确率。
- 引入仓位管理模型,如ATR仓位或凯利公式等,控制每次交易的资金比例,降低风险。
- 设置止损和止盈条件,如固定百分比止损或移动止损等,控制单次交易最大亏损和利润回吐。
- 结合其他辅助指标如MACD、布林带等,提高信号确认度,减少误判。
总结
RSI与双EMA交叉信号量化策略是一个简单实用的量化交易策略,通过将RSI指标与EMA均线相结合,能较好地捕捉震荡行情中的高低点,进行差价套利。但是该策略也存在一些局限性和风险,如趋势行情下失效,缺乏仓位管理和风控措施等。因此在实际应用中还需要根据市场特点和个人偏好进行适当的优化和改进,以提高策略的稳健性和盈利能力。该策略可以作为量化交易的入门策略来学习和使用,但需要谨慎对待,严格控制风险。
/*backtest
start: 2024-03-01 00:00:00
end: 2024-03-31 23:59:59
period: 1h
basePeriod: 15m
exchanges: [{"eid":"Futures_Binance","currency":"BTC_USDT"}]
*/

//@version=5
strategy("RSI-EMA100&20 Buy/Sell Signal", overlay=true)

// Input parameters
rsiLength = input.int(14, "RSI Length")
emaCloseLength = input.int(100, "EMA Length (Closing Price)")
emaLowLength = input.int(20, "EMA Length (Low Price)")
oversoldLevel = input.int(30, "Oversold Level")
overboughtLevel = input.int(70, "Overbought Level")

// Calculate RSI
rsi = ta.rsi(close, rsiLength)

// Calculate EMA of closing price
emaClose = ta.ema(close, emaCloseLength)

// Calculate EMA of low price
emaLow = ta.ema(low, emaLowLength)

// Determine overbought and oversold conditions
isOversold = rsi <= oversoldLevel
isOverbought = rsi >= overboughtLevel

// Plot RSI and its EMAs
plot(rsi, color=color.blue, title="RSI")
plot(emaClose, color=color.green, title="EMA 100 (Closing Price)")
plot(emaLow, color=color.orange, title="EMA 20 (Low Price)")

// Strategy entry condition: Closing price is below both EMAs and RSI is less than or equal to oversold level
buySignal = close < emaClose and close < emaLow and isOversold

// Plot buy signals
plotshape(series=buySignal, style=shape.triangleup, location=location.abovebar, color=color.green, size=size.small)

// Strategy entry
if (buySignal)
    strategy.entry("Buy", strategy.long)

// Strategy exit condition: Price crosses above both EMAs and RSI is greater than or equal to overbought level
sellSignal = close > emaClose and close > emaLow and isOverbought

// Plot sell signals
plotshape(series=sellSignal, style=shape.triangledown, location=location.abovebar, color=color.red, size=size.small)

// Strategy exit
if (sellSignal)
    strategy.entry("Sell", strategy.short)

// Plot sell signals
plotshape(series=sellSignal, style=shape.triangledown, location=location.abovebar, color=color.red, size=size.small)

// Strategy exit
if (sellSignal)
    strategy.entry("Sell", strategy.short)
相关内容
- Low finder
- 多重指标趋势追踪策略
- 动态均线趋势跟踪与相对强弱指标确认交易策略
- EMA多头均线交叉策略
- 多周期RSI动量与三重EMA趋势跟踪复合策略
- 双指数移动平均线与相对强弱指数交叉策略
- 双均线RSI趋势反转交易策略 - 基于EMA和RSI的动量突破系统
- RSI与EMA结合的动态多周期量化交易策略
- crypto futures hourly scalping with ma & rsi - ogcheckers
- 均线交叉、相对强弱指标、成交量价格趋势、吞没形态策略
- 双均线RSI趋势发散策略:基于指数移动平均和相对强弱的趋势捕捉系统
更多内容
- 挤压回测变形金刚v2.0
- 斐波那契趋势反转策略
- HTF 锯齿形路径策略
- 基于WaveTrend指标的趋势追踪策略
- CCI、DMI和MACD混合多空策略
- AlphaTradingBot 交易策略
- 维加斯超级趋势增强策略
- 基于修正Hull移动平均与一目均衡的量化交易策略
- RSI趋势反转策略
- 随机交叉指标动量交易策略
- 艾略特波浪理论4-9脉冲波自动检测交易策略
- 随机震荡指标与均线交叉策略结合止损与随机震荡过滤器
- 日内可扩展波动率交易策略
- KRK aDa 随机慢速均值回归策略与人工智能增强
- 基于支点和斜率的实时趋势线交易
- EMA23/EMA50双均线交叉量化交易策略
- 横线突破捕捉趋势策略
- 移动平均线交叉多层获利策略
- MACD金叉死叉策略
- MACD-V和斐波那契多时间框架动态止盈策略