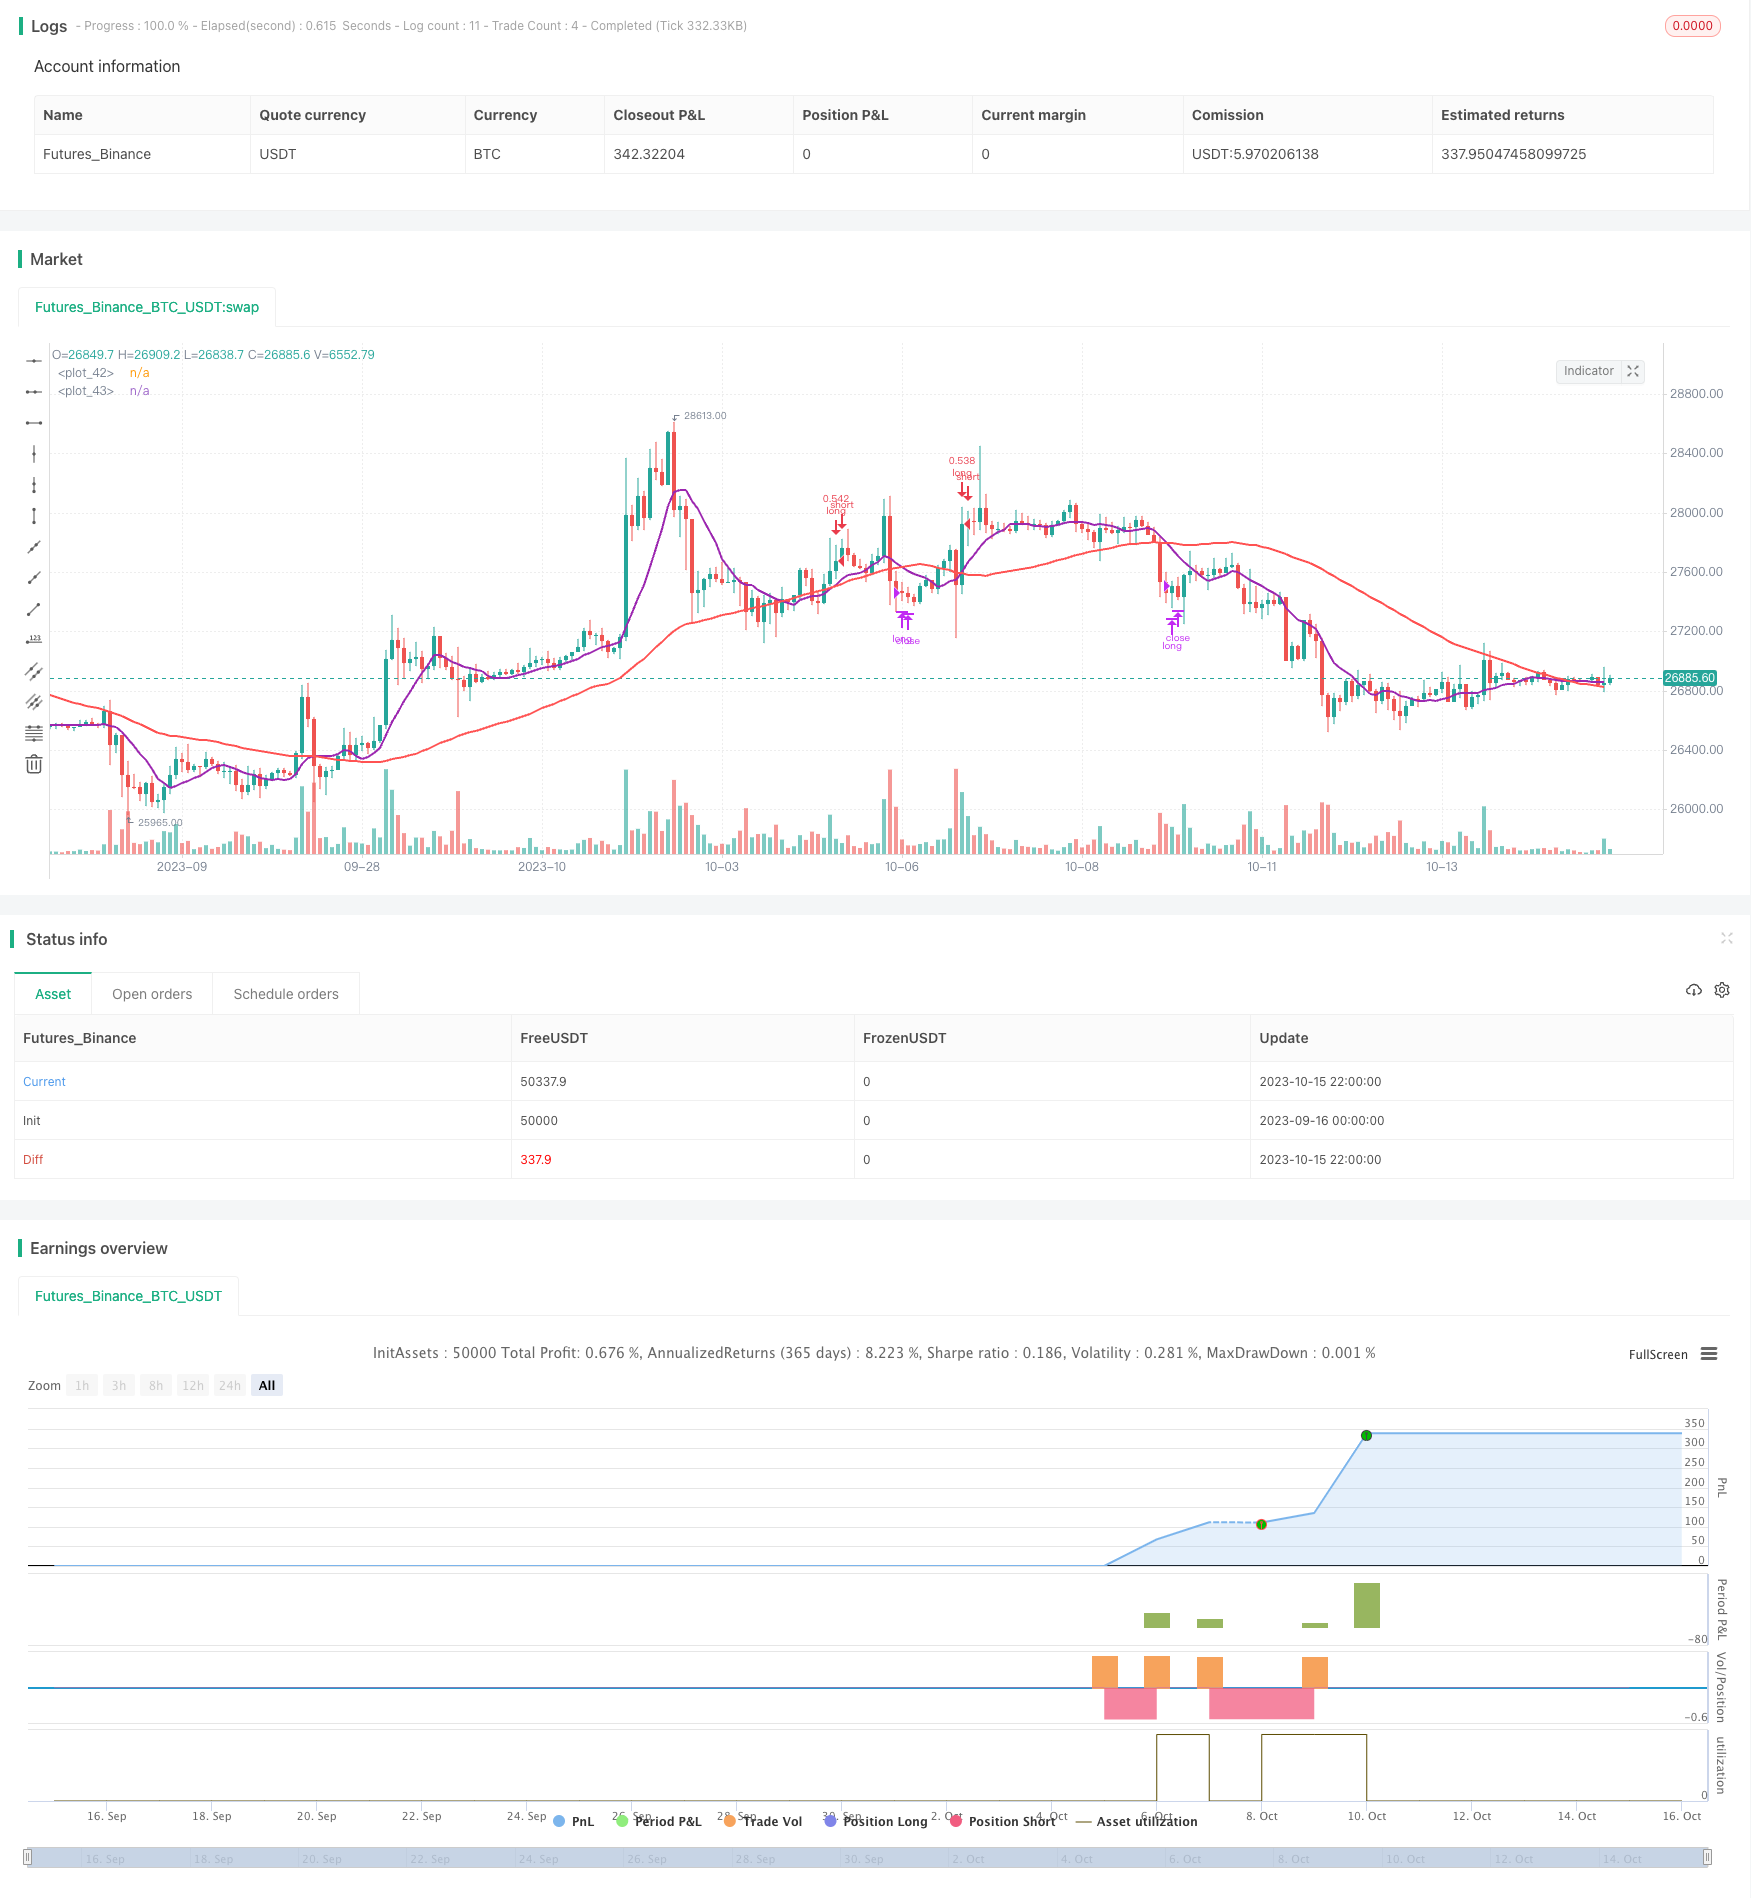
Tendencia de la estrategia de cruce de media móvil maximizada
El autor:¿ Qué pasa?, Fecha: 2023-10-17 13:05:29Las etiquetas:

Resumen general
Esta estrategia utiliza el cruce de dos promedios móviles con períodos diferentes para generar señales comerciales. Pertenece a las estrategias de seguimiento de tendencias. La estrategia captura oportunidades de tendencia mediante el uso de señales cuando un período más corto de MA cruza un período más largo de MA.
Estrategia lógica
La estrategia utiliza un MA a corto plazo de 9 períodos (SMA) y un MA a largo plazo de 50 períodos (LMA). Cuando el SMA cruza por encima del LMA, se genera una señal de compra. Cuando el SMA cruza por debajo del LMA, se genera una señal de venta.
La estrategia también incorpora el indicador RSI para medir la fuerza de la tendencia. Las señales de negociación solo se generan cuando RSI está por encima de un umbral (default 55). Esto evita señales incorrectas cuando RSI está en zonas de sobrecompra.
La estrategia opera el 30% del capital total cada vez, con una sola posición abierta a la vez.
Análisis de ventajas
- Captura las oportunidades de tendencia con eficacia utilizando las señales de tendencia cruzada de MA.
- Incorporar el RSI evita señales incorrectas cuando la tendencia se detiene.
- Los parámetros por defecto se optimizan y producen rendimientos constantes en varios mercados.
- Una gestión razonable del capital evita el tamaño excesivo de las posiciones.
Análisis de riesgos
- Es propenso a los golpes y a las señales incorrectas durante los mercados de rango sin tendencia.
- No hay ganancias sin una tendencia significativa como una estrategia de tendencia.
- Comercio excesivo y comisiones si los parámetros no se ajustan correctamente.
- La falta de stop loss expone la estrategia al riesgo de eventos.
Los riesgos pueden reducirse mediante la optimización de parámetros, el uso de otros indicadores, una estricta gestión del capital y un stop loss.
Oportunidades de mejora
- Prueba diferentes combinaciones de MA para encontrar los parámetros óptimos.
- Incorpore otros indicadores como el MACD para confirmar la tendencia.
- Implementar un stop loss dinámico para controlar las pérdidas por operación.
- Ajustar el tamaño de las posiciones en función de los diferentes mercados.
- Utilice indicadores de volumen para medir la fuerza de la tendencia.
Conclusión
La estrategia captura oportunidades de tendencia utilizando un sistema de cruce de MA simple. Los parámetros predeterminados se optimizan con rendimientos constantes, adecuados para el comercio algorítmico. Se pueden hacer mejoras adicionales agregando otros indicadores, optimizando parámetros e implementando stop loss. En general, es una estrategia efectiva de seguimiento de tendencias para los mercados utilizando señales de cruce.
/*backtest
start: 2023-09-16 00:00:00
end: 2023-10-16 00:00:00
period: 2h
basePeriod: 15m
exchanges: [{"eid":"Futures_Binance","currency":"BTC_USDT"}]
*/

// This source code is subject to the terms of the Mozilla Public License 2.0 at https://mozilla.org/MPL/2.0/
// © relevantLeader16058

//@version=4
strategy(shorttitle='Maximized Moving Average Crossing ',title='Maximized Moving Average Crossing (by Coinrule)', overlay=true, initial_capital=1000,  default_qty_type = strategy.percent_of_equity, default_qty_value = 30, commission_type=strategy.commission.percent, commission_value=0.1)

//Backtest dates
fromMonth = input(defval = 1,    title = "From Month",      type = input.integer, minval = 1, maxval = 12)
fromDay   = input(defval = 1,    title = "From Day",        type = input.integer, minval = 1, maxval = 31)
fromYear  = input(defval = 2020, title = "From Year",       type = input.integer, minval = 1970)
thruMonth = input(defval = 1,    title = "Thru Month",      type = input.integer, minval = 1, maxval = 12)
thruDay   = input(defval = 1,    title = "Thru Day",        type = input.integer, minval = 1, maxval = 31)
thruYear  = input(defval = 2112, title = "Thru Year",       type = input.integer, minval = 1970)

showDate  = input(defval = true, title = "Show Date Range", type = input.bool)

start     = timestamp(fromYear, fromMonth, fromDay, 00, 00)        // backtest start window
finish    = timestamp(thruYear, thruMonth, thruDay, 23, 59)        // backtest finish window
window()  => time >= start and time <= finish ? true : false       // create function "within window of time"

//MA inputs and calculations
inlong=input(50, title='MA long period')
inshort=input(9, title='MA short period')

MAlong = sma(close, inlong)
MAshort= sma(close, inshort)

// RSI inputs and calculations
lengthRSI = (14)

RSI = rsi(close, lengthRSI)
RSI_Signal = input(55, title = 'RSI Trigger', minval=1)

//Entry and Exit
bullish = crossover(MAshort, MAlong)
bearish = crossunder(MAshort, MAlong)

strategy.entry(id="long", long = true, when = bullish and RSI > RSI_Signal and window())
strategy.close(id="long", when = bearish and window())


plot(MAshort, color=color.purple, linewidth=2)
plot(MAlong, color=color.red, linewidth=2)
- STC MA ATR Estrategia de negociación de tendencias integrada
- Estrategia de tendencia alcista basada en el RSI estocástico con reglas especiales para sesgos alcistas fuertes
- Tendencia a corto y medio plazo siguiendo una estrategia basada en indicadores de SMA
- Tendencia del oro/plata de 30 millones de dólares tras la estrategia de ruptura
- Estrategia de seguimiento de tendencias adaptativas para detener pérdidas
- Estrategia bajista a corto plazo basada en los indicadores de cruce de la EMA y de potencia bajista
- Estrategia de negociación cruzada con dos EMA
- Estrategia de cruce de dos medias móviles
- Williams 9 días estrategia de escape
- Estrategia de tendencia de las calificaciones de media móvil múltiple
- Tendencia de la estrategia de compra y venta
- La estrategia de Brin para detener el golpe y el doblete de Martinegall
- El RSI y la estrategia de negociación de la media móvil cruzada de varios plazos
- Estrategia combinada de 123 inversión y RSI suavizado
- Estrategia de negociación cruzada con dos EMA
- Estrategia dinámica de línea central de pérdida de parada de ATR
- Estrategia de interconexión de la EMA doble
- Estrategia de negociación para el día de la nube de Ichimoku
- Sistema dinámico de negociación de apalancamiento ajustado al riesgo
- Estrategia de impulso del MACD