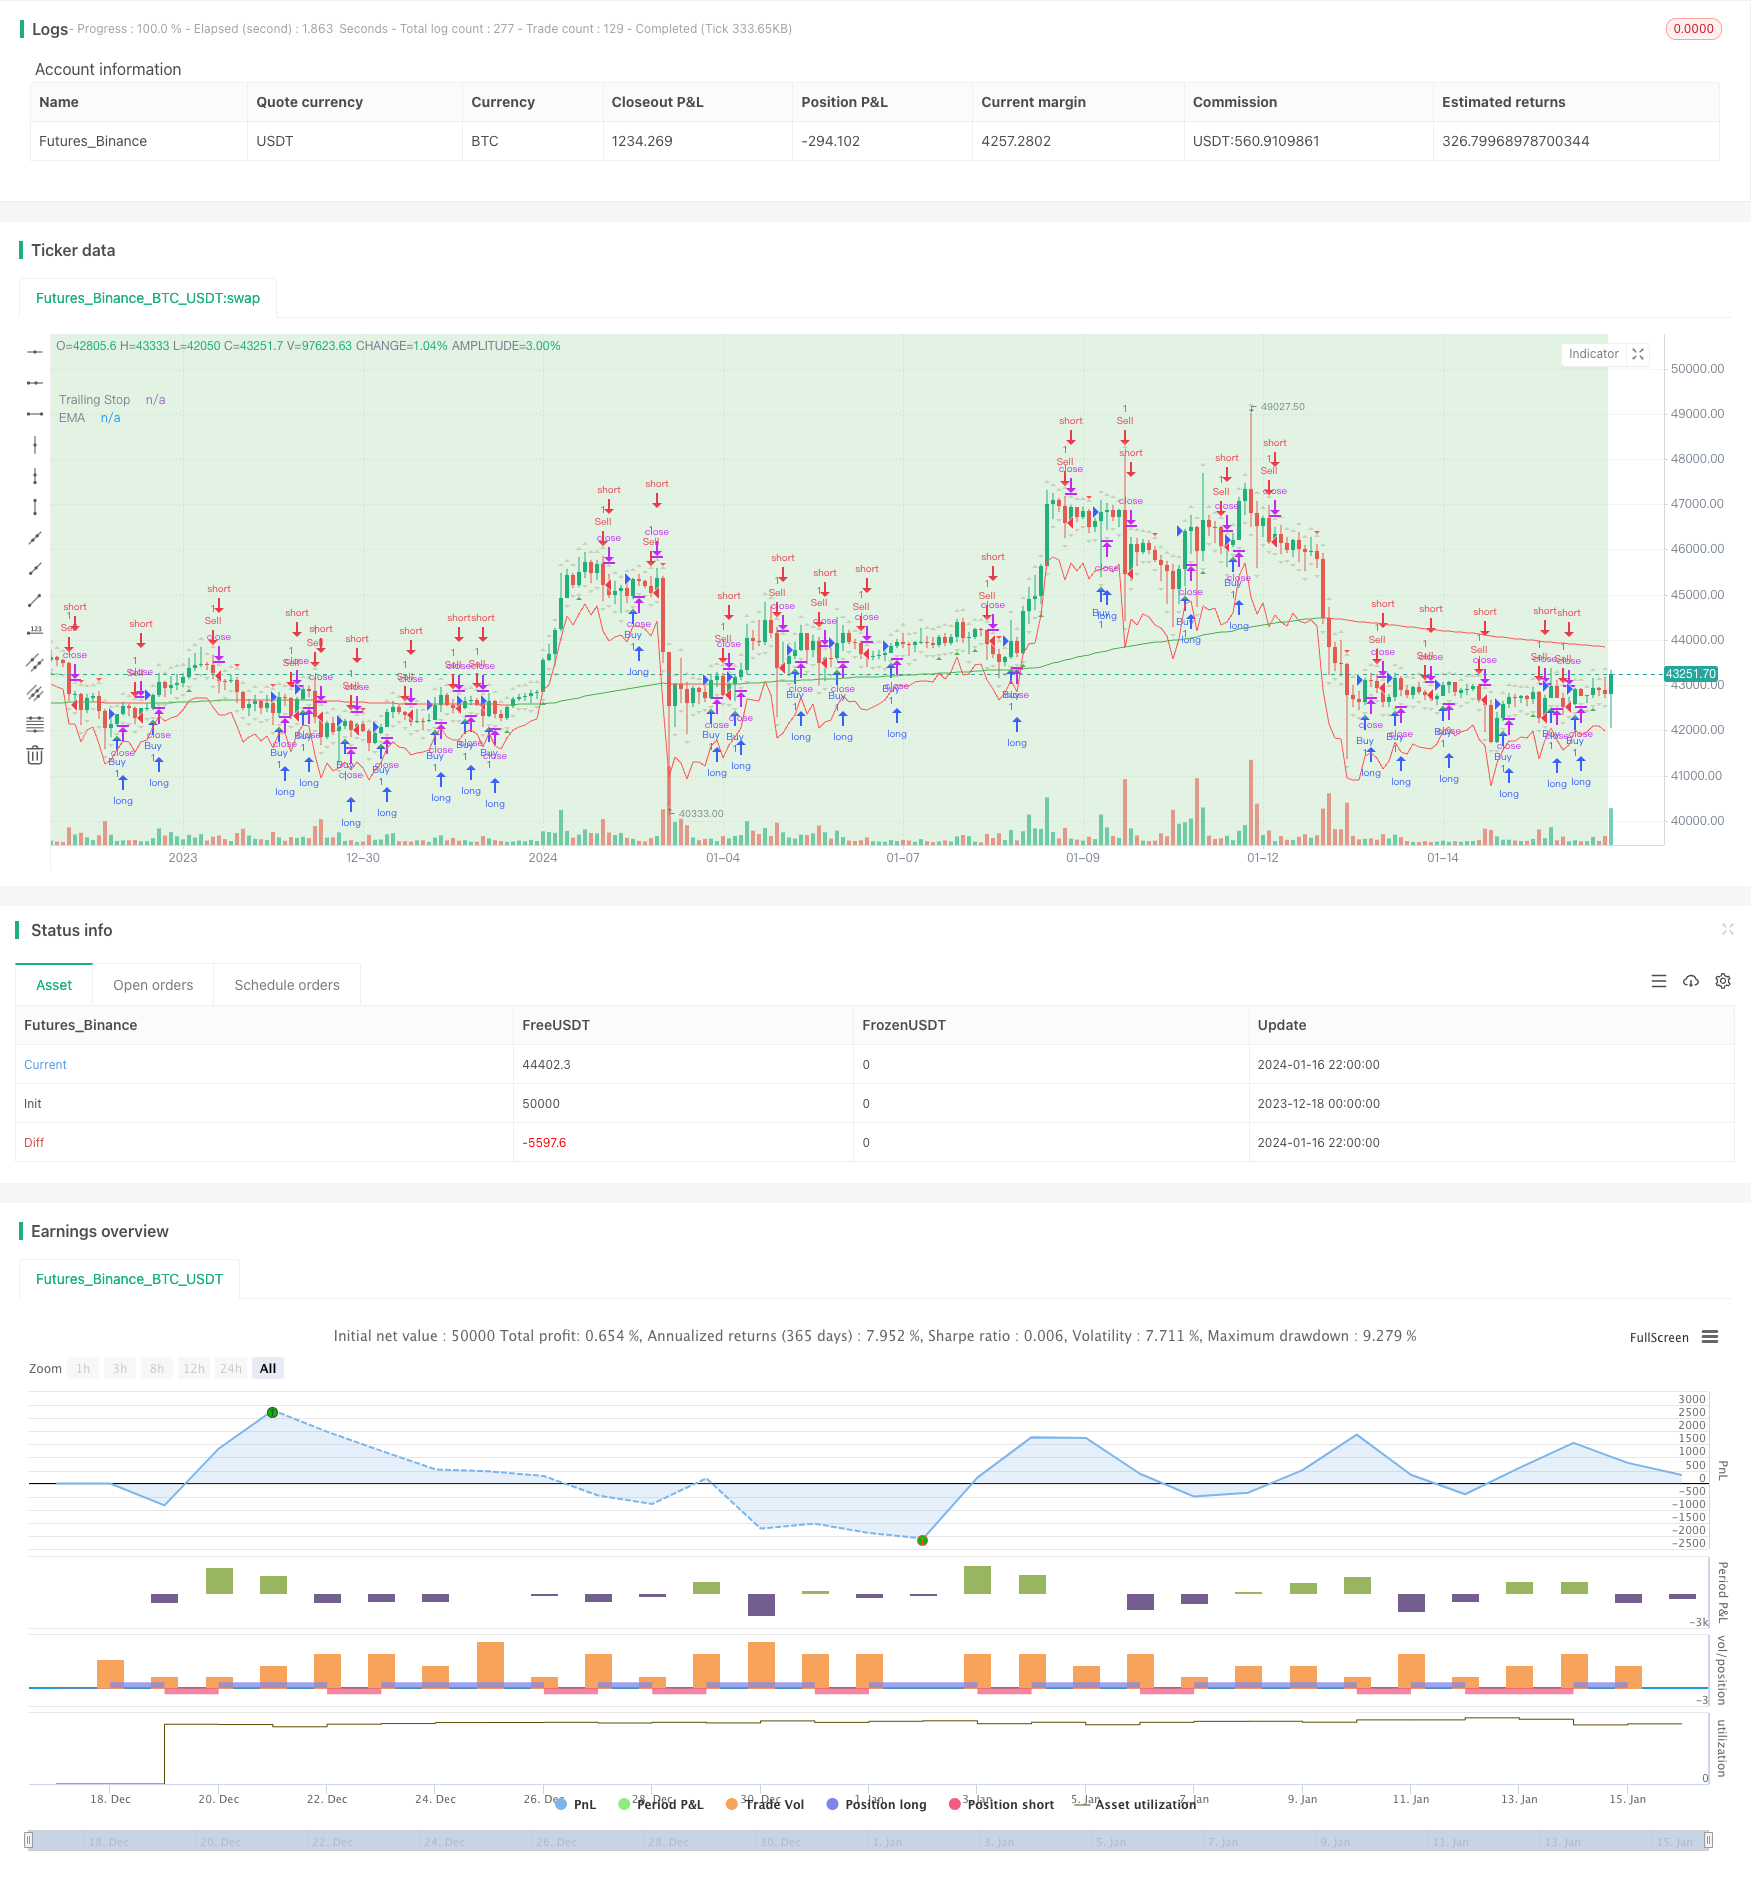
Stratégie de négociation basée sur des zones d'offre et de demande avec EMA et Trailing Stop
Auteur:ChaoZhang est là., Date: 2024-01-18 16:41:16 Je vous en prie.Les étiquettes:

Résumé
La stratégie utilise des zones d'offre et de demande, une moyenne mobile exponentielle (EMA) et un arrêt de trail pour les signaux commerciaux. Les utilisateurs peuvent ajuster les paramètres EMA et la visibilité du signal.
La logique de la stratégie
Calculs des indicateurs
La moyenne mobile exponentielle (EMA):
- L' EMA est calculé à partir des prix de clôture d' une période (par défaut: 200).
- Formule: EMA = (Price_t x α) + (EMA_t-1 x (1 - α)), où α = 2/(longueur + 1)
Autonomie moyenne (ATR):
- L'ATR mesure la volatilité du marché à partir d'une plage de prix réelle.
- La portée réelle est la plus grande des:
- Courant élevé moins courant bas
- Valeur absolue du plus haut actuel moins la clôture précédente
- Valeur absolue du plus bas actuel moins le plus bas de clôture précédent
- L'ATR utilise généralement 14 périodes.
Utilisé pour déterminer l'EMA pour la tendance et l'ATR pour le trailing stop basé sur la volatilité.
Identification des zones d'offre et de demande
Il identifie les modèles
-
Hauteur Hauteur (HH): pic actuel > pic précédent, dynamique ascendante.
-
Bas bas bas (LL): Périphérique actuel < Périphérique précédent, dynamique descendante.
-
Haute basse (HL): trou actuel > trou précédent, poursuite ascendante.
-
Hauteur inférieure (LH): pic actuel < pic précédent, poursuite à la baisse.
Utilisé avec les tendances pour identifier les renversements ou les continuations.
Entrée et sortie
Signal d'entrée: Acheter/vendre à la clôture de la troisième bougie au-dessus/au-dessous du précédent sommet/bas.
Sortie: Stop-loss de suivi basé sur l'ATR.
Les avantages
- Combine tendances, renversements, volatilité pour des signaux solides.
- Les zones de demande/offre identifient les S/R clés.
- L'arrêt ATR dynamique s'ajuste à la volatilité.
- Paramètres personnalisables.
- Des règles d'entrée simples.
Risques et améliorations
- Faux signaux: optimiser la longueur de l'EMA.
- Le risque d'un multiplicateur ATR élevé est de courir après les tendances.
- Considérez des filtres supplémentaires sur les entrées.
- Testez une approche axée sur les tendances.
Conclusion
Combine plusieurs techniques pour des backtests décents. Le monde réel est complexe, l'optimisation est la clé. La stratégie de base permet des extensions et des combinaisons.
/*backtest
start: 2023-12-18 00:00:00
end: 2024-01-17 00:00:00
period: 2h
basePeriod: 15m
exchanges: [{"eid":"Futures_Binance","currency":"BTC_USDT"}]
*/

//@version=5
strategy("Supply and Demand Zones with EMA and Trailing Stop", shorttitle="SD Zones", overlay=true)

showBuySignals = input(true, title="Show Buy Signals", group="Signals")
showSellSignals = input(true, title="Show Sell Signals", group="Signals")
showHLZone = input(true, title="Show HL Zone", group="Zones")
showLHZone = input(true, title="Show LH Zone", group="Zones")
showHHZone = input(true, title="Show HH Zone", group="Zones")
showLLZone = input(true, title="Show LL Zone", group="Zones")

emaLength = input(200, title="EMA Length", group="EMA Settings")
atrLength = input(14, title="ATR Length", group="Trailing Stop")
atrMultiplier = input(2, title="ATR Multiplier", group="Trailing Stop")

// Function to identify supply and demand zones
getZones(src, len, mult) =>
    base = request.security(syminfo.tickerid, "D", close)
    upper = request.security(syminfo.tickerid, "D", high)
    lower = request.security(syminfo.tickerid, "D", low)
    multiplier = request.security(syminfo.tickerid, "D", mult)
    zonetype = base + multiplier * len
    zone = src >= zonetype
    [zone, upper, lower]

// Identify supply and demand zones
[supplyZone, _, _] = getZones(close, high[1] - low[1], 1)
[demandZone, _, _] = getZones(close, high[1] - low[1], -1)

// Plot supply and demand zones
bgcolor(supplyZone ? color.new(color.red, 80) : na)
bgcolor(demandZone ? color.new(color.green, 80) : na)

// EMA with Linear Weighted method
ema = ta.ema(close, emaLength)

// Color code EMA based on its relation to candles
emaColor = close > ema ? color.new(color.green, 0) : close < ema ? color.new(color.red, 0) : color.new(color.yellow, 0)

// Plot EMA
plot(ema, color=emaColor, title="EMA")

// Entry Signal Conditions after the third candle
longCondition = ta.crossover(close, high[1]) and bar_index >= 2
shortCondition = ta.crossunder(close, low[1]) and bar_index >= 2

// Trailing Stop using ATR
atrValue = ta.atr(atrLength)
trailStop = close - atrMultiplier * atrValue

// Strategy Entry and Exit
if (longCondition)
    strategy.entry("Buy", strategy.long)
    strategy.exit("TrailStop", from_entry="Buy", loss=trailStop)

if (shortCondition)
    strategy.entry("Sell", strategy.short)
    strategy.exit("TrailStop", from_entry="Sell", loss=trailStop)

// Plot Entry Signals
plotshape(series=showBuySignals ? longCondition : na, title="Buy Signal", color=color.new(color.green, 0), style=shape.triangleup, location=location.belowbar)
plotshape(series=showSellSignals ? shortCondition : na, title="Sell Signal", color=color.new(color.red, 0), style=shape.triangledown, location=location.abovebar)

// Plot Trailing Stop
plot(trailStop, color=color.new(color.red, 0), title="Trailing Stop")

// Plot HH, LL, LH, and HL zones
plotshape(series=showHHZone and ta.highest(high, 2)[1] and ta.highest(high, 2)[2] ? 1 : na, title="HH Zone", color=color.new(color.blue, 80), style=shape.triangleup, location=location.abovebar)
plotshape(series=showLLZone and ta.lowest(low, 2)[1] and ta.lowest(low, 2)[2] ? 1 : na, title="LL Zone", color=color.new(color.blue, 80), style=shape.triangledown, location=location.belowbar)
plotshape(series=showLHZone and ta.highest(high, 2)[1] and ta.lowest(low, 2)[2] ? 1 : na, title="LH Zone", color=color.new(color.orange, 80), style=shape.triangleup, location=location.abovebar)
plotshape(series=showHLZone and ta.lowest(low, 2)[1] and ta.highest(high, 2)[2] ? 1 : na, title="HL Zone", color=color.new(color.orange, 80), style=shape.triangledown, location=location.belowbar)
- Optimisation de la stratégie de tendance basée sur le graphique des nuages Ichimoku
- L' inversion de tendance croisée combinée à trois stratégies doubles d'oscillateur à dix
- Candelabre de moyenne de Fibonacci avec stratégie de moyenne mobile pour le trading quantitatif
- Stratégie simple d'arrêt et d'achat basée sur le pourcentage
- Une analyse de la stratégie de négociation quantitative basée sur la fonction d'erreur gaussienne
- Stratégie d'inversion de l'indice de résistance
- RSI-VWAP Stratégie quantitative à court terme
- Stratégie de négociation de cryptomonnaie adaptative basée sur l'arbitrage
- Une double stratégie de croisement des moyennes mobiles
- Stratégie de négociation à moyenne mobile double
- La stratégie suivie par la tendance basée sur les bandes de Bollinger
- Stratégie étendue d'évolution du volume des prix
- Stratégie à court terme de suivi des oscillations
- Stratégie quantitative agressive de détection du fond
- Tendance à la suite d'une stratégie de négociation basée sur l'indicateur T3
- Stratégie de négociation à court terme basée sur l'indice stochastique
- La stratégie de négociation de l'inversion de l'ETH à travers la SMA de Londres
- Stratégie de suivi des tendances basée sur la SMA et l'ATR
- La stratégie des signaux d'achat et de vente de Hilo Activator
- Stratégie de l'oscillateur stochastique lissé exponentiellement