Stratégie révolutionnaire basée sur un double indicateur

Aperçu
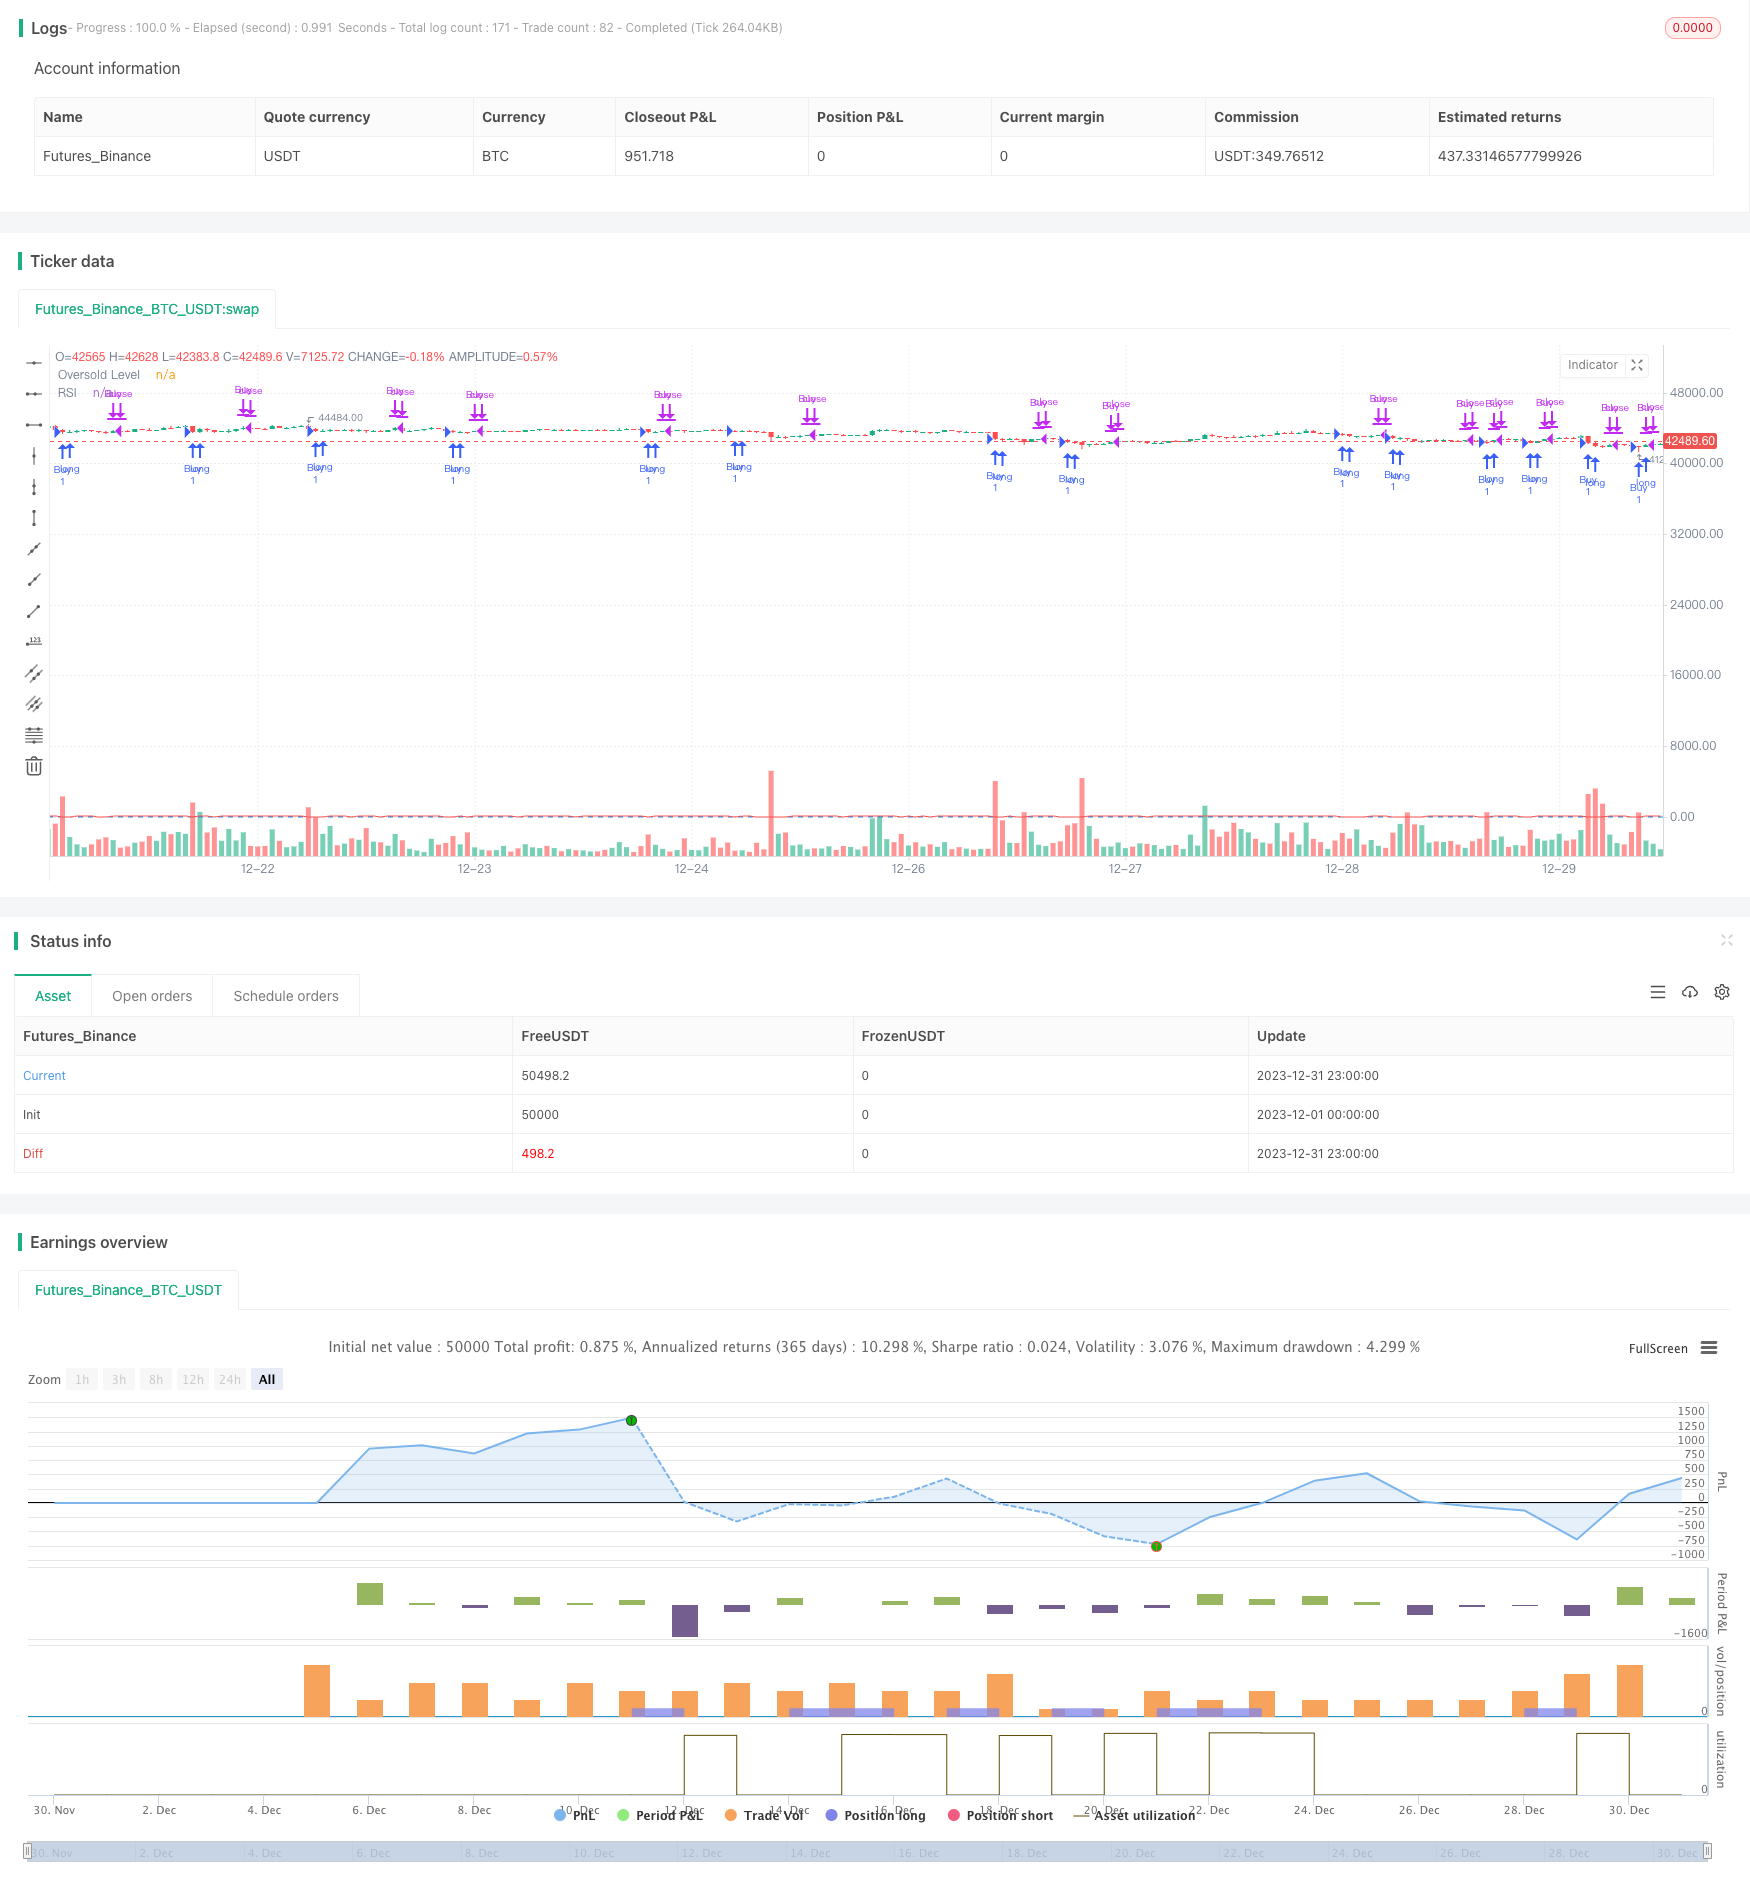
La stratégie de rupture de double indicateur est une stratégie de négociation bas-boutique-haute-vente combinant l’indicateur RSI et l’indicateur de prix de clôture. La stratégie est simple à utiliser, présente un faible risque de retrait et convient à la tenue de positions sur les lignes moyennes et longues.
Principe de stratégie
La stratégie est principalement basée sur les deux indicateurs suivants:
- Indicateur RSI: lorsque le RSI2 est inférieur à 15, faites une entrée supplémentaire.
- La clôture de la journée précédente: la position est levée si la clôture de la journée est supérieure au sommet de la journée précédente.
La condition d’entrée est un sur-achat du RSI, indiquant qu’une action est fortement sous-évaluée et a une forte probabilité de reprise. La condition d’exit est que le prix de clôture dépasse le prix le plus élevé de la journée précédente, indiquant que l’action est en train d’entrer dans un mouvement à plusieurs têtes et devrait être arrêtée de manière appropriée.
Analyse des avantages
Les avantages d’une stratégie de percée à double objectif sont les suivants:
- Les stratégies sont simples et faciles à mettre en œuvre.
- Les signaux faux peuvent être contrôlés efficacement grâce à des doubles indicateurs.
- Les paramètres de l’indicateur RSI ont une grande marge d’optimisation et peuvent être ajustés à l’état optimal.
- Le risque de retrait est plus faible.
- Il est largement adapté aux actions de marché moyen et a une bonne efficacité sur le terrain.
Analyse des risques
Cette stratégie comporte aussi des risques:
- Le RSI doit être ajusté car les actions sont trop volatiles.
- Il est facile de s’attendre à un retour en arrière de la ligne courte en cas d’opération à plusieurs têtes.
- La hausse des cours la veille a nécessité une évaluation de la faisabilité.
Il est possible d’éviter ces risques en optimisant les paramètres du RSI, en évaluant le type de transaction et en combinant les jugements avec d’autres indicateurs.
Direction d’optimisation
Les orientations d’optimisation de la stratégie se concentrent principalement sur les aspects suivants:
- Évaluation de l’effet de l’indicateur RSI sur les différentes périodes.
- Test de la combinaison des prix de clôture avec d’autres indicateurs de prix.
- Il y a aussi des mécanismes d’arrêt des dommages, comme la réintégration après une période d’absence.
- La fiabilité des signaux d’entrée est évaluée en fonction de la variation du volume des transactions.
- Optimisation automatique des paramètres à l’aide d’algorithmes d’apprentissage automatique.
Résumer
La stratégie de rupture du double indicateur est une stratégie de quantification très pratique dans l’ensemble. La stratégie est simple à utiliser, le risque de rétractation est faible et peut devenir une procédure de quantification intelligente et stable grâce à l’optimisation des paramètres et à l’amélioration des règles.
/*backtest
start: 2023-12-01 00:00:00
end: 2023-12-31 23:59:59
period: 1h
basePeriod: 15m
exchanges: [{"eid":"Futures_Binance","currency":"BTC_USDT"}]
*/

// This source code is subject to the terms of the Mozilla Public License 2.0 at https://mozilla.org/MPL/2.0/
// © hobbiecode

// If RSI(2) is less than 15, then enter at the close.
// Exit on close if today’s close is higher than yesterday’s high.

//@version=5
strategy("Hobbiecode - RSI + Close previous day", overlay=true)

// RSI parameters
rsi_period = 2
rsi_lower = 15

// Calculate RSI
rsi_val = ta.rsi(close, rsi_period)

// Check if RSI is lower than the defined threshold
if (rsi_val < rsi_lower)
    strategy.entry("Buy", strategy.long)

// Check if today's close is higher than yesterday's high
if (strategy.position_size > 0 and close > ta.highest(high[1], 1))
    strategy.close("Buy")

// Plot RSI on chart
plot(rsi_val, title="RSI", color=color.red)
hline(rsi_lower, title="Oversold Level", color=color.blue)