Stratégie quantitative de la moyenne mobile de l'élan
Auteur:ChaoZhang est là., Date: 2024-01-26 11h39: 26Les étiquettes:

Résumé
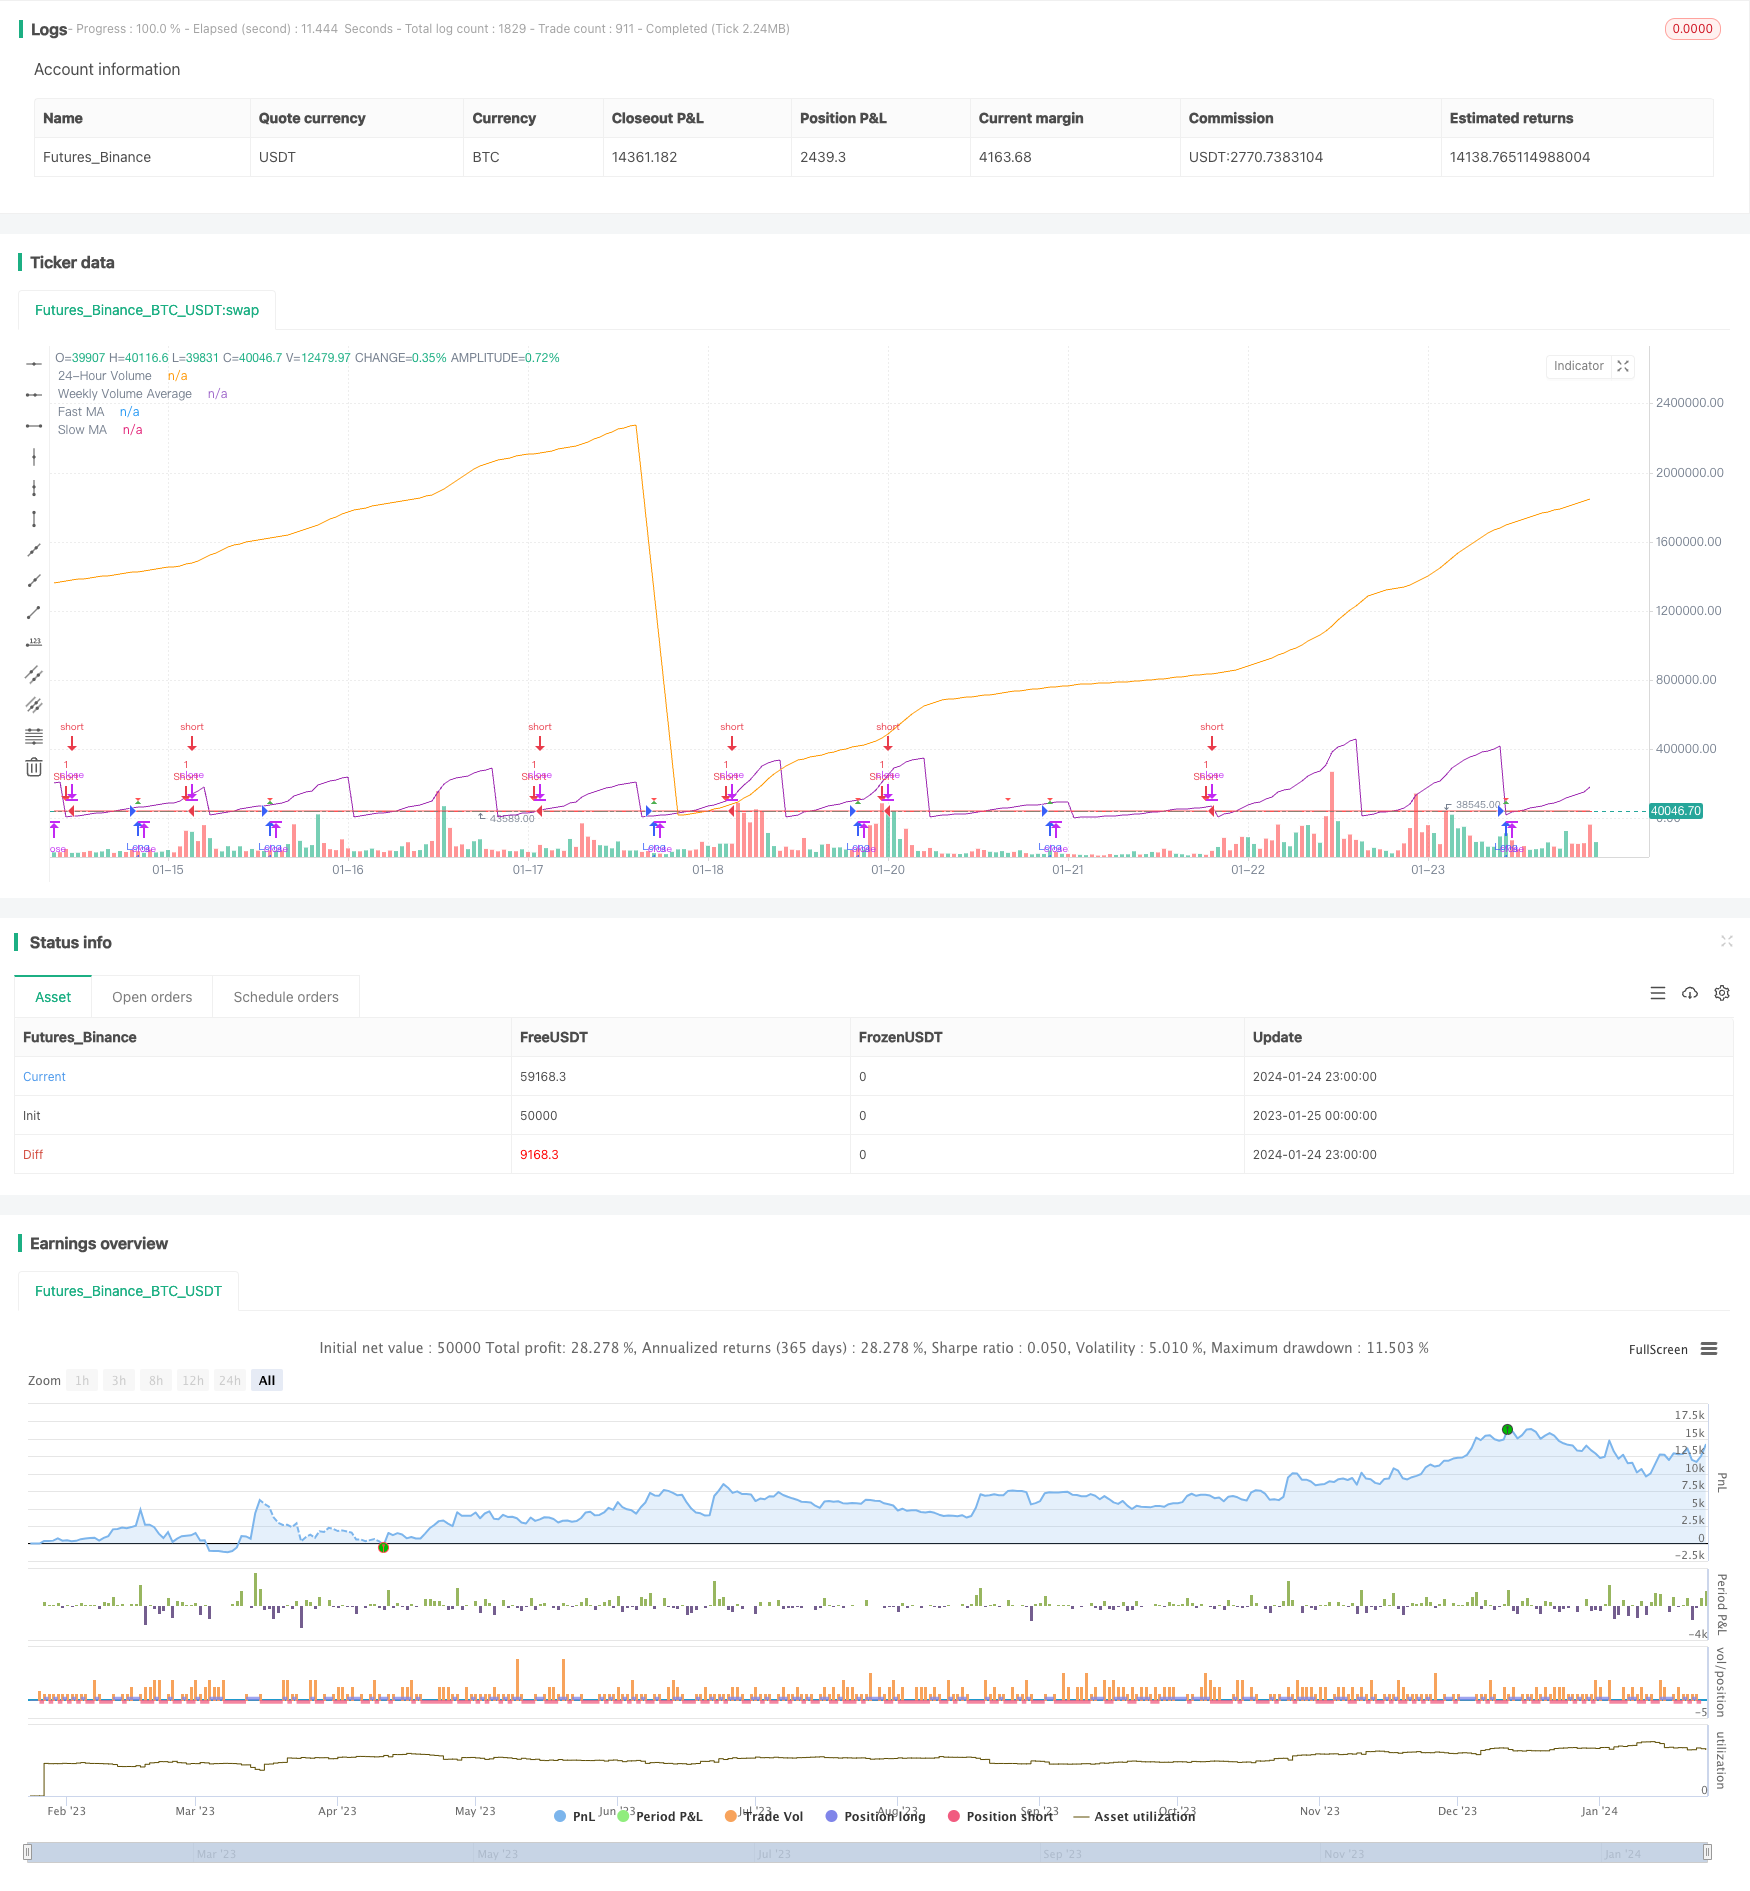
Cette stratégie combine les indicateurs de moyenne mobile et de volume de négociation pour concevoir les règles d'entrée et de sortie longues et courtes, formant ainsi une stratégie commerciale quantitative complète.
Principe de stratégie
Indicateurs clés
- Les moyennes mobiles: moyennes mobiles rapides (ligne bleue) et moyennes mobiles lentes (ligne rouge)
- Volume: volume sur 24 heures (violet) et volume moyen sur 7 jours (orange)
Conditions de la stratégie
Conditions d'entrée à long terme:
- La MA rapide dépasse la MA lente
- Volume de 24 heures inférieur à 50% du volume moyen de 7 jours
Conditions d'entrée courtes:
La MA rapide passe sous la MA lente
Entrées et sorties
Entrée longue:Faites le long lorsque les conditions sont remplies.
En bref:Faites du short quand les conditions courtes sont remplies.
Profitez et arrêtez la perte:Niveau de prise de profit et de stop-loss affiché pour la position longue
Analyse des avantages
- Combiner prix et volume pour éviter une fausse rupture
- Des règles d'entrée et de sortie claires
- Prendre des bénéfices et arrêter les pertes pour contrôler le risque
Analyse des risques
- Opérations fréquentes avec stratégie de moyenne mobile
- Qualité peu fiable des données de volume
- Suroptimisation du réglage des paramètres
Améliorations:
- Ajuster les paramètres de l'AM pour réduire la fréquence des opérations
- Vérifier les signaux avec plus de sources de données
- Tests antérieurs stricts pour éviter une sur-optimisation
Directions d'optimisation
- Ajouter d'autres indicateurs aux signaux filtrés
- Prise de bénéfices et stop loss dynamiques
- Analyse de plusieurs délais pour améliorer la stabilité
Résumé
Cette stratégie intègre des indicateurs de MA et de volume pour concevoir une stratégie quantitative complète avec des conditions d'entrée claires, un profit / stop-loss, facile à utiliser.
/*backtest
start: 2023-01-25 00:00:00
end: 2024-01-25 00:00:00
period: 1h
basePeriod: 15m
exchanges: [{"eid":"Futures_Binance","currency":"BTC_USDT"}]
*/

//@version=5
strategy("MA and Volume Strategy", overlay=true)

// Input parameters
fastLength = input(9, title="Fast MA Length")
slowLength = input(21, title="Slow MA Length")
volumePercentageThreshold = input(50, title="Volume Percentage Threshold")

// Calculate moving averages
fastMA = ta.sma(close, fastLength)
slowMA = ta.sma(close, slowLength)

// Calculate 24-hour volume and weekly volume average
dailyVolume = request.security(syminfo.tickerid, "D", volume)
weeklyVolumeAvg = ta.sma(request.security(syminfo.tickerid, "W", volume), 7)

// Strategy conditions
longCondition = ta.crossover(fastMA, slowMA) and dailyVolume < (weeklyVolumeAvg * volumePercentageThreshold / 100)
shortCondition = ta.crossunder(fastMA, slowMA)

// Set take profit and stop loss levels
takeProfitLong = close * 1.50
stopLossLong = close * 0.90

// Strategy orders
strategy.entry("Long", strategy.long, when=longCondition)
strategy.entry("Short", strategy.short, when=shortCondition)

// Plot moving averages
plot(fastMA, color=color.blue, title="Fast MA")
plot(slowMA, color=color.red, title="Slow MA")

// Plot 24-hour volume and weekly volume average
plot(dailyVolume, color=color.purple, title="24-Hour Volume", transp=0)
plot(weeklyVolumeAvg, color=color.orange, title="Weekly Volume Average")

// Plot entry signals
plotshape(series=longCondition, title="Buy Signal", color=color.green, style=shape.triangleup, size=size.small)
plotshape(series=shortCondition, title="Sell Signal", color=color.red, style=shape.triangledown, size=size.small)

// Plot take profit and stop loss levels only when a valid trade is active
plotshape(series=longCondition, title="Take Profit Long", color=color.green, style=shape.triangleup, size=size.small)
plotshape(series=longCondition, title="Stop Loss Long", color=color.red, style=shape.triangledown, size=size.small)
- Stratégie de moyenne mobile à retraite à deux ans
- Stratégie de négociation à moyenne mobile double
- Système de suivi des tendances de rééquilibrage dynamique de la position
- Stratégie de renversement ouvert quotidien
- Stratégie de négociation de la SMA Golden Cross
- Stratégie des moyennes mobiles de la Croix d'Or
- Stratégie de négociation des crypto-monnaies MACD
- Stratégie à court terme de régression linéaire et de moyenne mobile double
- Stratégie de dynamique stochastique à triple chevauchement
- Stratégie de tendance à la dynamique
- Stratégie combinée de double inversion de la moyenne mobile et de l'arrêt de traînée ATR
- Stratégie de négociation des contrats à terme à effet de levier Martingale
- Stratégie de reprise de l' élan
- Prédiction à deux bougies stratégie de clôture
- Stratégie de négociation de suivi des supertendances stochastiques avec arrêt des pertes
- Tendance à la double inversion de la bande oscillante suivant la stratégie
- Suivre la tendance en suivant une stratégie basée sur l'IMD et l'ISR
- Stratégie quantitative d'oscillation de soutien et de résistance
- Stratégie de suivi des tendances avec 3 EMA, DMI et MACD