Auteur:ChaoZhang est là.
Les étiquettes:
Les étiquettes:

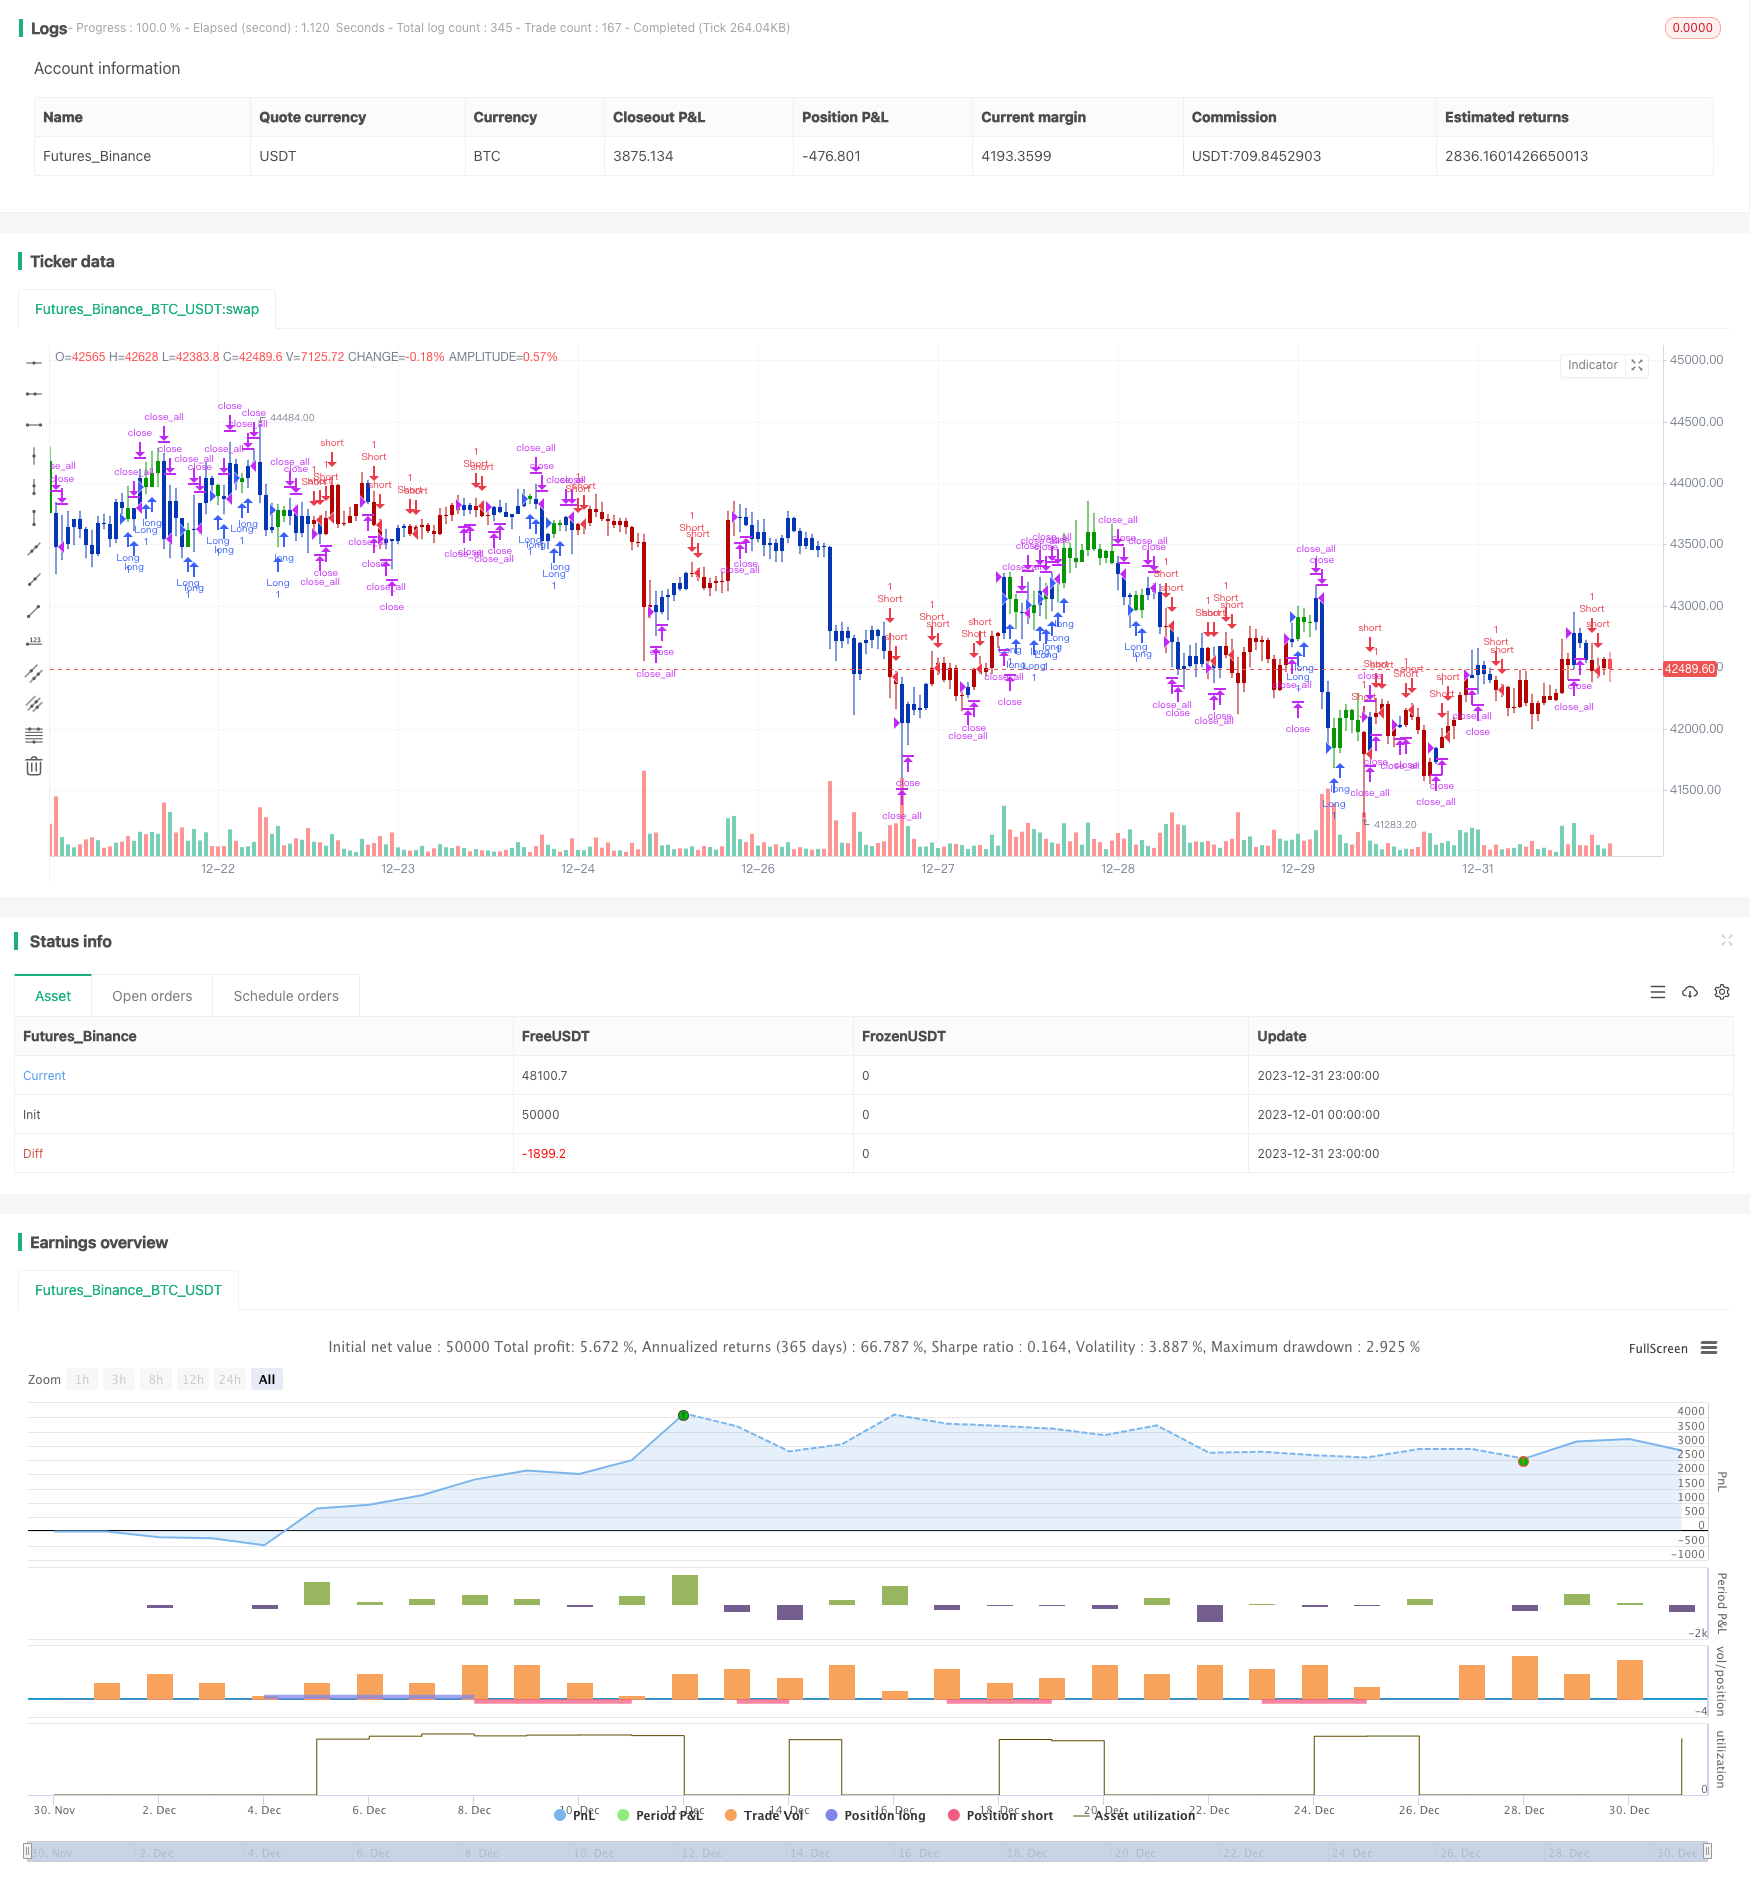
Résumé
La logique de la stratégie
Analyse des avantages
Analyse des risques
Pour contrôler ces risques, il est recommandé d'utiliser la méthode de l'analyse de marche vers l'avenir pour l'optimisation des paramètres et de définir des points de stop-loss raisonnables.
Directions d'optimisation
-
Des méthodes telles que le trailing stop loss et le stop loss moyen peuvent être essayées.
Conclusion
/*backtest
start: 2023-12-01 00:00:00
end: 2023-12-31 23:59:59
period: 1h
basePeriod: 15m
exchanges: [{"eid":"Futures_Binance","currency":"BTC_USDT"}]
*/

//@version=5
////////////////////////////////////////////////////////////
//  Copyright by HPotter v1.0 21/04/2022
// This is combo strategies for get a cumulative signal.
//
// First strategy
// This indicator plots 2/20 exponential moving average. For the Mov
// Avg X 2/20 Indicator, the EMA bar will be painted when the Alert criteria is met.
//
// Second strategy
// This indicator calculates 3 Moving Averages for default values of
// 13, 8 and 5 days, with displacement 8, 5 and 3 days: Median Price (High+Low/2).
// The most popular method of interpreting a moving average is to compare
// the relationship between a moving average of the security's price with
// the security's price itself (or between several moving averages).
//
//
// WARNING:
// - For purpose educate only
// - This script to change bars colors.
////////////////////////////////////////////////////////////
EMA20(Length) =>
    pos = 0.0
    xPrice = close
    xXA = ta.ema(xPrice, Length)
    nHH = math.max(high, high[1])
    nLL = math.min(low, low[1])
    nXS = nLL > xXA or nHH < xXA ? nLL : nHH
    iff_1 = nXS < close[1] ? 1 : nz(pos[1], 0)
    pos := nXS > close[1] ? -1 : iff_1
    pos


BWA3Lines(LLength,MLength,SLength,LOffset,MOffset,SOffset) =>
    pos = 0.0
    xLSma = ta.sma(hl2, LLength)[LOffset]
    xMSma = ta.sma(hl2, MLength)[MOffset]
    xSSma = ta.sma(hl2, SLength)[SOffset]
    pos := close < xSSma and xSSma < xMSma and xMSma < xLSma ? -1 :
    	     close > xSSma and xSSma > xMSma and xMSma > xLSma ? 1 : nz(pos[1], 0)
    pos

strategy(title='Combo 2/20 EMA & Bill Williams Averages. 3Lines', shorttitle='Combo', overlay=true)
var I1 = '●═════ 2/20 EMA ═════●'
Length = input.int(14, minval=1, group=I1)
var I2 = '●═════ 3Lines ═════●'
LLength = input.int(13, minval=1, group=I2)
MLength = input.int(8,minval=1, group=I2)
SLength = input.int(5,minval=1, group=I2)
LOffset = input.int(8,minval=1, group=I2)
MOffset = input.int(5,minval=1, group=I2)
SOffset = input.int(3,minval=1, group=I2)
var misc = '●═════ MISC ═════●'
reverse = input.bool(false, title='Trade reverse', group=misc)
var timePeriodHeader = '●═════ Time Start ═════●'
d = input.int(1, title='From Day', minval=1, maxval=31, group=timePeriodHeader)
m = input.int(1, title='From Month', minval=1, maxval=12, group=timePeriodHeader)
y = input.int(2005, title='From Year', minval=0, group=timePeriodHeader)
StartTrade = time > timestamp(y, m, d, 00, 00) ? true : false
posEMA20 = EMA20(Length)
prePosBWA3Lines = BWA3Lines(LLength,MLength,SLength,LOffset,MOffset,SOffset)
iff_1 = posEMA20 == -1 and prePosBWA3Lines == -1 and StartTrade ? -1 : 0
pos = posEMA20 == 1 and prePosBWA3Lines == 1 and StartTrade ? 1 : iff_1
iff_2 = reverse and pos == -1 ? 1 : pos
possig = reverse and pos == 1 ? -1 : iff_2
if possig == 1
    strategy.entry('Long', strategy.long)
if possig == -1
    strategy.entry('Short', strategy.short)
if possig == 0
    strategy.close_all()
barcolor(possig == -1 ? #b50404 : possig == 1 ? #079605 : #0536b3)
Plus de
- Stratégie de rupture des canaux de moyenne mobile
- Stratégie de test à temps fixe
- Stratégie MACD multi-temporelle optimisée pour le temps et l'espace
- Stratégie de négociation quantitative basée sur l'indice de rentabilité des actions et sur les IFM
- Stratégie de négociation composée à multiples indicateurs
- Stratégie de négociation à court terme de l' EMA croisée
- Tendance à la suite d'une stratégie basée sur un stop-loss dynamique de double croisement EMA
- La stratégie de l' éruption du marché haussier
- La stratégie relative de l'élan
- La tendance des vagues et la tendance basée sur la VWMA à la suite d'une stratégie quantitative
- Stratégie de super-tendance adaptative à trois facteurs
- Stratégie de croisement des moyennes mobiles
- Stratégie de négociation automatisée de la vague B du chiffre de marché
- Stratégie clé de contre-test
- Stratégie de canal à bas prix à bas prix V.1
- Stratégie de négociation de renversement de l'élan