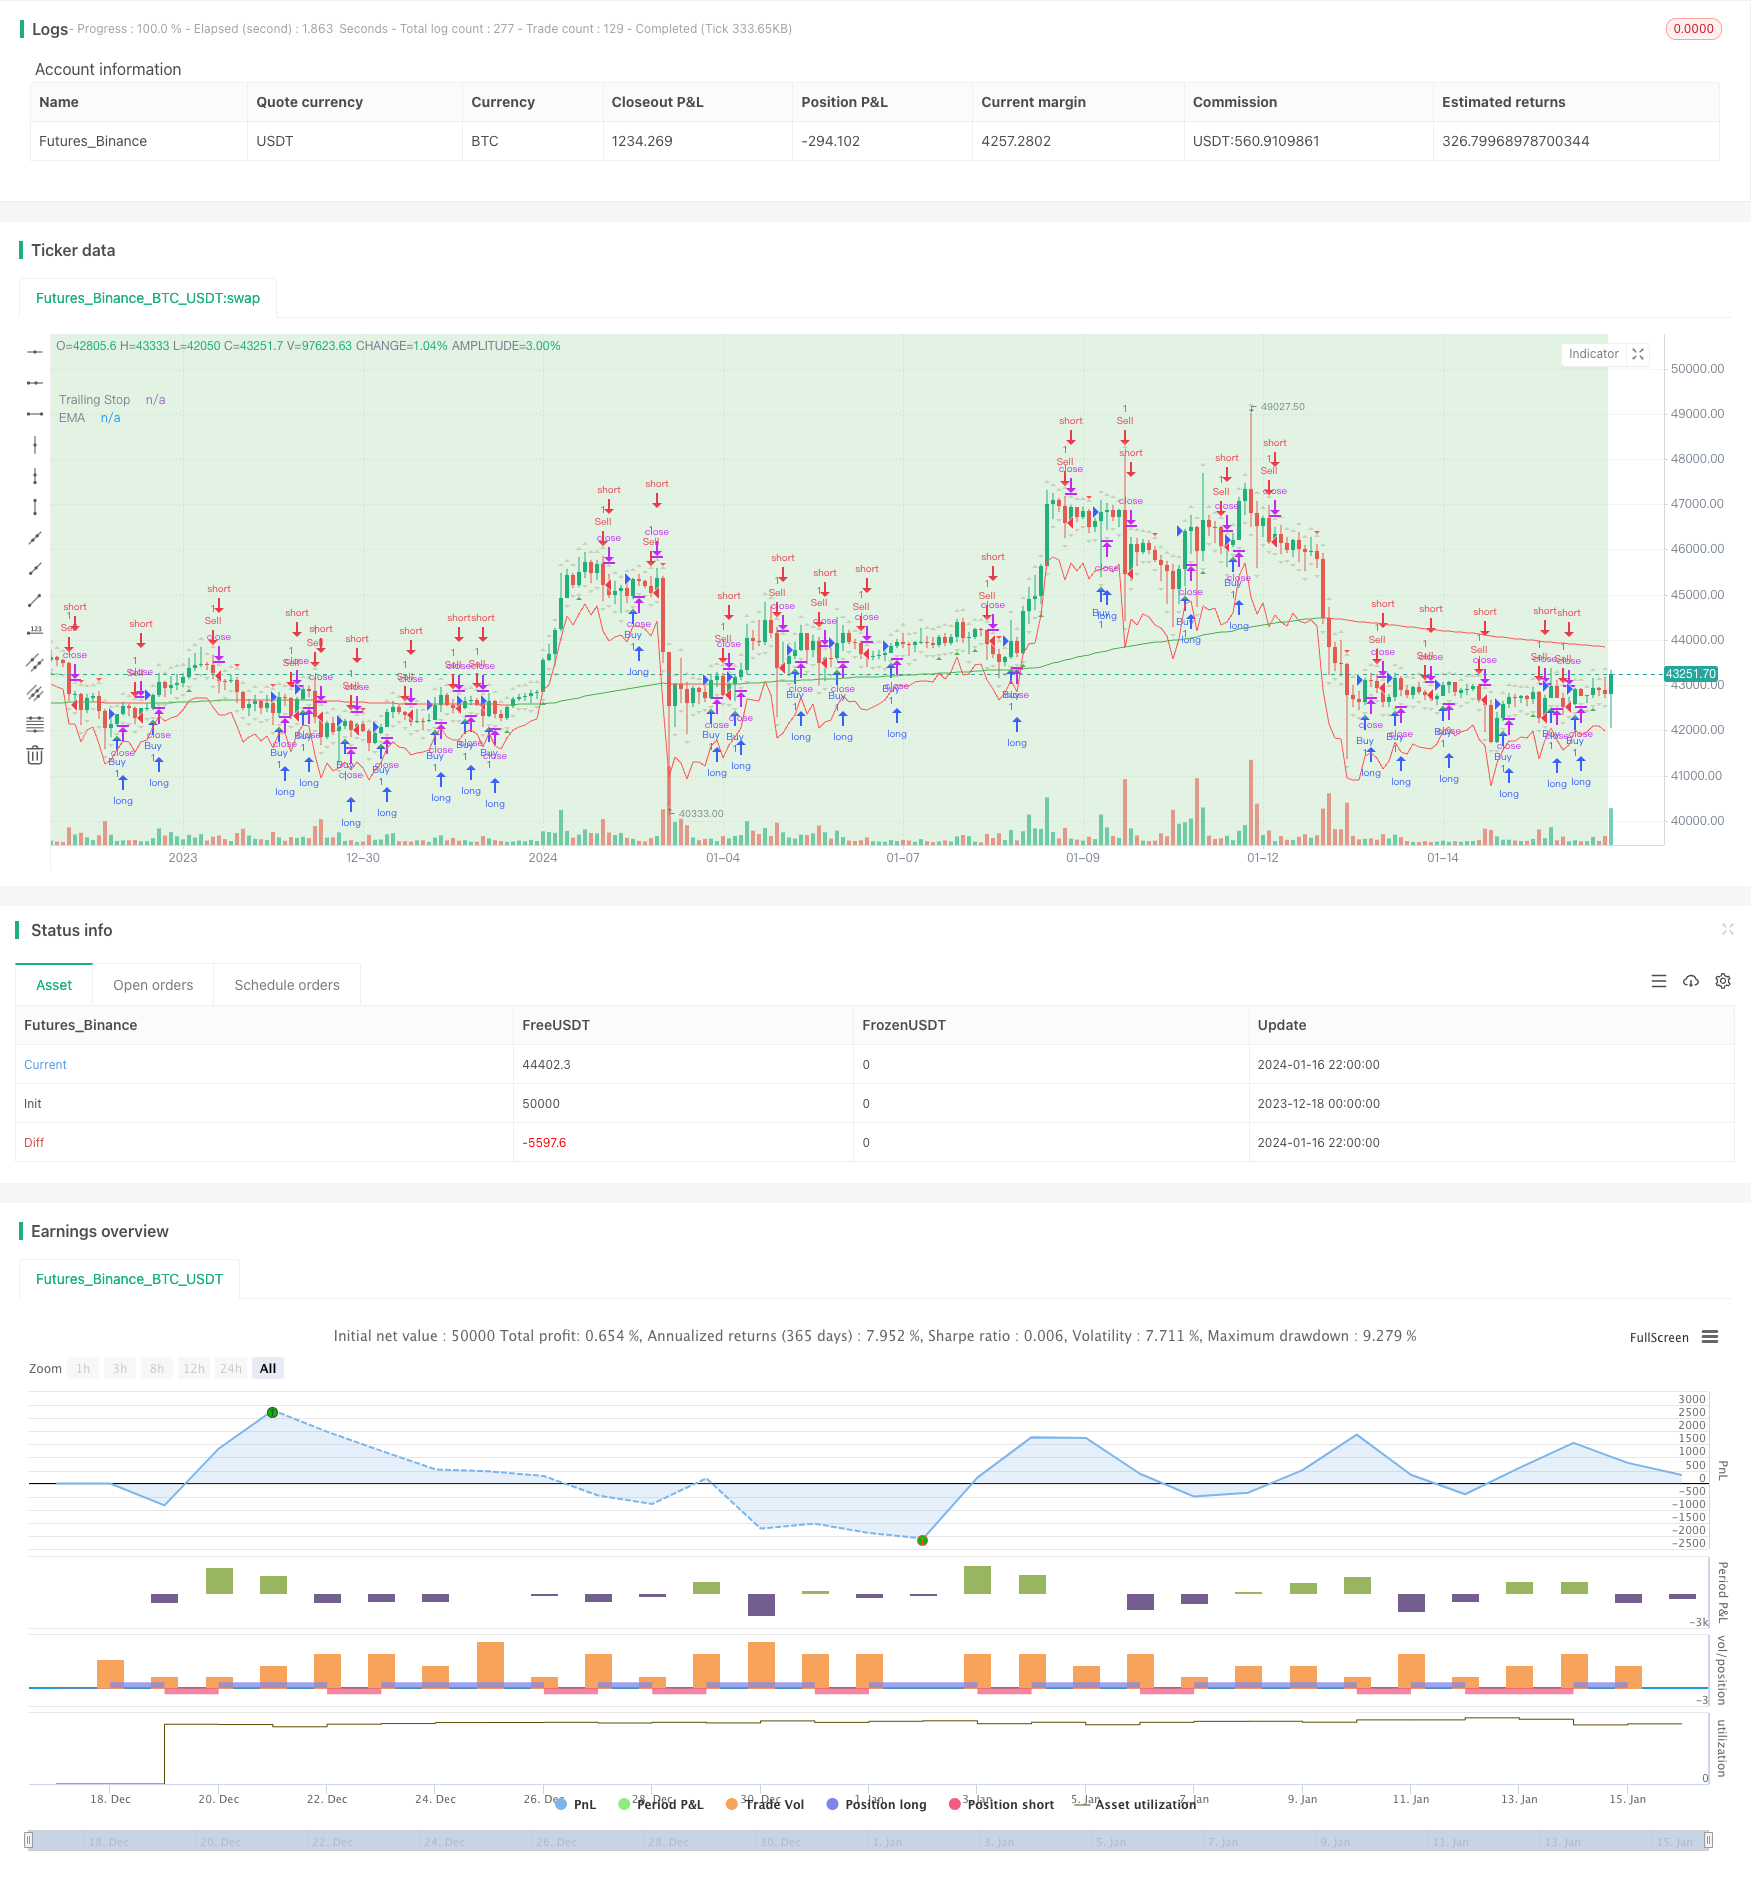
ईएमए और ट्रेलिंग स्टॉप के साथ आपूर्ति और मांग क्षेत्रों पर आधारित ट्रेडिंग रणनीति
लेखक:चाओझांग, दिनांकः 2024-01-18 16:41:16टैगः

अवलोकन
रणनीति व्यापार संकेतों के लिए आपूर्ति और मांग क्षेत्रों, घातीय चलती औसत (ईएमए), और औसत सच्ची सीमा (एटीआर) ट्रेलिंग स्टॉप का उपयोग करती है। उपयोगकर्ता ईएमए सेटिंग्स और संकेत दृश्यता को समायोजित कर सकते हैं। रणनीति उच्च उच्च (एचएच), निम्न निम्न (एलएल), निम्न उच्च (एलएच), और उच्च निम्न (एचएल) क्षेत्रों को चिह्नित करती है। संकेत तीसरी मोमबत्ती के बाद दिखाए जाते हैं, बैकटेस्टिंग के लिए उपयुक्त हैं।
रणनीति तर्क
सूचक गणनाएँ
घातीय चलती औसत (ईएमए):
- ईएमए की गणना अवधि के समापन मूल्य (डिफ़ॉल्टः 200) से की जाती है।
- सूत्रः ईएमए = (मूल्य_टी x α) + (ईएमए_टी -1 x (1 - α)), जहां α = 2/(लंबाई + 1)
औसत वास्तविक सीमा (एटीआर):
- एटीआर वास्तविक मूल्य सीमा से बाजार अस्थिरता को मापता है।
- वास्तविक सीमा निम्न में से सबसे बड़ी हैः
- वर्तमान उच्च शून्य वर्तमान निम्न
- वर्तमान उच्च शून्य पिछले बंद का पूर्ण मान
- वर्तमान निम्न से घटाकर पिछले बंद का पूर्ण मान
- एटीआर आमतौर पर 14 अवधि का उपयोग करता है।
प्रवृत्ति के लिए ईएमए और अस्थिरता आधारित ट्रैलिंग स्टॉप के लिए एटीआर निर्धारित करने के लिए प्रयोग किया जाता है।
आपूर्ति और मांग क्षेत्र की पहचान
यह
-
उच्च उच्च (HH): वर्तमान शिखर > पिछला शिखर, ऊपर की ओर गति।
-
निचला निचला (LL): वर्तमान निचला स्तर < पिछला निचला स्तर, नीचे की ओर गति।
-
उच्च निम्न (एचएल): वर्तमान निचला स्तर > पिछला निचला स्तर, ऊपर की ओर बढ़ना।
-
निचला उच्च (एलएच): वर्तमान शिखर < पिछला शिखर, नीचे की ओर जारी।
रुझानों के साथ इस्तेमाल किया जाता है, ताकि उलटफेर या निरंतरता की पहचान की जा सके।
प्रवेश और निकास
प्रवेश संकेत: तीसरी मोमबत्ती के बंद होने पर पिछले उच्च/निम्न से ऊपर/नीचे खरीदें/बेचें।
बाहर निकलना: एटीआर के आधार पर स्टॉप लॉस का अनुसरण करना।
लाभ
- मजबूत संकेतों के लिए रुझानों, उलटफेरों, अस्थिरता का संयोजन करता है।
- मांग/आपूर्ति क्षेत्र प्रमुख एस/आर की पहचान करते हैं।
- गतिशील एटीआर स्टॉप अस्थिरता को समायोजित करता है।
- अनुकूलन योग्य पैरामीटर।
- प्रवेश के सरल नियम।
जोखिम और सुधार
- झूठे संकेत: ईएमए लंबाई को अनुकूलित करें।
- उच्च एटीआर गुणक रुझानों का पीछा करने का जोखिम है।
- प्रविष्टियों पर अतिरिक्त फ़िल्टर पर विचार करें।
- प्रवृत्ति-केंद्रित दृष्टिकोण का परीक्षण करें।
निष्कर्ष
उचित बैकटेस्ट के लिए कई तकनीकों को जोड़ती है। वास्तविक दुनिया जटिल है, अनुकूलन महत्वपूर्ण है। बुनियादी रणनीति एक्सटेंशन और संयोजन की अनुमति देती है।
/*backtest
start: 2023-12-18 00:00:00
end: 2024-01-17 00:00:00
period: 2h
basePeriod: 15m
exchanges: [{"eid":"Futures_Binance","currency":"BTC_USDT"}]
*/

//@version=5
strategy("Supply and Demand Zones with EMA and Trailing Stop", shorttitle="SD Zones", overlay=true)

showBuySignals = input(true, title="Show Buy Signals", group="Signals")
showSellSignals = input(true, title="Show Sell Signals", group="Signals")
showHLZone = input(true, title="Show HL Zone", group="Zones")
showLHZone = input(true, title="Show LH Zone", group="Zones")
showHHZone = input(true, title="Show HH Zone", group="Zones")
showLLZone = input(true, title="Show LL Zone", group="Zones")

emaLength = input(200, title="EMA Length", group="EMA Settings")
atrLength = input(14, title="ATR Length", group="Trailing Stop")
atrMultiplier = input(2, title="ATR Multiplier", group="Trailing Stop")

// Function to identify supply and demand zones
getZones(src, len, mult) =>
    base = request.security(syminfo.tickerid, "D", close)
    upper = request.security(syminfo.tickerid, "D", high)
    lower = request.security(syminfo.tickerid, "D", low)
    multiplier = request.security(syminfo.tickerid, "D", mult)
    zonetype = base + multiplier * len
    zone = src >= zonetype
    [zone, upper, lower]

// Identify supply and demand zones
[supplyZone, _, _] = getZones(close, high[1] - low[1], 1)
[demandZone, _, _] = getZones(close, high[1] - low[1], -1)

// Plot supply and demand zones
bgcolor(supplyZone ? color.new(color.red, 80) : na)
bgcolor(demandZone ? color.new(color.green, 80) : na)

// EMA with Linear Weighted method
ema = ta.ema(close, emaLength)

// Color code EMA based on its relation to candles
emaColor = close > ema ? color.new(color.green, 0) : close < ema ? color.new(color.red, 0) : color.new(color.yellow, 0)

// Plot EMA
plot(ema, color=emaColor, title="EMA")

// Entry Signal Conditions after the third candle
longCondition = ta.crossover(close, high[1]) and bar_index >= 2
shortCondition = ta.crossunder(close, low[1]) and bar_index >= 2

// Trailing Stop using ATR
atrValue = ta.atr(atrLength)
trailStop = close - atrMultiplier * atrValue

// Strategy Entry and Exit
if (longCondition)
    strategy.entry("Buy", strategy.long)
    strategy.exit("TrailStop", from_entry="Buy", loss=trailStop)

if (shortCondition)
    strategy.entry("Sell", strategy.short)
    strategy.exit("TrailStop", from_entry="Sell", loss=trailStop)

// Plot Entry Signals
plotshape(series=showBuySignals ? longCondition : na, title="Buy Signal", color=color.new(color.green, 0), style=shape.triangleup, location=location.belowbar)
plotshape(series=showSellSignals ? shortCondition : na, title="Sell Signal", color=color.new(color.red, 0), style=shape.triangledown, location=location.abovebar)

// Plot Trailing Stop
plot(trailStop, color=color.new(color.red, 0), title="Trailing Stop")

// Plot HH, LL, LH, and HL zones
plotshape(series=showHHZone and ta.highest(high, 2)[1] and ta.highest(high, 2)[2] ? 1 : na, title="HH Zone", color=color.new(color.blue, 80), style=shape.triangleup, location=location.abovebar)
plotshape(series=showLLZone and ta.lowest(low, 2)[1] and ta.lowest(low, 2)[2] ? 1 : na, title="LL Zone", color=color.new(color.blue, 80), style=shape.triangledown, location=location.belowbar)
plotshape(series=showLHZone and ta.highest(high, 2)[1] and ta.lowest(low, 2)[2] ? 1 : na, title="LH Zone", color=color.new(color.orange, 80), style=shape.triangleup, location=location.abovebar)
plotshape(series=showHLZone and ta.lowest(low, 2)[1] and ta.highest(high, 2)[2] ? 1 : na, title="HL Zone", color=color.new(color.orange, 80), style=shape.triangledown, location=location.belowbar)
- इचिमोकू क्लाउड चार्ट के आधार पर एक प्रवृत्ति रणनीति अनुकूलन
- क्रॉस ट्रेंड रिवर्स तीन दस ऑसिलेटर दोहरी रणनीतियों के साथ संयुक्त
- मात्रात्मक व्यापार के लिए चलती औसत रणनीति के साथ फिबोनाची औसत मोमबत्ती
- प्रतिशत के आधार पर सरल ट्रेलिंग स्टॉप और खरीद रणनीति
- गौसियन त्रुटि फंक्शन के आधार पर मात्रात्मक ट्रेडिंग रणनीति का विश्लेषण
- आरएसआई रिवर्स रणनीति
- आरएसआई-वीडब्ल्यूएपी अल्पकालिक मात्रा रणनीति
- मध्यस्थता पर आधारित अनुकूलनशील क्रिप्टोकरेंसी ग्रिड ट्रेडिंग रणनीति
- एक दोहरी चलती औसत क्रॉसओवर रणनीति
- दोहरी चलती औसत ट्रेडिंग रणनीति
- बोलिंगर बैंड्स आधारित ट्रेंड फॉलो करने की रणनीति
- विस्तारित मूल्य परिमाण प्रवृत्ति रणनीति
- दोलन ट्रैकिंग अल्पकालिक रणनीति
- आक्रामक तल स्निपिंग मात्रात्मक रणनीति
- टी3 सूचक पर आधारित ट्रेडिंग रणनीति के बाद की प्रवृत्ति
- स्टोकैस्टिक सूचकांक पर आधारित अल्पकालिक ट्रेडिंग रणनीति
- लंदन एसएमए क्रॉस ईटीएच रिवर्सल ट्रेडिंग रणनीति
- एसएमए और एटीआर आधारित ट्रेंड ट्रैकिंग रणनीति
- हिलो एक्टिवेटर खरीदें बेचें सिग्नल रणनीति
- एक्सपोनेंशियल स्मूथ स्टोकैस्टिक ऑसिलेटर रणनीति