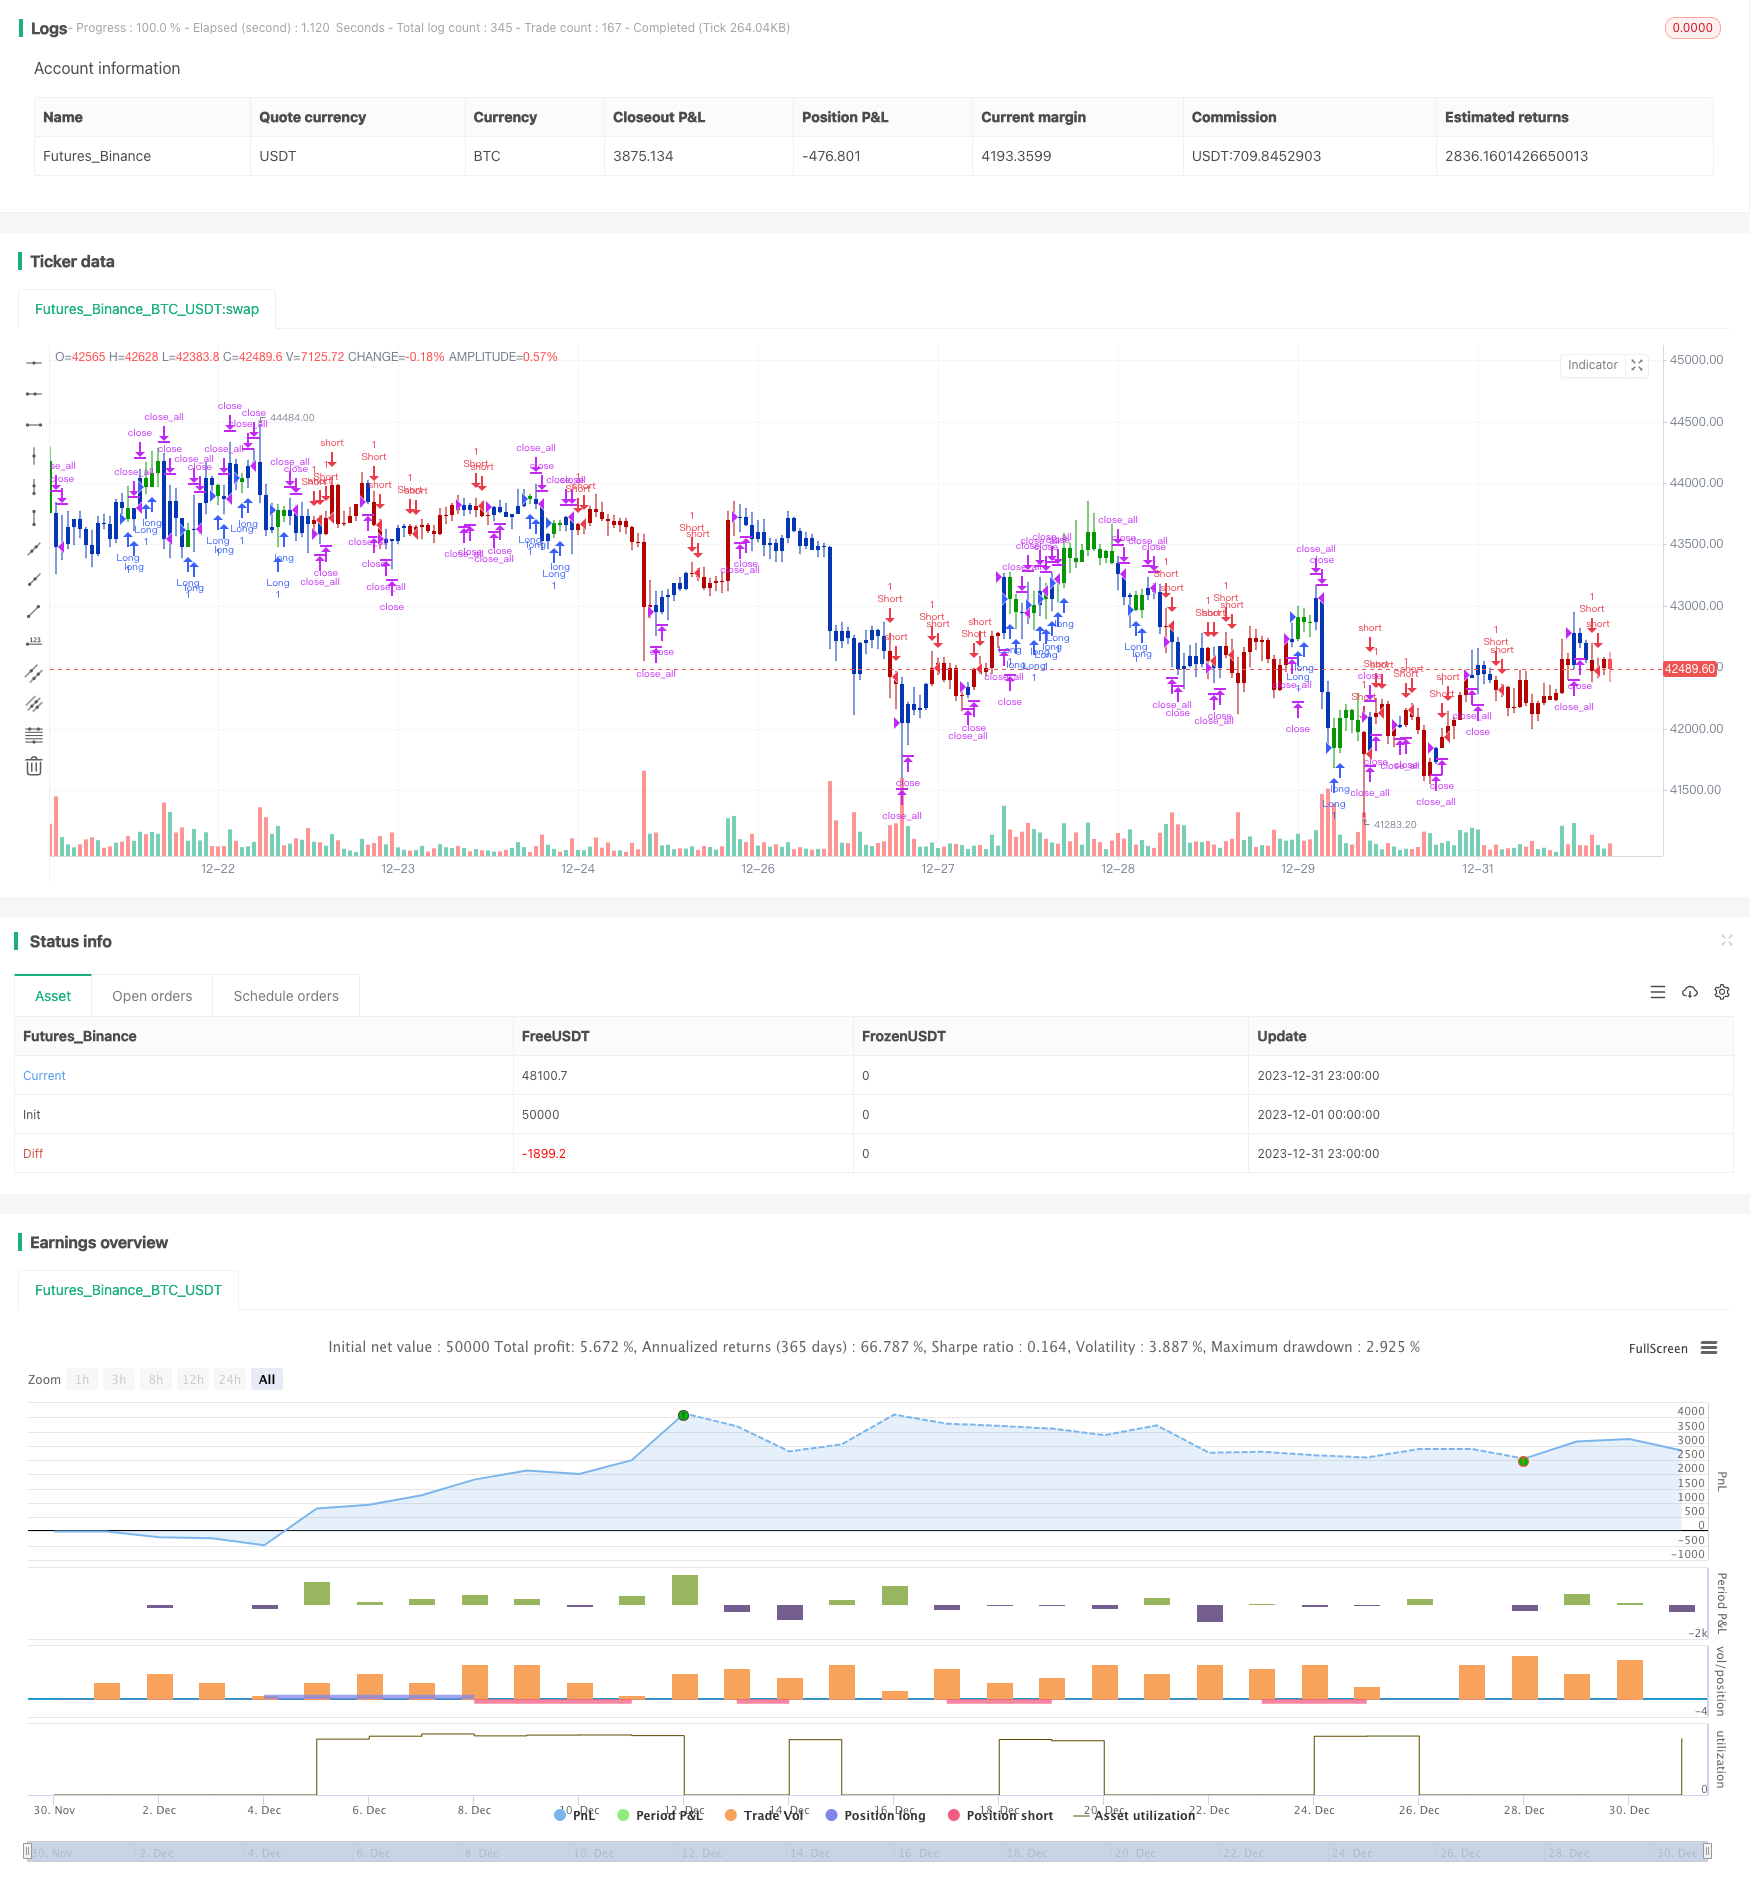
दोहरी चलती औसत और विलियम्स औसत संयोजन रणनीति
लेखक:चाओझांग, दिनांकः 2024-01-26 16:36:27टैगः

अवलोकन
रणनीति तर्क
लाभ विश्लेषण
जोखिम विश्लेषण
अनुकूलन दिशाएँ
निष्कर्ष
यह रणनीति दोहरी चलती औसत और विलियम्स चलती औसत के लाभों को मिलाकर ट्रेडिंग संकेतों के प्रभावी फ़िल्टरिंग का एहसास करती है, जो झूठे संकेतों को कम कर सकती है और होल्डिंग दक्षता में सुधार कर सकती है। यह बाजार की स्थिति के अनुसार पैरामीटर अनुकूलन के माध्यम से बेहतर प्रदर्शन प्राप्त कर सकती है, और इसमें बड़ी अनुप्रयोग क्षमता है। साथ ही, कठोर बाजार उतार-चढ़ाव के कारण होने वाले नुकसान को नियंत्रित करने के लिए जोखिम प्रबंधन की भी आवश्यकता होती है।
/*backtest
start: 2023-12-01 00:00:00
end: 2023-12-31 23:59:59
period: 1h
basePeriod: 15m
exchanges: [{"eid":"Futures_Binance","currency":"BTC_USDT"}]
*/

//@version=5
////////////////////////////////////////////////////////////
//  Copyright by HPotter v1.0 21/04/2022
// This is combo strategies for get a cumulative signal.
//
// First strategy
// This indicator plots 2/20 exponential moving average. For the Mov
// Avg X 2/20 Indicator, the EMA bar will be painted when the Alert criteria is met.
//
// Second strategy
// This indicator calculates 3 Moving Averages for default values of
// 13, 8 and 5 days, with displacement 8, 5 and 3 days: Median Price (High+Low/2).
// The most popular method of interpreting a moving average is to compare
// the relationship between a moving average of the security's price with
// the security's price itself (or between several moving averages).
//
//
// WARNING:
// - For purpose educate only
// - This script to change bars colors.
////////////////////////////////////////////////////////////
EMA20(Length) =>
    pos = 0.0
    xPrice = close
    xXA = ta.ema(xPrice, Length)
    nHH = math.max(high, high[1])
    nLL = math.min(low, low[1])
    nXS = nLL > xXA or nHH < xXA ? nLL : nHH
    iff_1 = nXS < close[1] ? 1 : nz(pos[1], 0)
    pos := nXS > close[1] ? -1 : iff_1
    pos


BWA3Lines(LLength,MLength,SLength,LOffset,MOffset,SOffset) =>
    pos = 0.0
    xLSma = ta.sma(hl2, LLength)[LOffset]
    xMSma = ta.sma(hl2, MLength)[MOffset]
    xSSma = ta.sma(hl2, SLength)[SOffset]
    pos := close < xSSma and xSSma < xMSma and xMSma < xLSma ? -1 :
    	     close > xSSma and xSSma > xMSma and xMSma > xLSma ? 1 : nz(pos[1], 0)
    pos

strategy(title='Combo 2/20 EMA & Bill Williams Averages. 3Lines', shorttitle='Combo', overlay=true)
var I1 = '●═════ 2/20 EMA ═════●'
Length = input.int(14, minval=1, group=I1)
var I2 = '●═════ 3Lines ═════●'
LLength = input.int(13, minval=1, group=I2)
MLength = input.int(8,minval=1, group=I2)
SLength = input.int(5,minval=1, group=I2)
LOffset = input.int(8,minval=1, group=I2)
MOffset = input.int(5,minval=1, group=I2)
SOffset = input.int(3,minval=1, group=I2)
var misc = '●═════ MISC ═════●'
reverse = input.bool(false, title='Trade reverse', group=misc)
var timePeriodHeader = '●═════ Time Start ═════●'
d = input.int(1, title='From Day', minval=1, maxval=31, group=timePeriodHeader)
m = input.int(1, title='From Month', minval=1, maxval=12, group=timePeriodHeader)
y = input.int(2005, title='From Year', minval=0, group=timePeriodHeader)
StartTrade = time > timestamp(y, m, d, 00, 00) ? true : false
posEMA20 = EMA20(Length)
prePosBWA3Lines = BWA3Lines(LLength,MLength,SLength,LOffset,MOffset,SOffset)
iff_1 = posEMA20 == -1 and prePosBWA3Lines == -1 and StartTrade ? -1 : 0
pos = posEMA20 == 1 and prePosBWA3Lines == 1 and StartTrade ? 1 : iff_1
iff_2 = reverse and pos == -1 ? 1 : pos
possig = reverse and pos == 1 ? -1 : iff_2
if possig == 1
    strategy.entry('Long', strategy.long)
if possig == -1
    strategy.entry('Short', strategy.short)
if possig == 0
    strategy.close_all()
barcolor(possig == -1 ? #b50404 : possig == 1 ? #079605 : #0536b3)
अधिक
- चलती औसत चैनल ब्रेकआउट रणनीति
- फिक्स्ड टाइम ब्रेकबैक परीक्षण रणनीति
- समय और अंतरिक्ष अनुकूलित बहु समय सीमा एमएसीडी रणनीति
- स्टॉक आरएसआई और एमएफआई पर आधारित मात्रात्मक ट्रेडिंग रणनीति
- बहु-संकेतक मिश्रित ट्रेडिंग रणनीति
- क्रॉसओवर ईएमए अल्पकालिक ट्रेडिंग रणनीति
- दोहरे ईएमए क्रॉसओवर के गतिशील स्टॉप लॉस पर आधारित रणनीति के बाद की प्रवृत्ति
- बुल मार्केट ब्रेकआउट डार्वस बॉक्स खरीद रणनीति
- सापेक्ष गति रणनीति
- तरंग प्रवृत्ति और क्वांट रणनीति के बाद वीडब्ल्यूएमए आधारित प्रवृत्ति
- अनुकूली त्रिगुट सुपरट्रेंड रणनीति
- चलती औसत क्रॉसओवर रणनीति
- बाज़ार साइफर तरंग बी स्वचालित व्यापार रणनीति
- महत्वपूर्ण रिवर्स बैकटेस्ट रणनीति
- गति के उलट व्यापार रणनीति