Cryptocurrency Spot Multi-Symbol Dual Moving Average Strategy (Pengajaran)
Penulis:Ninabadass, Dibuat: 2022-04-07 16:14:35, Diperbarui: 2022-04-08 09:13:58Cryptocurrency Spot Multi-Symbol Dual Moving Average Strategy (Pengajaran)
Atas permintaan pengguna kami di Forum bahwa mereka berharap memiliki strategi rata-rata bergerak ganda multi-simbol sebagai referensi desain, strategi rata-rata bergerak ganda multi-simbol akan diimplementasikan dalam berbagi hari ini.
Pemikiran Strategis
Logika strategi rata-rata bergerak ganda sangat sederhana, yaitu, dua rata-rata bergerak. Rata-rata bergerak dengan periode kecil (garis cepat) dan rata-rata bergerak dengan periode besar (garis lambat). Ketika dua garis memiliki salib emas (garis cepat melintasi garis lambat dari bawah), beli panjang, dan ketika dua garis memiliki salib mati (garis cepat ke bawah melintasi garis lambat dari atas), jual pendek. Untuk rata-rata bergerak, Kami menggunakan EMA.
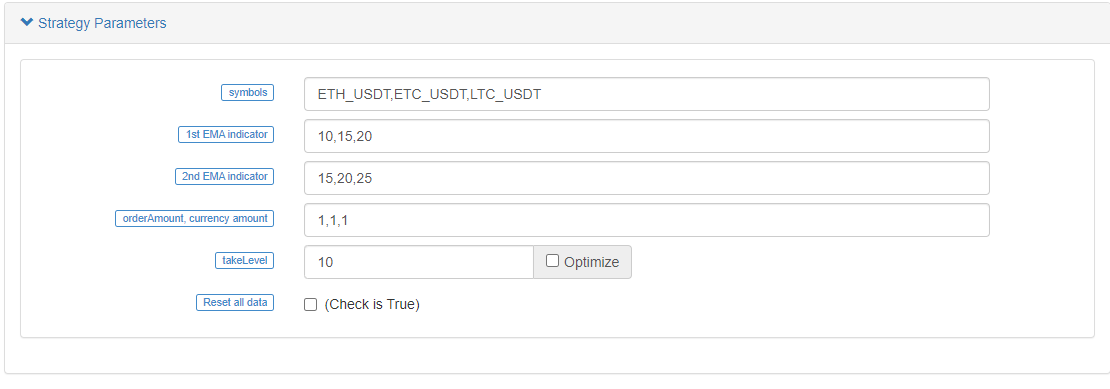
Hanya saja strategi perlu dirancang untuk beberapa simbol, sehingga parameter simbol yang berbeda mungkin berbeda (simbol yang berbeda menggunakan parameter rata-rata bergerak yang berbeda), sehingga perlu untuk merancang parameter dalam array

Parameter dirancang dalam bentuk string, dengan setiap parameter dibagi oleh koma. string ini dianalisis ketika strategi mulai berjalan, yang akan dicocokkan dengan logika eksekusi untuk setiap simbol (pasangan perdagangan). polling strategi mendeteksi kutipan pasar, dari semua simbol, pemicu kondisi perdagangan, dan cetak grafik. Setelah semua simbol disurvei sekali, data digabungkan dan informasi tabel ditampilkan di bilah status.
Strategi ini dirancang sangat sederhana dan sangat cocok untuk pemula; itu hanya dari 200+ baris total.
Kode Strategi
// function effect: to cancel all pending orders of the current trading pair
function cancelAll(e) {
    while (true) {
        var orders = _C(e.GetOrders)
        if (orders.length == 0) {
            break
        } else {
            for (var i = 0 ; i < orders.length ; i++) {
                e.CancelOrder(orders[i].Id, orders[i])
                Sleep(500)
            }
        }
        Sleep(500)
    }
}

// function effect: to calculate the real-time profit and loss
function getProfit(account, initAccount, lastPrices) {
    // account indicates the current account information; initAccount is the initial account information; lastPrices is the the latest prices of all current symbols
    var sum = 0
    _.each(account, function(val, key) {
        // traverse the current total assets, and calculate asset currency (except USDT) difference and amount difference
        if (key != "USDT" && typeof(initAccount[key]) == "number" && lastPrices[key + "_USDT"]) {
            sum += (account[key] - initAccount[key]) * lastPrices[key + "_USDT"]
        }
    })
    // return the asset profit and loss calculated by the current price
    return account["USDT"] - initAccount["USDT"] + sum
}

// function effect: to generate chart configuration
function createChartConfig(symbol, ema1Period, ema2Period) {
    // symbol indicates trading pair; ema1Period indicates the first EMA period; ema2Period indicates the second EMA period
    var chart = {
        __isStock: true,
        extension: {
                layout: 'single',
                height: 600,
        },
        title : { text : symbol},
        xAxis: { type: 'datetime'},
        series : [
            {
                type: 'candlestick',    // K-line date series
                name: symbol,
                id: symbol,
                data: []
            }, {
                type: 'line',           // EMA data series
                name: symbol + ',EMA1:' + ema1Period,
                data: [],
            }, {
                type: 'line',           // EMA data series
                name: symbol + ',EMA2:' + ema2Period,
                data: []
            }
        ]
    }
    return chart
}

function main() {
    // reset all data
    if (isReset) {
        _G(null)            // vacuum all persistently recorded data
        LogReset(1)         // vacuum all logs
        LogProfitReset()    // vacuum all profit logs
        LogVacuum()         // release the resource occupied by the bot database
        Log("reset all data", "#FF0000")   // print information
    }

    // parse parameters
    var arrSymbols = symbols.split(",")             // use comma to split the trading symbol strings
    var arrEma1Periods = ema1Periods.split(",")     // split the string of the first EMA parameter
    var arrEma2Periods = ema2Periods.split(",")     // split the string of the second EMA parameter
    var arrAmounts = orderAmounts.split(",")        // split the order amount of each symbol
    var account = {}                                // the variable used to record the current asset information
    var initAccount = {}                            // the variable used to record the initial asset information
    var currTradeMsg = {}                           // the variable used to record whether the current BAR is executed
    var lastPrices = {}                             // the variable used to record the latest price of the monitored symbol
    var lastBarTime = {}                            // the variable used to record the time of the latest BAR, to judge the BAR update during plotting
    var arrChartConfig = []                         // the variable used to record the chart configuration information, to plot

    if (_G("currTradeMsg")) {                       // for example, when restart, recover currTradeMsg data
        currTradeMsg = _G("currTradeMsg")
        Log("recover GetRecords", currTradeMsg)
    }

    // initialize account
    _.each(arrSymbols, function(symbol, index) {
        exchange.SetCurrency(symbol)
        var arrCurrencyName = symbol.split("_")
        var baseCurrency = arrCurrencyName[0]
        var quoteCurrency = arrCurrencyName[1]
        if (quoteCurrency != "USDT") {
            throw "only support quoteCurrency: USDT"
        }
        if (!account[baseCurrency] || !account[quoteCurrency]) {
            cancelAll(exchange)
            var acc = _C(exchange.GetAccount)
            account[baseCurrency] = acc.Stocks
            account[quoteCurrency] = acc.Balance
        }

        // initialize the related data of chart
        lastBarTime[symbol] = 0
        arrChartConfig.push(createChartConfig(symbol, arrEma1Periods[index], arrEma2Periods[index]))
    })
    if (_G("initAccount")) {
        initAccount = _G("initAccount")
        Log("recover initial account information", initAccount)
    } else {
        // use the current asset information to initialize initAccount (variable)
        _.each(account, function(val, key) {
            initAccount[key] = val
        })
    }
    Log("account:", account, "initAccount:", initAccount)   // print asset information

    // initialize the chart objects
    var chart = Chart(arrChartConfig)
    // reset chart
    chart.reset()

    // strategy logic of the main loop
    while (true) {
        // traverse all symbols, and execute the dual moving average logic one  by one
        _.each(arrSymbols, function(symbol, index) {
            exchange.SetCurrency(symbol)               // switch the trading pair to the trading pair recorded by by symbol string
            var arrCurrencyName = symbol.split("_")    // split trading pairs by "_"
            var baseCurrency = arrCurrencyName[0]      // string of base currency
            var quoteCurrency = arrCurrencyName[1]     // string of quote currency

            // according to index, obtain the EMA paramater of the current trading pair
            var ema1Period = parseFloat(arrEma1Periods[index])
            var ema2Period = parseFloat(arrEma2Periods[index])
            var amount = parseFloat(arrAmounts[index])

            // obtain the K-line data of the current trading pair
            var r = exchange.GetRecords()
            if (!r || r.length < Math.max(ema1Period, ema2Period)) {  // when the length of K-line is not long enough, return directly
                Sleep(1000)
                return
            }
            var currBarTime = r[r.length - 1].Time         // record the current BAR timestamp
            lastPrices[symbol] = r[r.length - 1].Close     //  record the current latest price

            var ema1 = TA.EMA(r, ema1Period)    // calculate EMA indicator
            var ema2 = TA.EMA(r, ema2Period)    // calculate EMA indicator
            if (ema1.length < 3 || ema2.length < 3) {    // when the length of EMA indicator array is too short, return derectly
                Sleep(1000)
                return
            }
            var ema1Last2 = ema1[ema1.length - 2]   // EMA on the second last BAR
            var ema1Last3 = ema1[ema1.length - 3]   // EMA on the third last BAR
            var ema2Last2 = ema2[ema2.length - 2]
            var ema2Last3 = ema2[ema2.length - 3]

            // write the chart data
            var klineIndex = index + 2 * index
            // traverse k-line data
            for (var i = 0 ; i < r.length ; i++) {
                if (r[i].Time == lastBarTime[symbol]) {         // plot; update the current BAR and its indicator
                    // update
                    chart.add(klineIndex, [r[i].Time, r[i].Open, r[i].High, r[i].Low, r[i].Close], -1)
                    chart.add(klineIndex + 1, [r[i].Time, ema1[i]], -1)
                    chart.add(klineIndex + 2, [r[i].Time, ema2[i]], -1)
                } else if (r[i].Time > lastBarTime[symbol]) {   // plot; add BAR and its indicator
                    // add
                    lastBarTime[symbol] = r[i].Time             // update the timestamp
                    chart.add(klineIndex, [r[i].Time, r[i].Open, r[i].High, r[i].Low, r[i].Close])
                    chart.add(klineIndex + 1, [r[i].Time, ema1[i]])
                    chart.add(klineIndex + 2, [r[i].Time, ema2[i]])
                }
            }

            if (ema1Last3 < ema2Last3 && ema1Last2 > ema2Last2 && currTradeMsg[symbol] != currBarTime) {
                // golden cross
                var depth = exchange.GetDepth()   // obtain the depth data of the current order book
                var price = depth.Asks[Math.min(takeLevel, depth.Asks.length)].Price   // select the 10th level price; taker
                if (depth && price * amount <= account[quoteCurrency]) {   // obtain that the depth data is normal, and the assets are enough to place an order
                    exchange.Buy(price, amount, ema1Last3, ema2Last3, ema1Last2, ema2Last2)   // maker; buy
                    cancelAll(exchange)     // cancel all pending orders
                    var acc = _C(exchange.GetAccount)   // obtain the account asset information
                    if (acc.Stocks != account[baseCurrency]) {  // detect the account assets changed
                        account[baseCurrency] = acc.Stocks      // update assets
                        account[quoteCurrency] = acc.Balance    // update assets
                        currTradeMsg[symbol] = currBarTime      // record the current BAR has been executed
                        _G("currTradeMsg", currTradeMsg)        // persistently record
                        var profit = getProfit(account, initAccount, lastPrices)  // calculate profit
                        if (profit) {
                            LogProfit(profit, account, initAccount)    // print profit
                        }
                    }
                }
            } else if (ema1Last3 > ema2Last3 && ema1Last2 < ema2Last2 && currTradeMsg[symbol] != currBarTime) {
                // death cross
                var depth = exchange.GetDepth()
                var price = depth.Bids[Math.min(takeLevel, depth.Bids.length)].Price
                if (depth && amount <= account[baseCurrency]) {
                    exchange.Sell(price, amount, ema1Last3, ema2Last3, ema1Last2, ema2Last2)
                    cancelAll(exchange)
                    var acc = _C(exchange.GetAccount)
                    if (acc.Stocks != account[baseCurrency]) {
                        account[baseCurrency] = acc.Stocks
                        account[quoteCurrency] = acc.Balance
                        currTradeMsg[symbol] = currBarTime
                        _G("currTradeMsg", currTradeMsg)
                        var profit = getProfit(account, initAccount, lastPrices)
                        if (profit) {
                            LogProfit(profit, account, initAccount)
                        }
                    }
                }
            }
            Sleep(1000)
        })

        // variables in the table of status bar
        var tbl = {
            type : "table",
            title : "account information",
            cols : [],
            rows : []
        }
        // write the data in the table structure of status bar
        tbl.cols.push("--")
        tbl.rows.push(["initial"])
        tbl.rows.push(["current"])
        _.each(account, function(val, key) {
            if (typeof(initAccount[key]) == "number") {
                tbl.cols.push(key)
                tbl.rows[0].push(initAccount[key])   // initial
                tbl.rows[1].push(val)                // current
            }
        })
        // display the status bar table
        LogStatus(_D(), "\n", "profit:", getProfit(account, initAccount, lastPrices), "\n", "`" + JSON.stringify(tbl) + "`")
    }
}
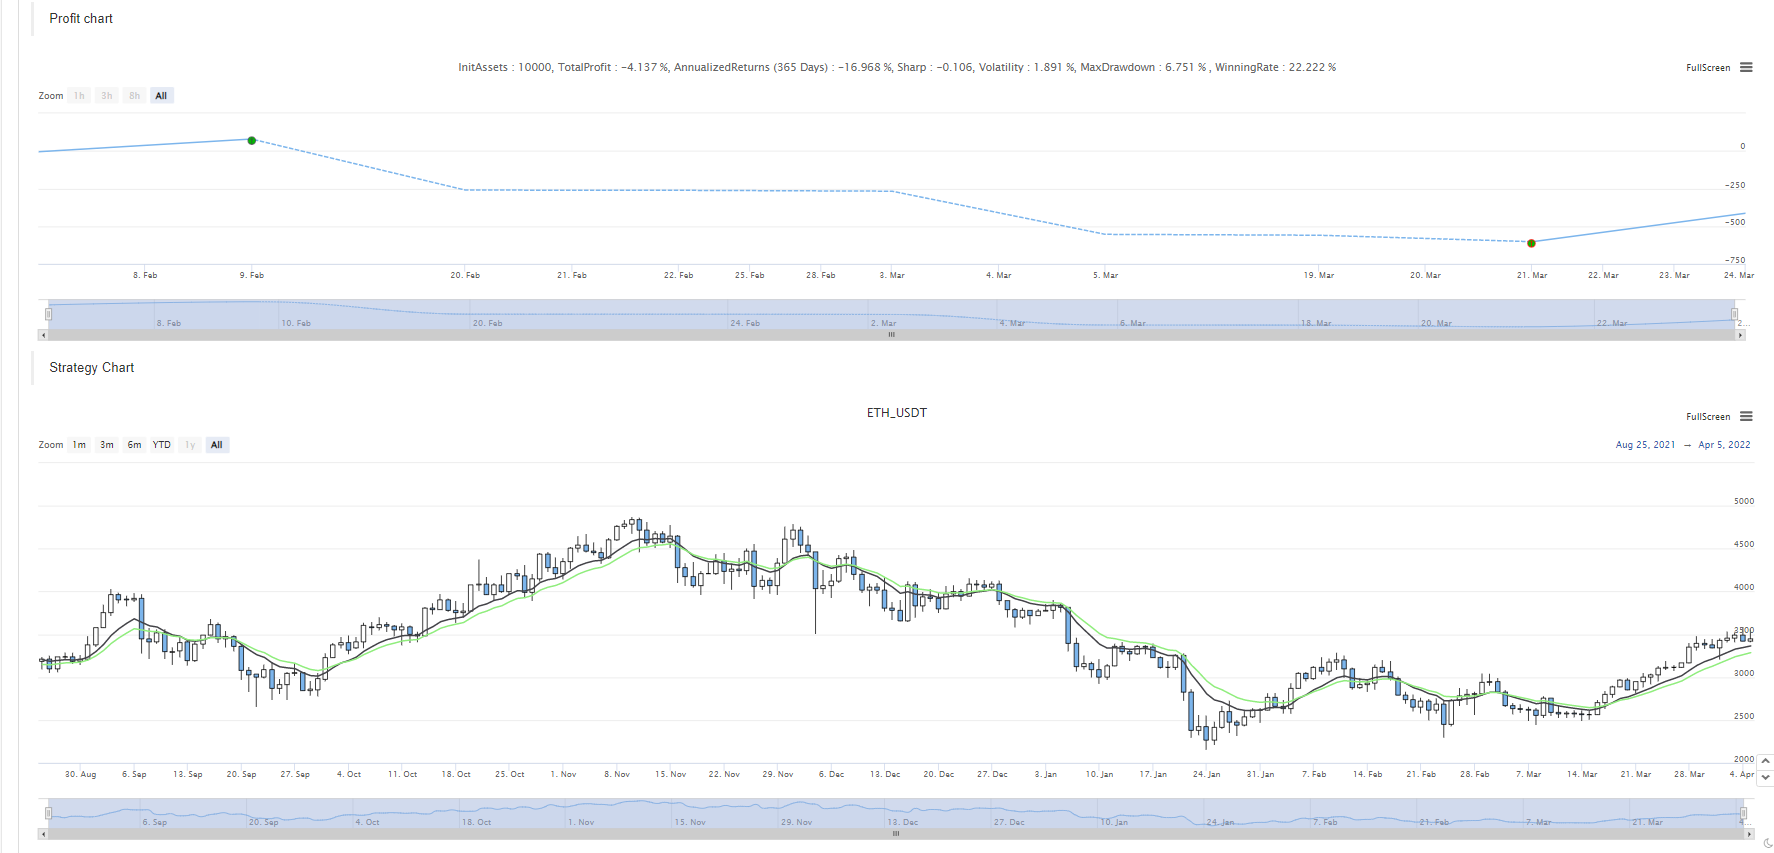
Strategi Backtest


Anda dapat melihat ETH, LTC dan ETC semua memiliki perdagangan sesuai dengan pemicu dari salib emas dan salib kematian rata-rata bergerak.

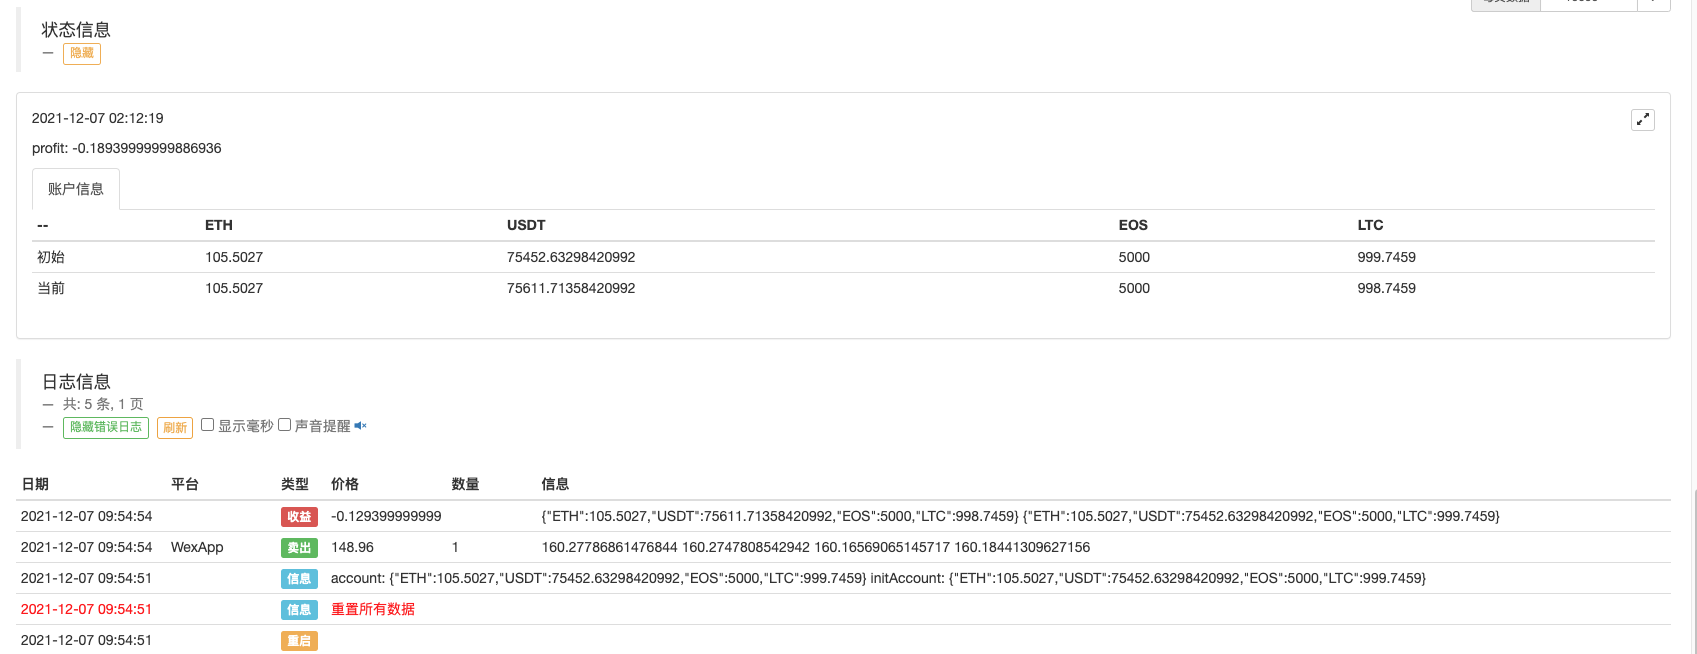
Anda juga bisa menunggu pada simulasi bot untuk diuji.
Kode sumber strategi:https://www.fmz.com/strategy/333783
Strategi ini hanya digunakan untuk backtest dan pembelajaran desain strategi, jadi gunakan dalam bot dengan hati-hati.
- FMZ sebagai platform pembayaran
- Kontrak Cryptocurrency Simple Order-Supervising Bot
- Saat menggunakan getdepth untuk mendapatkan timestamp yang sesuai
- Menghilangkan, menyelesaikan
- Masalah nilai muka
- Contoh Desain Strategi dYdX
- Eksplorasi Awal Menggunakan Python Crawler di FMZ
Crawling Binance Konten Pengumuman - Penelitian Desain Strategi Hedge & Contoh Tugas Spot dan Berjangka yang Ditunda
- Situasi terkini dan operasi yang direkomendasikan dari strategi suku bunga pendanaan
- Strategi titik putus rata-rata bergerak ganda untuk berjangka mata uang kripto (Pengajaran)
- Realisasi Fisher Indicator dalam JavaScript & Plotting pada FMZ
- Pengelola
- Ulasan TAQ Cryptocurrency 2021 & Strategi Simpel yang Hilang dari Peningkatan 10 Kali
- Cryptocurrency Futures Multi-Symbol ART Strategy (Pengajaran)
- Upgrade! Cryptocurrency Futures Strategi Martingale
- Fungsi Getrecords tidak dapat mengambil K-string diagram dalam satuan detik
- Desain Sistem Manajemen Sinkron Berbasis FMZ (2)
- Data volume yang dikembalikan Getticker tidak benar.
- Desain Sistem Manajemen Sinkron Berbasis FMZ (1)
- Merancang Perpustakaan Plot Multi-Chart