Upgrade! Cryptocurrency Futures Martingale Strategy
 0
0
 873
873
Upgrade! Cryptocurrency Futures Martingale Strategy
As a teaching strategy, it is best to take practice into consideration. “Cryptocurrency Futures Martingale Strategy” has also been displayed in the “Live” section of FMZ.COM for half a year. After several difficulties, Martingale and grid strategies have their own risks and flaws, and with conservatively set parameters, they can still be useful.
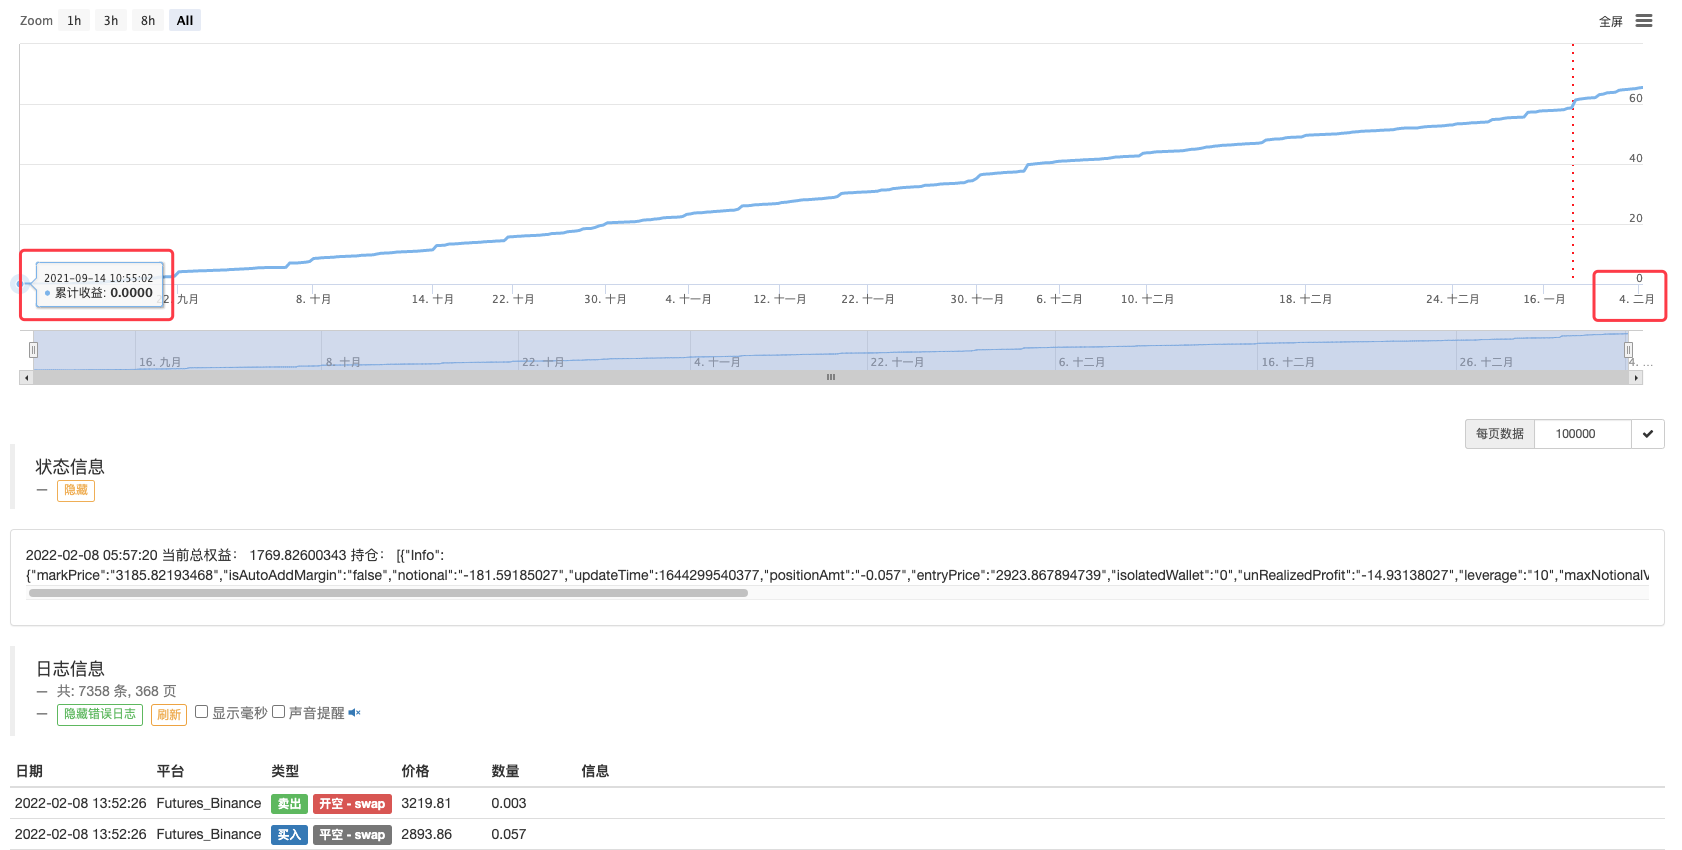
- Binance Futures Bot
- dYdX Bot
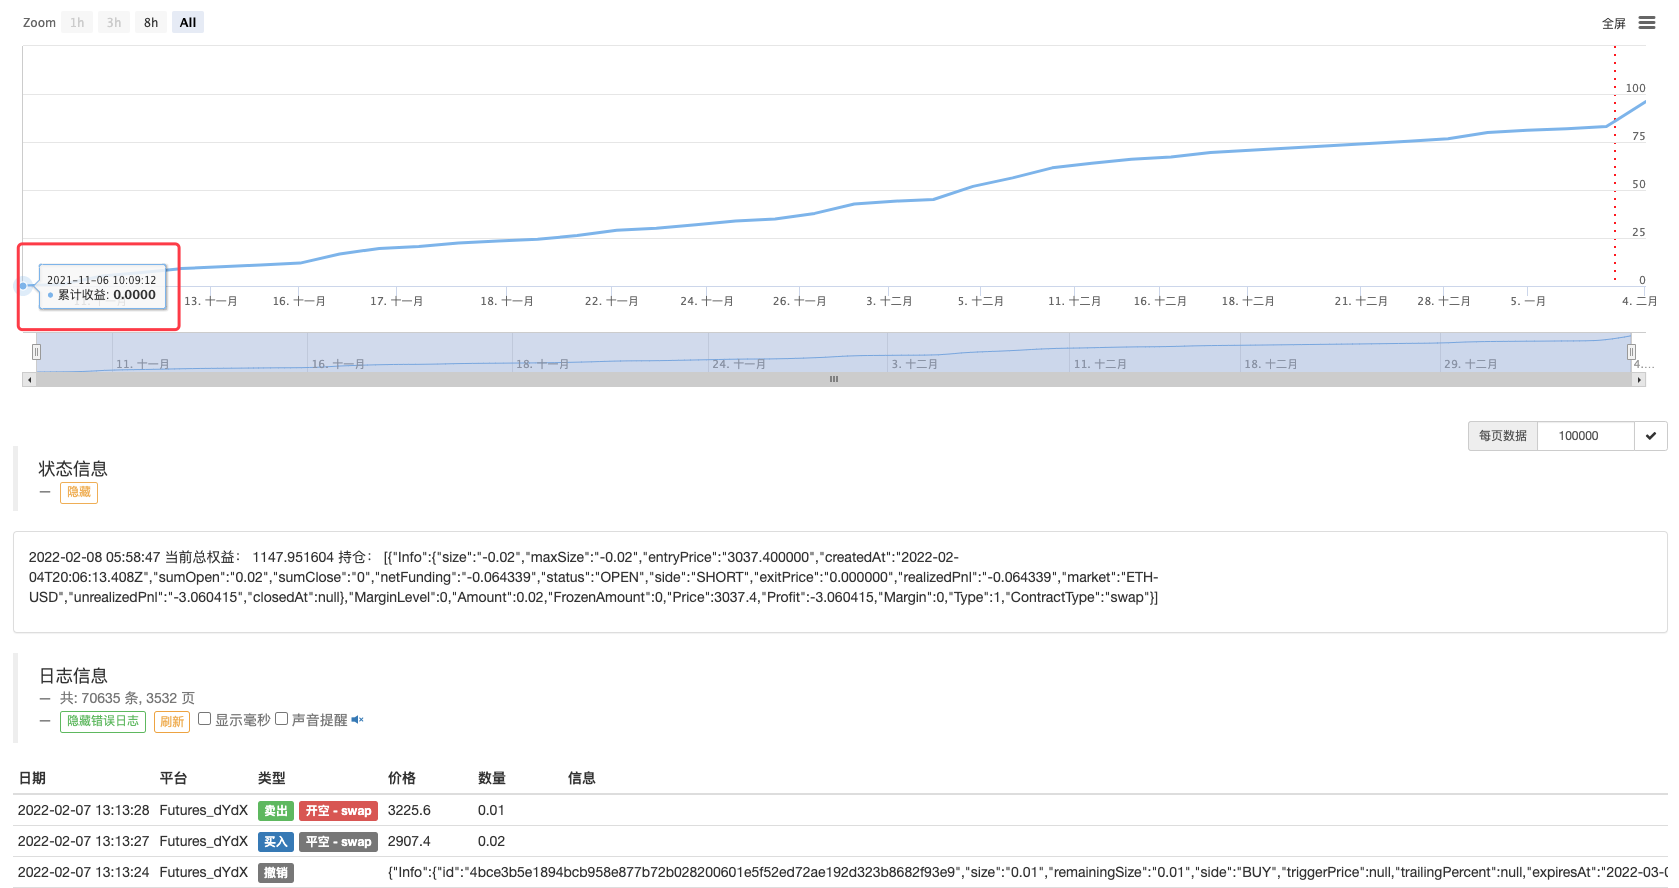
I always guarantees that there is absolutely no recharge for “creating” the yield curve.
It’s just that the strategy design of the first version is relatively simple and rough. There is only one position and total equity data export on the interface. The profit curve only prints the realized profit and loss, and does not count the floating loss. Many new students complained and asked to optimize the display.
In this article, I will work with you to upgrade the strategy, which has been stable and practical for half a year.
Upgrade Plan
- The status bar is updated to display information about the current position, rather than a mass of data being printed out. Display the current total equity, floating profit and loss, and actual profit and loss (the total profit and loss that has been included in the floating profit and loss)
- The market chart is displayed, and the current pending order position is displayed.
The version of the strategy before upgrade is recorded in the strategy’s “Note” page.

This is also my personal development habit. It is very convenient to record every bit of strategy development and iteration on FMZ.COM.
Start to upgrade!
First of all, let’s optimize the “status bar” display. Students who are familiar with FMZ development documentation know that the LogStatus function is used to display the status bar data on FMZ. Then, we find this entry point and start designing the code.
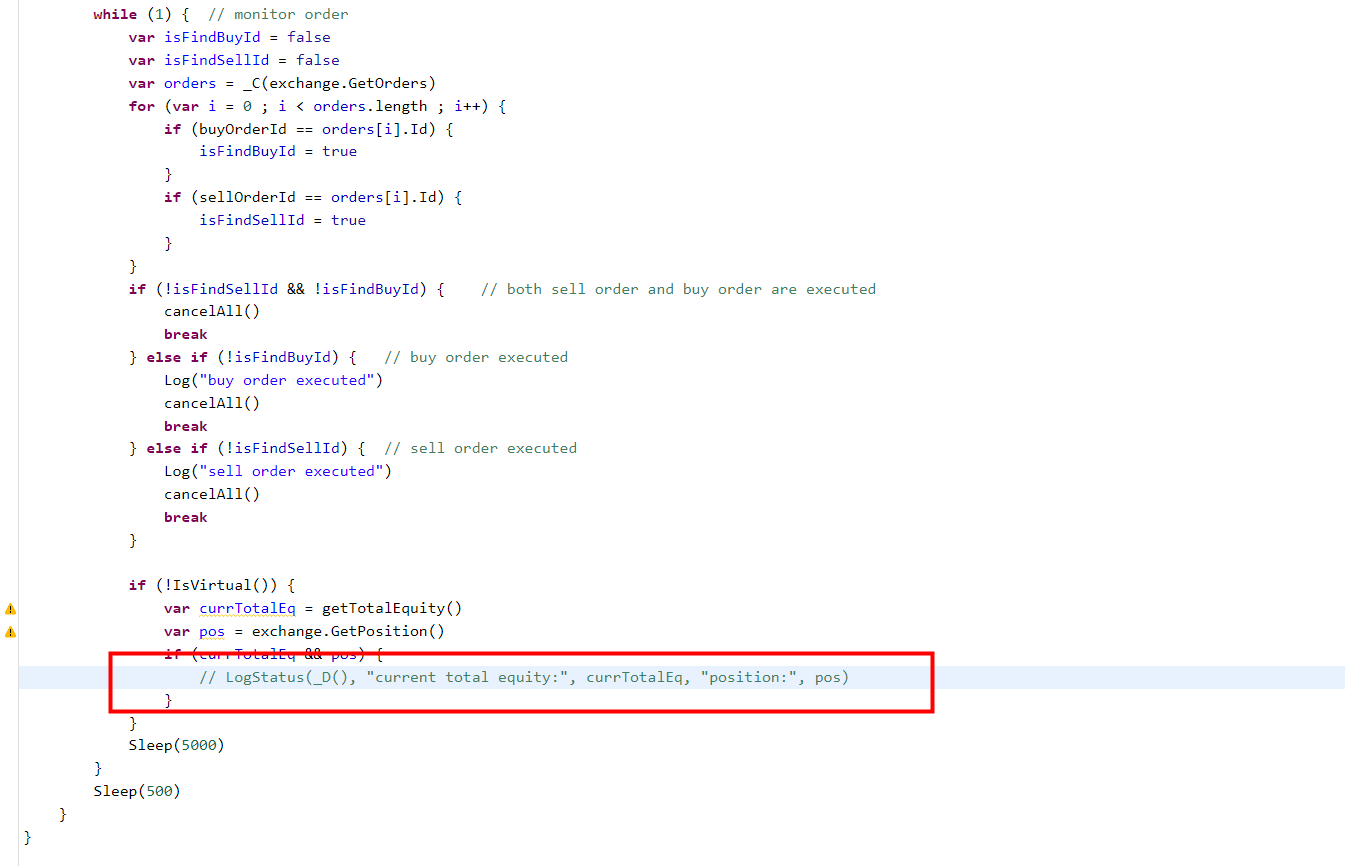
Next, add a large piece of code here:
                    var tblPos = {
                        "type" : "table",
                        "title" : "position",
                        "cols" : ["position amount", "position direction", "position average price", "position profit and loss", "contract code", "custom feild / " + SpecifyPosField],
                        "rows" : []
                    }
                    var descType = ["long position", "short position"]
                    for (var posIndex = 0 ; posIndex < pos.length ; posIndex++) {
                        tblPos.rows.push([pos[posIndex].Amount, descType[pos[posIndex].Type], pos[posIndex].Price, pos[posIndex].Profit, pos[posIndex].ContractType, SpecifyPosField == "" ? "--" : pos[posIndex].Info[SpecifyPosField]])
                    }

                    var tbl = {
                        "type" : "table",
                        "title" : "data",
                        "cols" : ["current total equity", "actual profit and loss", "current price", "buy order price/amount", "sell order price/amount"],
                        "rows" : []
                    }
                    var buyOrder = null
                    var sellOrder = null
                    for (var orderIndex = 0 ; orderIndex < orders.length ; orderIndex++) {
                        if (orders[orderIndex].Type == ORDER_TYPE_BUY) {
                            buyOrder = orders[orderIndex]
                        } else {
                            sellOrder = orders[orderIndex]
                        }
                    }
                    var realProfit = currTotalEq - totalEq
                    if (exchange.GetName() == "Futures_Binance") {
                        _.each(pos, function(p) {
                            realProfit += parseFloat(p.Info.unRealizedProfit)
                        })
                    }
                    var t = exchange.GetTicker()
                    tbl.rows.push([currTotalEq, realProfit, t ? t.Last : "--", (buyOrder.Price + "/" + buyOrder.Amount), (sellOrder.Price + "/" + sellOrder.Amount)])

                    // Update the chart data
                    if (t && showLine) {
                        _.each(pos, function(p) {
                            $.PlotLine(descType[p.Type] + "position price", p.Price)
                        })
                        $.PlotLine("buy order price", buyOrder.Price)
                        $.PlotLine("sell order price", sellOrder.Price)
                        $.PlotLine("current price", t.Last)
                    }

                    // Update the status bar data
                    LogStatus("time:" + _D() + "\n" + "`" + JSON.stringify(tblPos) + "`" + "\n" + "`" + JSON.stringify(tbl) + "`")
Replace the previous rough LogStatus export.
LogStatus(_D(), "Current total equity:", currTotalEq, "position:", pos)
The strategy has added 2 parameters:

showLine Check it, and you can use the line drawing library to draw on the bot page, and draw the position price, pending order price and the current price curves.
SpecifyPosField It is used to set the raw field of position information that needs to be displayed, because the name of the raw position data field of each platform is different. So here a custom parameter is designed to specify the field name to be displayed. Such as, my Binance bot:
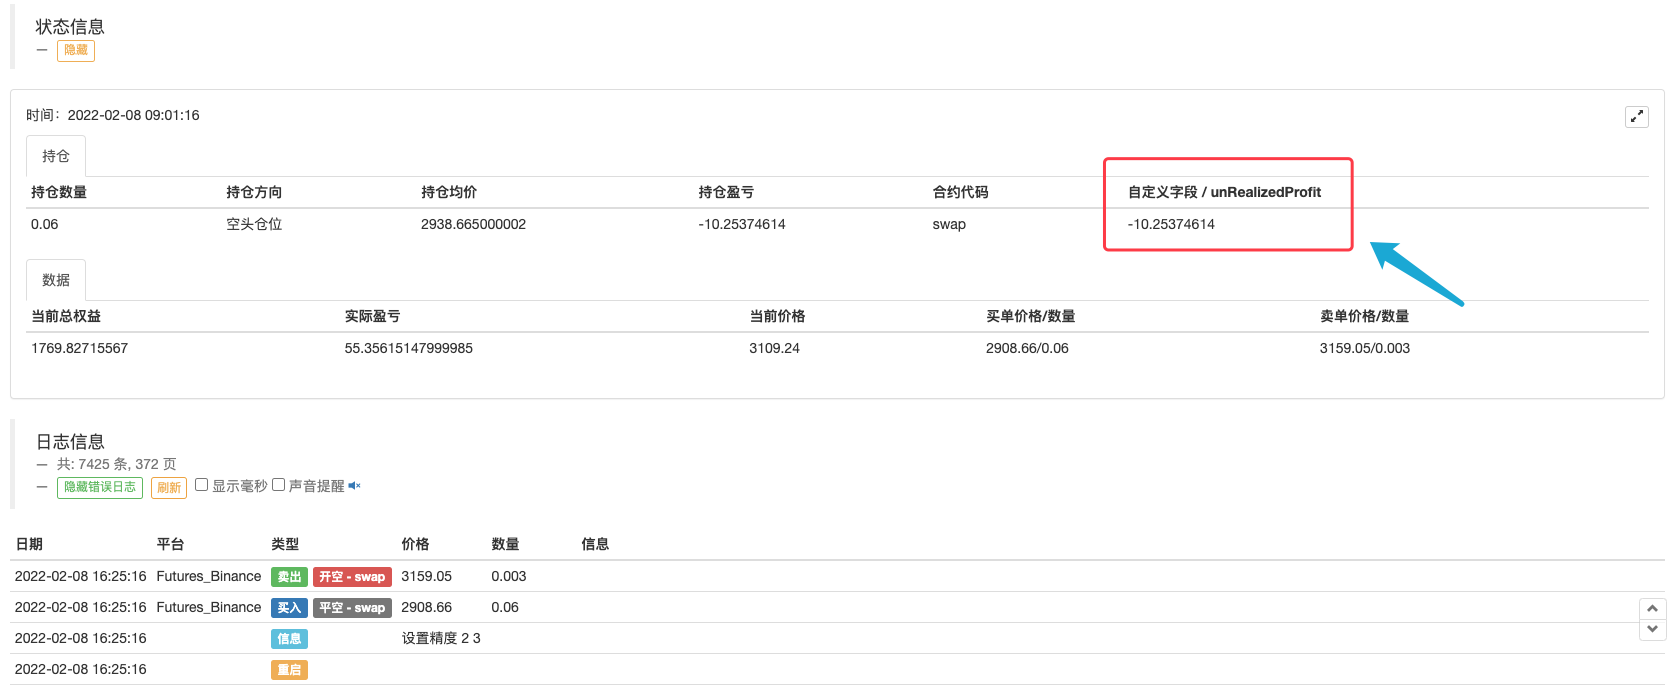
I want to display the unRealizedProfit attribute in the Info field of the position information data (raw data of the platform interface), that is, the position has not realized the profit or loss. You can set the parameter SpecifyPosField to unRealizedProfit, and displayed it in the status bar.
Such a similar design allows the strategy to adaptively export the non-uniform data, giving users the option of customizing the export content.
Restart the Bots of Binance and dYdX After Strategy Upgrade
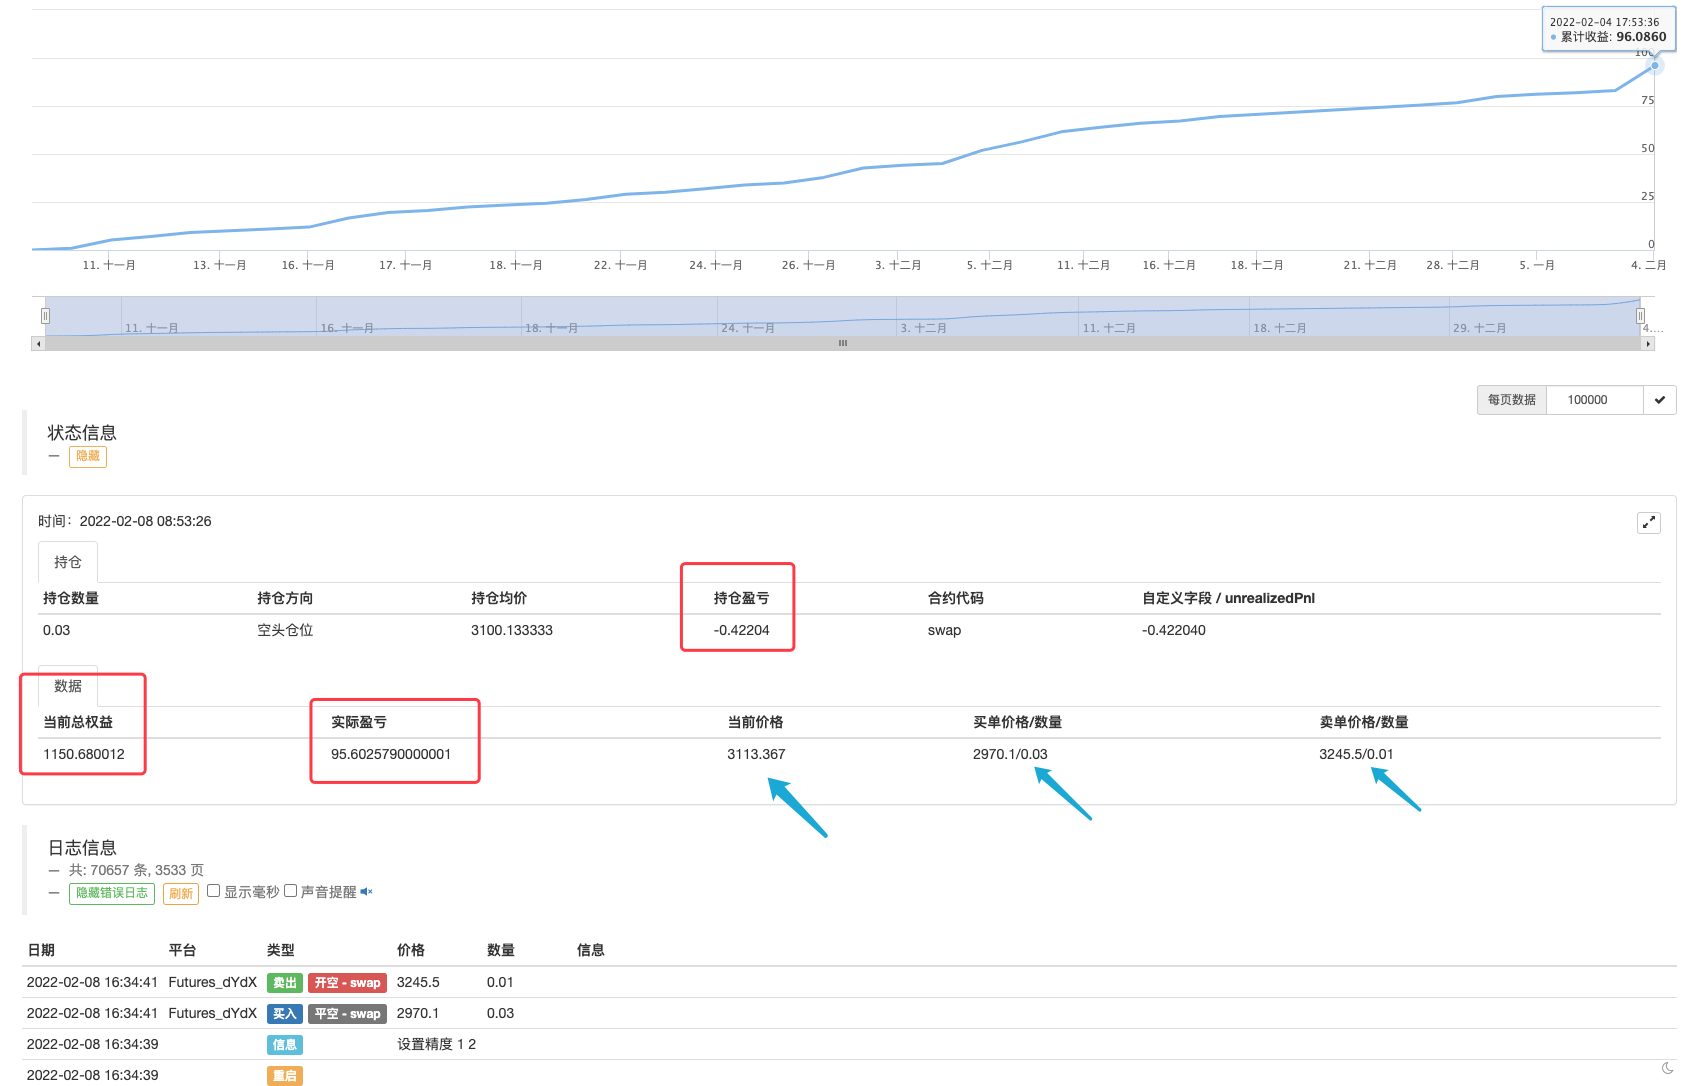
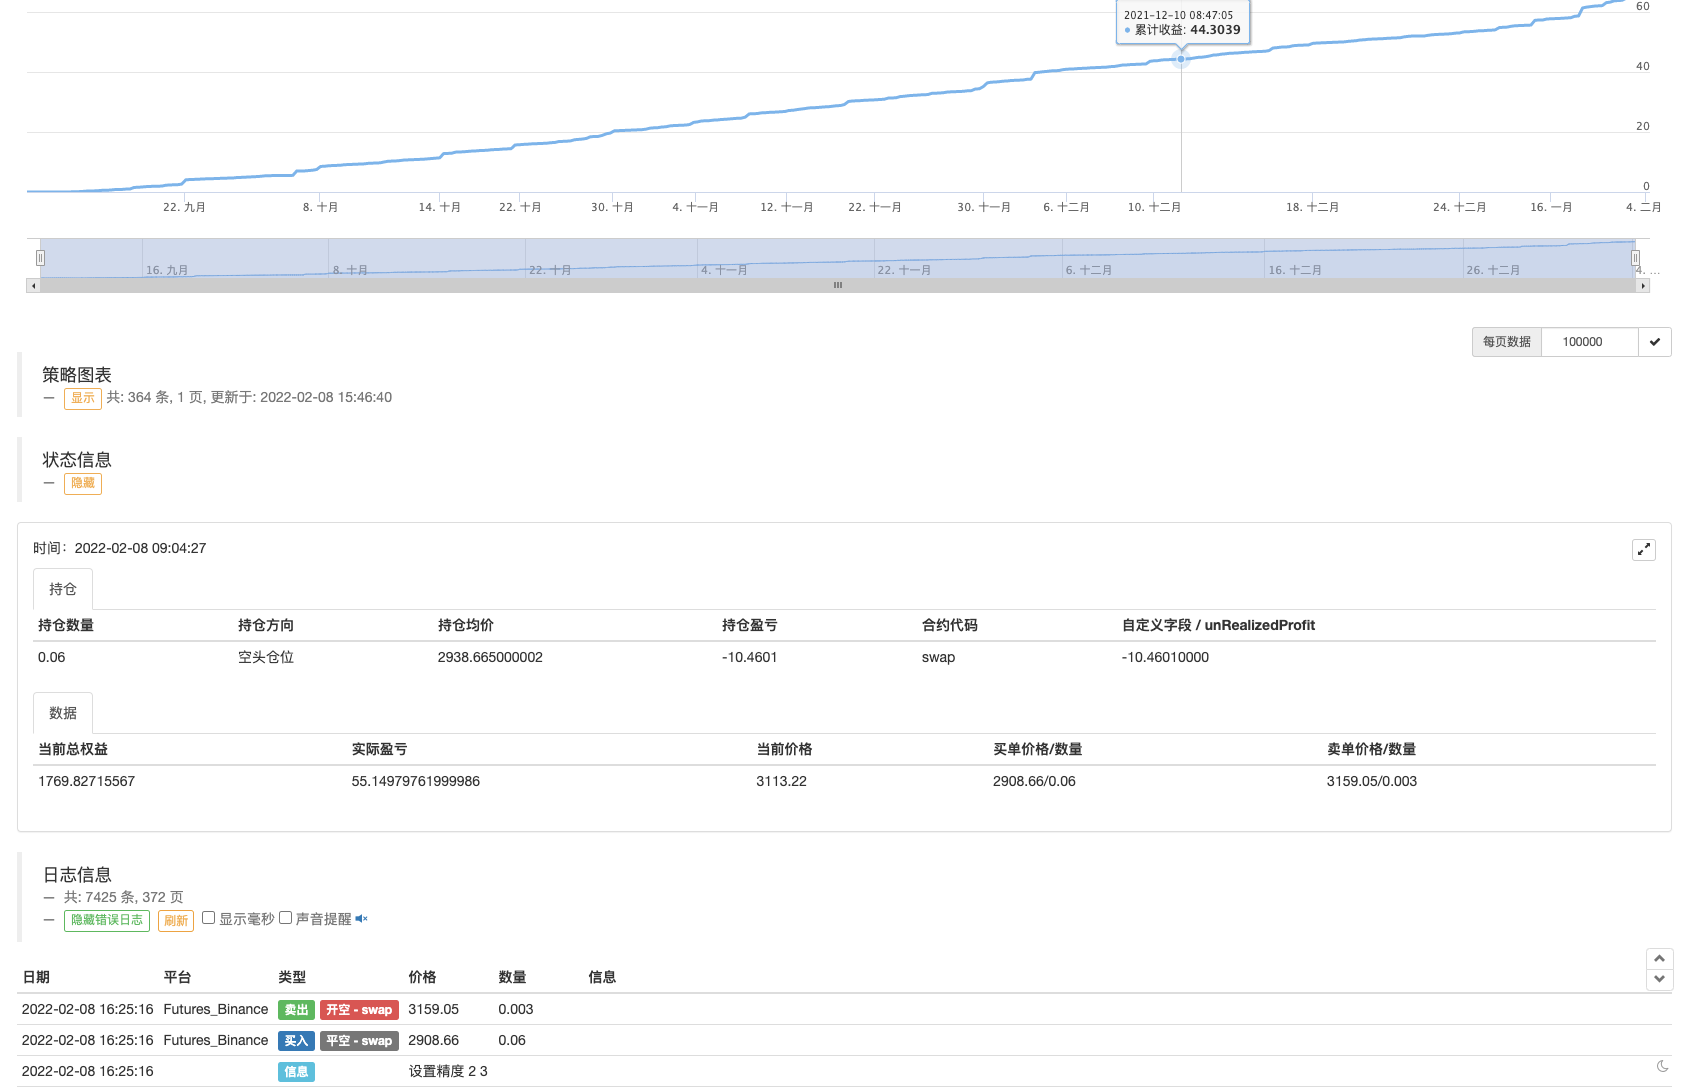
You can see the data that needs to be displayed at a glance. It is much more convenient to observe the trading progress of the strategy, the current position price, profit and loss, and the order price. The strategy has certain risks, and the bot will set specific parameters according to its own risk control, and be responsible for its own profits and losses. This strategy is disclosed only for communication and study.
- dYdX Strategy Design Example
- Initial Exploration of Applying Python Crawler on FMZ — Crawling Binance Announcement Content
- Hedge Strategy Design Research & Example of Pending Spot and Futures Orders
- Recent Situation and Recommended Operation of Funding Rate Strategy
- Dual Moving Average Breakpoint Strategy of Cryptocurrency Futures (Teaching)
- Cryptocurrency Spot Multi-Symbol Dual Moving Average Strategy (Teaching)
- Realization of Fisher Indicator in JavaScript & Plotting on FMZ
- 托管者
- 2021 Cryptocurrency TAQ Review & Simplest Missed Strategy of 10-Time Increase
- Cryptocurrency Futures Multi-Symbol ART Strategy (Teaching)
- Getrecords函数无法获取以秒为单位的K线图
- FMZ Based Order Synchronous Management System Design (2)
- Getticker返回的Volume数据不对
- FMZ Based Order Synchronous Management System Design (1)
- Design a Multiple-Chart Plotting Library
- 模拟盘环境
- 60-Line Code Realizing One Thought - Contract Bottom Fishing
- FMZ Billing System Upgrade & Adjustment Announcement
- Notice for Ghostwriting Strategies on FMZ
- 报错求助 Futures_OP 3: 504: The upstream server is timing out