Swing Highs/Lows & Pola Lilin
Penulis:ChaoZhang, Tanggal: 2022-05-07 21:12:40Tag:bullishberkurang
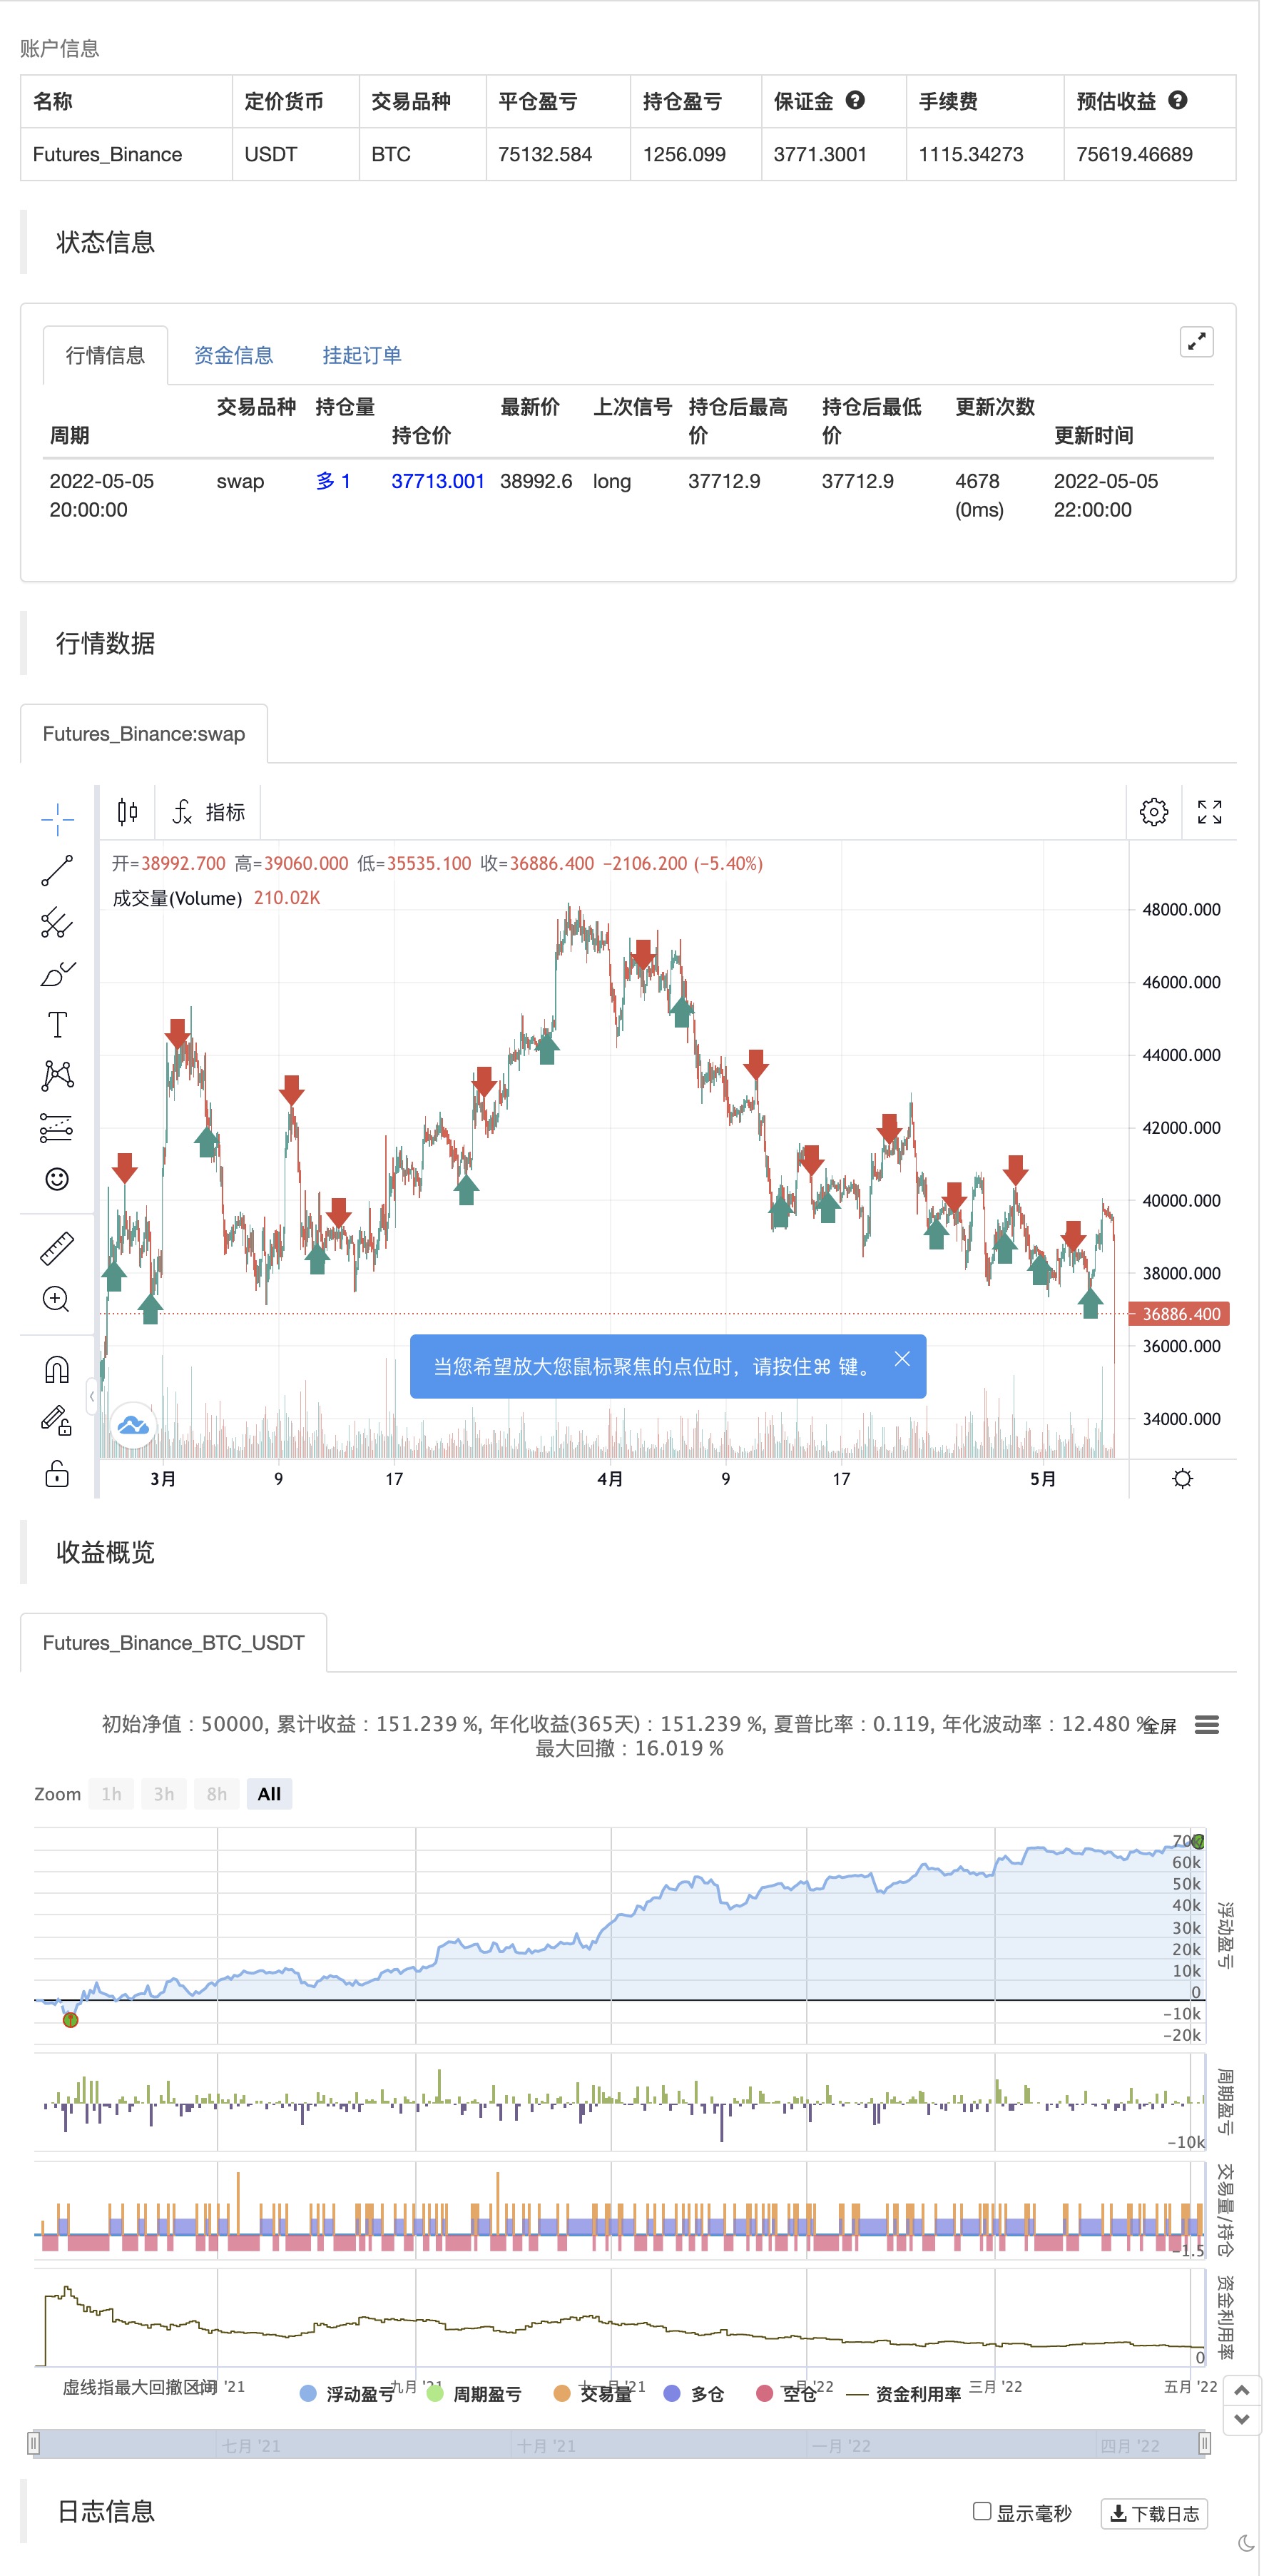
Skrip ini menandai swing high dan swing low serta pola lilin yang terjadi pada titik yang tepat. Skrip ini dapat mendeteksi 6 pola lilin berikut: hammer, inverse hammer, bullish engulfing, hanging man, shooting star, dan bearish engulfing.
Notasi HH, HL, LH, dan LL yang dapat Anda lihat pada label didefinisikan sebagai berikut:
HH: Tinggi tinggi HL: Tinggi rendah LH: rendah tinggi LL: rendah rendah
Pengaturan
Panjang: Sensitivitas deteksi swing tinggi/rendah, dengan nilai yang lebih rendah mengembalikan maksimum/minimum variasi harga jangka pendek.
Penggunaan & Rincian
Hal ini dapat menarik untuk melihat apakah atas atau bawah dikaitkan dengan pola lilin tertentu, ini memungkinkan kita untuk mempelajari potensi pola tersebut untuk menunjukkan pembalikan.
Perhatikan bahwa label tertolak, dan akan muncul di kemudian hari secara real-time, sebagai indikator ini tidak dimaksudkan untuk mendeteksi puncak/bawah secara real-time.
Nilai panjang yang lebih tinggi mungkin mengembalikan kesalahan.
backtest

/*backtest
start: 2021-05-06 00:00:00
end: 2022-05-05 23:59:00
period: 2h
basePeriod: 15m
exchanges: [{"eid":"Futures_Binance","currency":"BTC_USDT"}]
*/

// This work is licensed under a Attribution-NonCommercial-ShareAlike 4.0 International (CC BY-NC-SA 4.0) https://creativecommons.org/licenses/by-nc-sa/4.0/
// © LuxAlgo

//@version=4
study("Swing Highs/Lows & Candle Patterns",overlay=true)
length = input(21)
//------------------------------------------------------------------------------
o = open[length],h = high[length]
l = low[length],c = close[length]
//------------------------------------------------------------------------------
ph = pivothigh(close,length,length)
pl = pivotlow(open,length,length)
valH = valuewhen(ph,c,0)
valL = valuewhen(pl,c,0)
valpH = valuewhen(ph,c,1)
valpL = valuewhen(pl,c,1)
//------------------------------------------------------------------------------
d = abs(c - o)
hammer = pl and min(o,c) - l > d and h - max(c,o) < d
ihammer = pl and h - max(c,o) > d and min(c,o) - l < d
bulleng = c > o and c[1] < o[1] and c > o[1] and o < c[1]
hanging = ph and min(c,o) - l > d and h - max(o,c) < d
shooting = ph and h - max(o,c) > d and min(c,o) - l < d
beareng = c > o and c[1] < o[1] and c > o[1] and o < c[1]
//------------------------------------------------------------------------------
//Descriptions
//------------------------------------------------------------------------------
hammer_ = "The hammer candlestick pattern is formed of a short body with a long lower wick, and is found at the bottom of a downward trend."
  + "\n" + "\n A hammer shows that although there were selling pressures during the day, ultimately a strong buying pressure drove the price back up."
ihammer_ = "The inverted hammer is a similar pattern than the hammer pattern. The only difference being that the upper wick is long, while the lower wick is short."
  + "\n" + "\n It indicates a buying pressure, followed by a selling pressure that was not strong enough to drive the market price down. The inverse hammer suggests that buyers will soon have control of the market."
bulleng_ = "The bullish engulfing pattern is formed of two candlesticks. The first candle is a short red body that is completely engulfed by a larger green candle"
  + "\n" + "\n Though the second day opens lower than the first, the bullish market pushes the price up, culminating in an obvious win for buyers"
hanging_ = "The hanging man is the bearish equivalent of a hammer; it has the same shape but forms at the end of an uptrend."
  + "\n" + "It indicates that there was a significant sell-off during the day, but that buyers were able to push the price up again. The large sell-off is often seen as an indication that the bulls are losing control of the market."
shotting_ = "The shooting star is the same shape as the inverted hammer, but is formed in an uptrend: it has a small lower body, and a long upper wick."
  + "\n" + "Usually, the market will gap slightly higher on opening and rally to an intra-day high before closing at a price just above the open – like a star falling to the ground."
beareng_ = "A bearish engulfing pattern occurs at the end of an uptrend. The first candle has a small green body that is engulfed by a subsequent long red candle."
  + "\n" + "It signifies a peak or slowdown of price movement, and is a sign of an impending market downturn. The lower the second candle goes, the more significant the trend is likely to be."
//------------------------------------------------------------------------------
n = bar_index
label lbl = na
H = valH > valpH ? "HH" : valH < valpH ? "LH" : na
L = valL < valpL ? "LL" : valL > valpL ? "HL" : na
txt = hammer ? "Hammer" : ihammer ? "Inverse Hammer" :
  bulleng ? "Bullish Engulfing" : hanging ? "Hanging Man" :
  shooting ? "Shooting Star" : beareng ? "Bearish Engulfing" : "None"
des = hammer ? hammer_ : ihammer ? ihammer_ :
  bulleng ? bulleng_ : hanging ? hanging_ :
  shooting ? shotting_ : beareng ? beareng_ : ""

//------------------------------------------------------------------------------
if ph
    strategy.entry("Enter Long", strategy.long)
else if pl
    strategy.entry("Enter Short", strategy.short)
- ZigZag PA Strategi V4.1
- Demark Setup Indicator
- Broken Fractal: Mimpi seseorang yang hancur adalah keuntungan Anda!
- Lilin yang Menelan
- Strategi perdagangan kuantitatif untuk konversi kemungkinan rantai Markov
- Pemecahan Dukungan-Resistensi
- Tren reversal dua kerangka waktu K-line bentuk strategi perdagangan kuantitatif
- Strategi sinyal EMA yang bersilang dengan sinyal jangka pendek
- Strategi pengukuran reversal dan model optimasi volatilitas RSI
- Strategi untuk mengidentifikasi kondisi pasar dinamis berdasarkan gradien regresi linier
- MAGIC MACD
- Z Skor dengan Sinyal
- Kebijakan volatilitas yang sederhana dari Shinto dalam bahasa Pine
- 3EMA + Boullinger + PIVOT
- baguette dengan multigrain
- MillMachine
- Indikator pembalikan K I
- Lilin yang Menelan
- MA Kaisar Insiliconot
- Titik Pembalikan Demark
- TMA Overlay
- Strategi MACD + SMA 200
- Sistem CM Sling Shot
- Bollinger + RSI, Strategi Ganda v1.1
- Strategi Bollinger Bands
- Optimized Trend Tracker
- Pengembalian bulanan dalam Strategi PineScript
- ADX dan DI untuk v4
- MacD Custom Indicator-Multiple Time Frame+Semua Pilihan Tersedia!
- Indikator: WaveTrend Oscillator