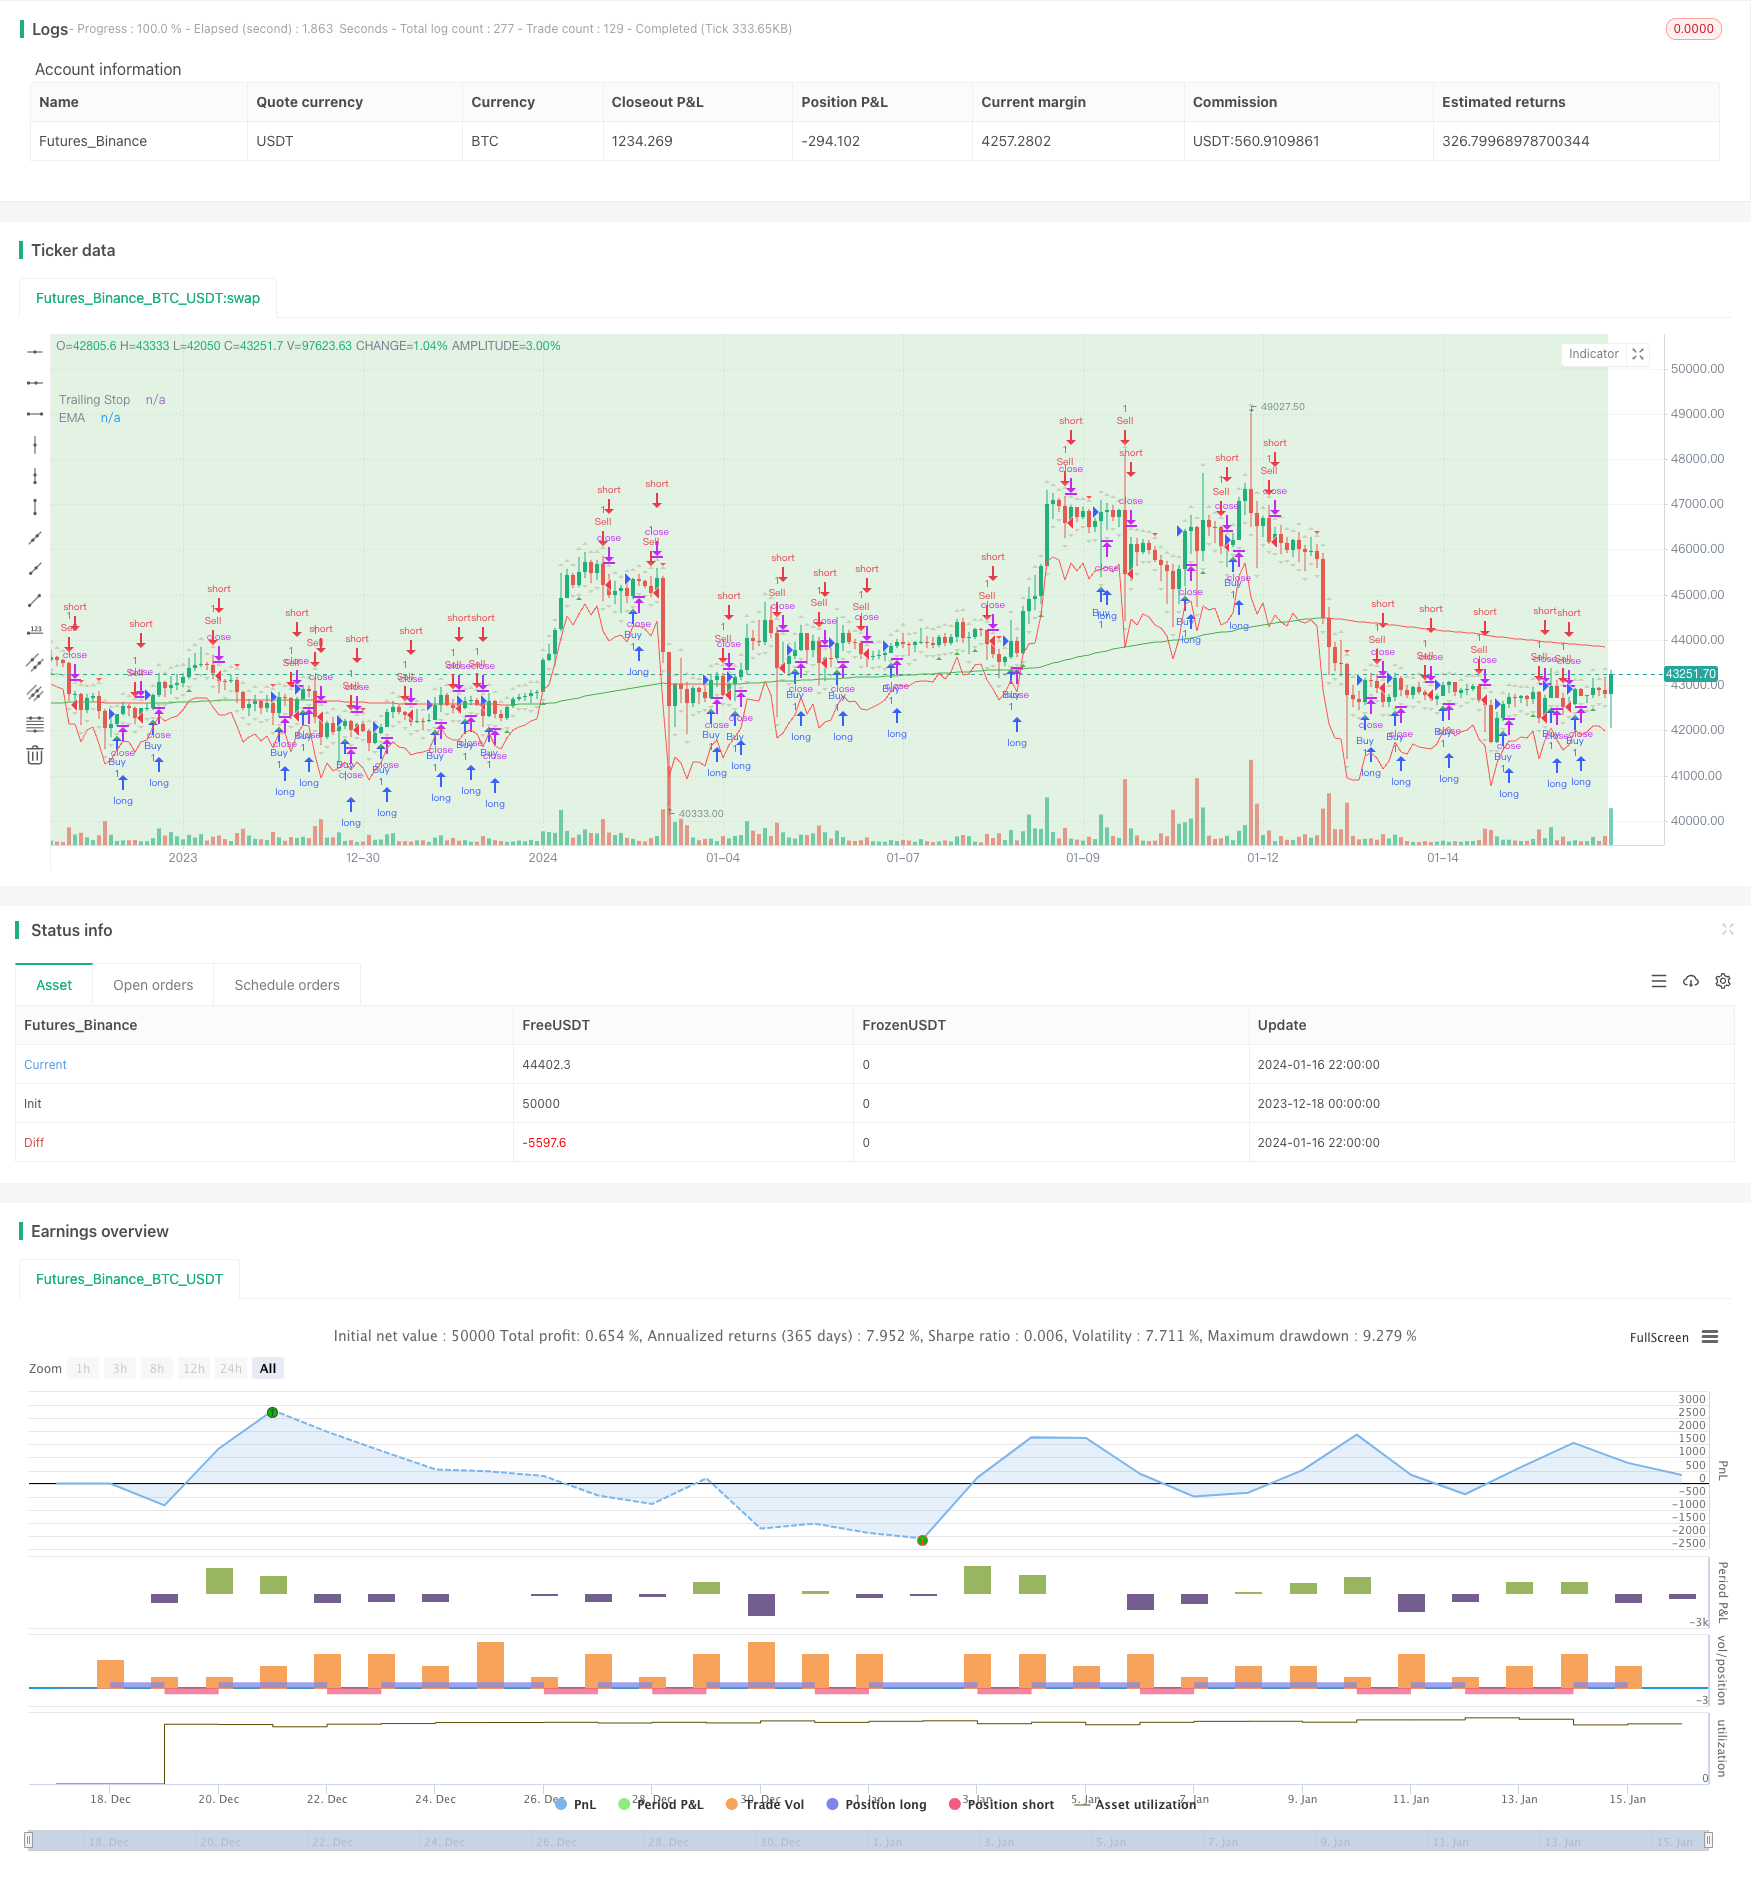
Strategi perdagangan berdasarkan zona penawaran dan permintaan dengan EMA dan Trailing Stop
Penulis:ChaoZhang, Tanggal: 2024-01-18 16:41:16Tag:

Gambaran umum
Strategi ini menggunakan zona penawaran dan permintaan, Rata-rata Gerak Eksponensial (EMA), dan Rata-rata Benar Jangkauan (ATR) trailing stop untuk sinyal perdagangan. Pengguna dapat menyesuaikan pengaturan EMA dan visibilitas sinyal. Strategi menandai zona Tinggi Tinggi (HH), Rendah Rendah (LL), Tinggi Rendah (LH), dan Rendah Tinggi (HL). Sinyal ditampilkan setelah lilin ketiga, cocok untuk backtesting.
Logika Strategi
Perhitungan Indikator
Rata-rata Gerak Eksponensial (EMA):
- EMA dihitung dari harga penutupan selama periode (default: 200).
- Rumus: EMA = (Price_t x α) + (EMA_t-1 x (1 - α)), di mana α = 2/(panjang + 1)
Rata-rata rentang nyata (ATR):
- ATR mengukur volatilitas pasar dari rentang harga yang sebenarnya.
- Jangkauan sebenarnya adalah yang terbesar dari:
- arus tinggi dikurangi arus rendah
- Nilai absolut tertinggi saat ini dikurangi penutupan sebelumnya
- Nilai absolut dari rendah saat ini dikurangi penutupan sebelumnya
- ATR biasanya menggunakan 14 periode.
Digunakan untuk menentukan EMA untuk tren dan ATR untuk volatility-based trailing stop.
Identifikasi Zona Pasokan dan Permintaan
Ini mengidentifikasi pola
-
Tinggi Tinggi (HH): Puncak saat ini > puncak sebelumnya, momentum naik.
-
Bawah Bawah (LL): Air terjun saat ini < air terjun sebelumnya, momentum menurun.
-
Tinggi Rendah (HL): Tepi saat ini > Tepi sebelumnya, kelanjutan ke atas.
-
Tingkat Tinggi Rendah (LH): Puncak saat ini < puncak sebelumnya, kelanjutan ke bawah.
Digunakan dengan tren untuk mengidentifikasi pembalikan atau kelanjutan.
Masuk dan Keluar
Sinyal masuk: Beli/jual pada penutupan lilin ketiga di atas/di bawah tinggi/rendah sebelumnya.
Keluar: Stop loss yang mengikuti berdasarkan ATR.
Keuntungan
- Menggabungkan tren, pembalikan, volatilitas untuk sinyal yang kuat.
- Zona permintaan/penawaran mengidentifikasi S/R utama.
- Dinamis ATR berhenti menyesuaikan dengan volatilitas.
- Parameter yang dapat disesuaikan.
- Aturan masuk yang sederhana.
Risiko dan Peningkatan
- Sinyal palsu: Optimalkan panjang EMA.
- Risiko pengganda ATR tinggi mengejar tren.
- Pertimbangkan filter tambahan pada entri.
- Uji pendekatan yang berfokus pada tren.
Kesimpulan
Menggabungkan beberapa teknik untuk backtesting yang layak. dunia nyata rumit, optimasi adalah kunci. strategi dasar memungkinkan ekstensi dan kombinasi.
/*backtest
start: 2023-12-18 00:00:00
end: 2024-01-17 00:00:00
period: 2h
basePeriod: 15m
exchanges: [{"eid":"Futures_Binance","currency":"BTC_USDT"}]
*/

//@version=5
strategy("Supply and Demand Zones with EMA and Trailing Stop", shorttitle="SD Zones", overlay=true)

showBuySignals = input(true, title="Show Buy Signals", group="Signals")
showSellSignals = input(true, title="Show Sell Signals", group="Signals")
showHLZone = input(true, title="Show HL Zone", group="Zones")
showLHZone = input(true, title="Show LH Zone", group="Zones")
showHHZone = input(true, title="Show HH Zone", group="Zones")
showLLZone = input(true, title="Show LL Zone", group="Zones")

emaLength = input(200, title="EMA Length", group="EMA Settings")
atrLength = input(14, title="ATR Length", group="Trailing Stop")
atrMultiplier = input(2, title="ATR Multiplier", group="Trailing Stop")

// Function to identify supply and demand zones
getZones(src, len, mult) =>
    base = request.security(syminfo.tickerid, "D", close)
    upper = request.security(syminfo.tickerid, "D", high)
    lower = request.security(syminfo.tickerid, "D", low)
    multiplier = request.security(syminfo.tickerid, "D", mult)
    zonetype = base + multiplier * len
    zone = src >= zonetype
    [zone, upper, lower]

// Identify supply and demand zones
[supplyZone, _, _] = getZones(close, high[1] - low[1], 1)
[demandZone, _, _] = getZones(close, high[1] - low[1], -1)

// Plot supply and demand zones
bgcolor(supplyZone ? color.new(color.red, 80) : na)
bgcolor(demandZone ? color.new(color.green, 80) : na)

// EMA with Linear Weighted method
ema = ta.ema(close, emaLength)

// Color code EMA based on its relation to candles
emaColor = close > ema ? color.new(color.green, 0) : close < ema ? color.new(color.red, 0) : color.new(color.yellow, 0)

// Plot EMA
plot(ema, color=emaColor, title="EMA")

// Entry Signal Conditions after the third candle
longCondition = ta.crossover(close, high[1]) and bar_index >= 2
shortCondition = ta.crossunder(close, low[1]) and bar_index >= 2

// Trailing Stop using ATR
atrValue = ta.atr(atrLength)
trailStop = close - atrMultiplier * atrValue

// Strategy Entry and Exit
if (longCondition)
    strategy.entry("Buy", strategy.long)
    strategy.exit("TrailStop", from_entry="Buy", loss=trailStop)

if (shortCondition)
    strategy.entry("Sell", strategy.short)
    strategy.exit("TrailStop", from_entry="Sell", loss=trailStop)

// Plot Entry Signals
plotshape(series=showBuySignals ? longCondition : na, title="Buy Signal", color=color.new(color.green, 0), style=shape.triangleup, location=location.belowbar)
plotshape(series=showSellSignals ? shortCondition : na, title="Sell Signal", color=color.new(color.red, 0), style=shape.triangledown, location=location.abovebar)

// Plot Trailing Stop
plot(trailStop, color=color.new(color.red, 0), title="Trailing Stop")

// Plot HH, LL, LH, and HL zones
plotshape(series=showHHZone and ta.highest(high, 2)[1] and ta.highest(high, 2)[2] ? 1 : na, title="HH Zone", color=color.new(color.blue, 80), style=shape.triangleup, location=location.abovebar)
plotshape(series=showLLZone and ta.lowest(low, 2)[1] and ta.lowest(low, 2)[2] ? 1 : na, title="LL Zone", color=color.new(color.blue, 80), style=shape.triangledown, location=location.belowbar)
plotshape(series=showLHZone and ta.highest(high, 2)[1] and ta.lowest(low, 2)[2] ? 1 : na, title="LH Zone", color=color.new(color.orange, 80), style=shape.triangleup, location=location.abovebar)
plotshape(series=showHLZone and ta.lowest(low, 2)[1] and ta.highest(high, 2)[2] ? 1 : na, title="HL Zone", color=color.new(color.orange, 80), style=shape.triangledown, location=location.belowbar)
- Optimasi Strategi Tren Berdasarkan Bagan Awan Ichimoku
- Peralihan Tren silang dikombinasikan dengan Tiga Strategi Dual Osilator
- Lilin Rata-rata Fibonacci dengan Strategi Rata-rata Bergerak untuk Perdagangan Kuantitatif
- Strategi Stop & Buy yang sederhana berdasarkan Persentase
- Analisis Strategi Perdagangan Kuantitatif Berdasarkan Fungsi Kesalahan Gaussian
- RSI Reversal Strategi
- RSI-VWAP Strategi Quant jangka pendek
- Adaptive Cryptocurrency Grid Trading Strategy Berdasarkan Arbitrage
- Strategi Crossover Rata-rata Bergerak Ganda
- Strategi Perdagangan Rata-rata Bergerak Ganda
- Bollinger Bands Berbasis Tren Mengikuti Strategi
- Strategi Tren Volume Harga yang diperluas
- Strategi Pelacakan osilasi jangka pendek
- Strategi Kuantitatif yang Agresif
- Tren Mengikuti Strategi Perdagangan Berdasarkan Indikator T3
- Strategi Trading Jangka Pendek Berdasarkan Indeks Stochastic
- London SMA Cross ETH Reversal Trading Strategi
- Strategi Pelacakan Tren Berdasarkan SMA dan ATR
- Hilo Activator Strategi sinyal Beli Jual
- Strategi Osilator Stochastic Eksponensial Diatasi