Strategi Tren Bullish Multi-EMA
Penulis:ChaoZhang, Tanggal: 2024-01-22 12:04:05Tag:

Gambaran umum
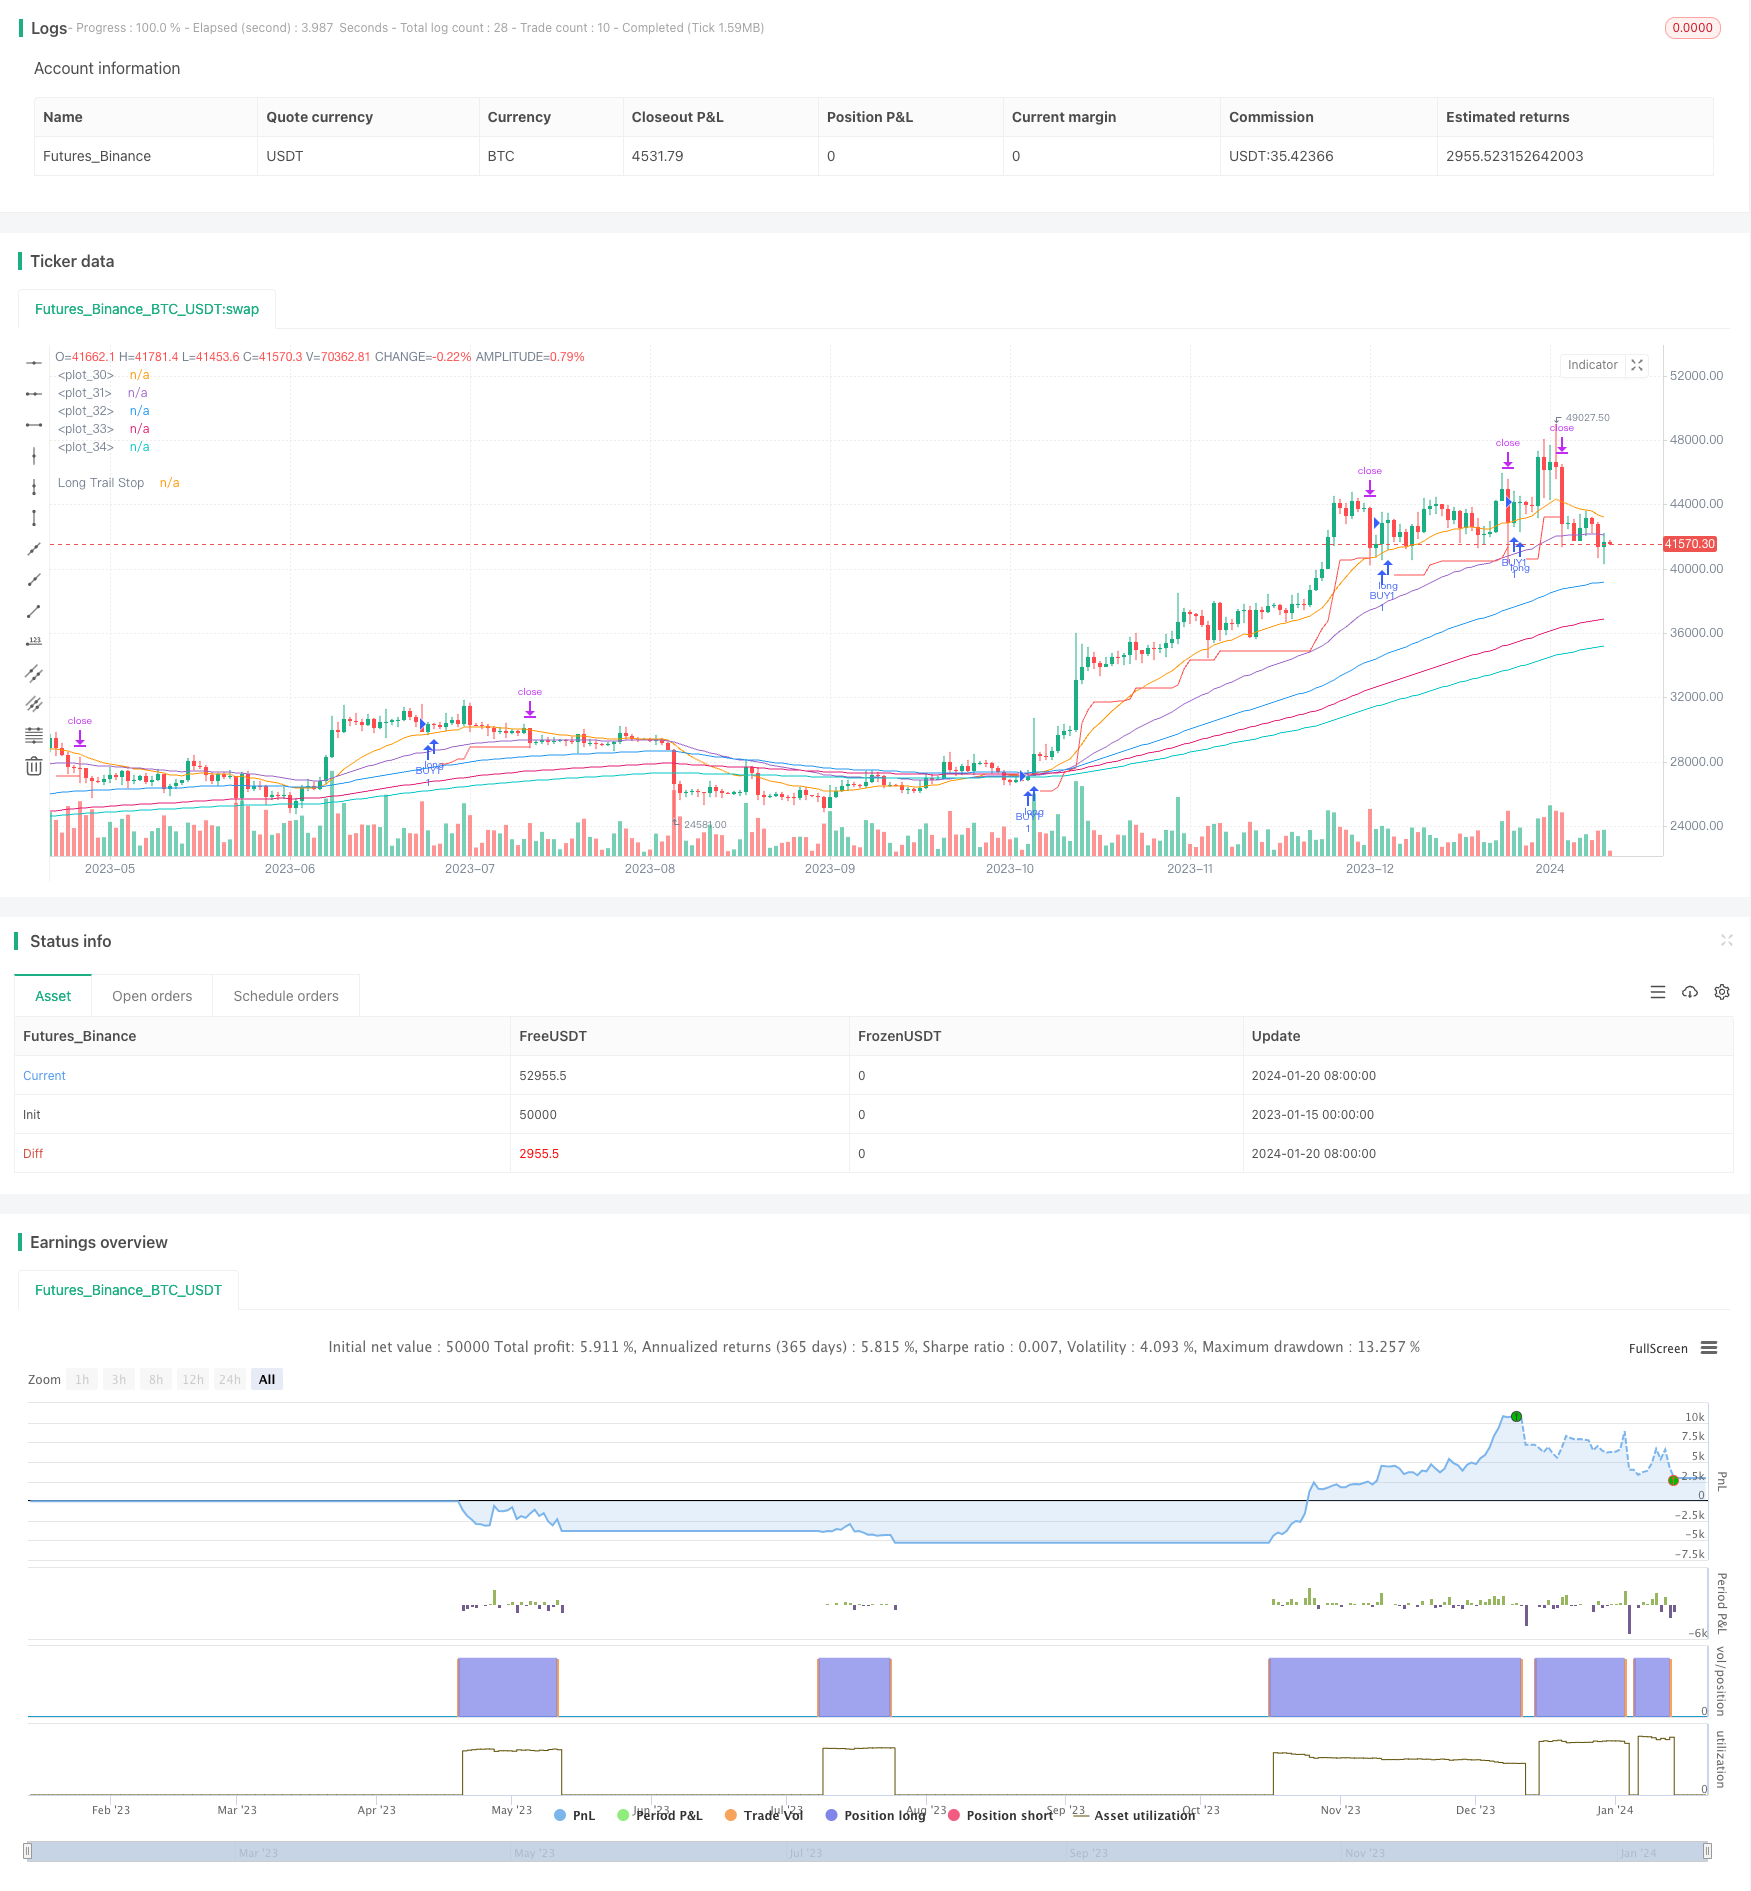
Multi-EMA Bullish Trend Strategy adalah strategi mengikuti tren berdasarkan beberapa rata-rata bergerak eksponensial (EMA) dari periode yang berbeda untuk penentuan tren.
Logika Strategi
Strategi ini menggunakan 6 EMA periode 10, 20, 50, 100, 150 dan 200 hari. EMA ini digunakan untuk menentukan tahap siklis pasar saat ini. Ketika EMA jangka pendek (misalnya 10 hari) melintasi jangka panjang (misalnya 20-, 50 hari), itu menandakan pasar telah memasuki fase markup dari tren bull.
Secara khusus, strategi akan berlangsung lama jika kondisi berikut terpenuhi:
- EMA 10 hari lebih tinggi dari EMA 20 hari
- EMA 20 hari lebih tinggi dari EMA 50 hari
- EMA 100 hari lebih tinggi dari EMA 150 hari
- EMA 150 hari lebih tinggi dari EMA 200 hari
- Harga penutupan melintasi EMA 10 hari
Setelah membuka posisi panjang, 8% trailing stop loss digunakan untuk mengunci keuntungan. Itu berarti posisi akan tetap terbuka selama harga tidak turun lebih dari 8% dari harga masuk. Setelah penarikan melebihi 8%, posisi akan ditutup untuk stop loss.
Singkatnya, ide utama dari strategi ini adalah untuk memasuki tren bull ketika dikonfirmasi oleh beberapa keselarasan EMA, dan menggunakan stop loss untuk mengunci keuntungan.
Analisis Keuntungan
Strategi multi-EMA bull trend memiliki kekuatan utama berikut:
- Hal ini dapat secara efektif menyaring breakout palsu dan memastikan menangkap siklus markup, mengurangi perdagangan yang tidak perlu.
- Filter EMA ganda menurunkan kemungkinan stop loss yang dipukul, memungkinkan pegangan posisi yang lebih aman.
- Stop loss 8% tidak terlalu ketat atau terlalu longgar, menyeimbangkan profit-taking dan stop-loss.
- Strategi ini memungkinkan pengaturan parameter yang fleksibel untuk optimasi di berbagai produk.
Analisis Risiko
Ada juga beberapa risiko yang harus diperhatikan untuk strategi ini:
- Urutan EMA tidak dapat menjamin arah tren untuk 100% kasus, beberapa whipsaws masih dapat terjadi.
- Penghentian 8% dapat memberikan beberapa keuntungan selama tren besar.
- Sistem EMA memiliki keterlambatan yang melekat, konfirmasi titik balik dapat sedikit tertunda.
Untuk mengatasi risiko ini, kita dapat mengoptimalkan dengan menyesuaikan periode EMA atau memasukkan indikator tambahan untuk penilaian yang lebih baik.
Arahan Optimasi
Mengingat karakteristik strategi ini, optimasi masa depan dapat berfokus pada aspek berikut:
- Uji kombinasi EMA dan set periode yang berbeda untuk menemukan parameter optimal.
- Tambahkan indikator indeks volatilitas untuk mengukur kekuatan tren untuk menghindari entri yang tidak perlu.
- Sertakan indikator penyaringan seperti MACD, KDJ untuk konfirmasi keselarasan bullish.
- Menggunakan algoritma pembelajaran mesin untuk implementasi stop loss dinamis.
Kesimpulan
Secara keseluruhan, Multi-EMA Bull Trend Strategy adalah sistem trend berikut yang kuat dan dapat diandalkan, menyeimbangkan penentuan tren dan pengendalian risiko.
/*backtest
start: 2023-01-15 00:00:00
end: 2024-01-21 00:00:00
period: 1d
basePeriod: 1h
exchanges: [{"eid":"Futures_Binance","currency":"BTC_USDT"}]
*/

//@version=5
strategy('SirSeff\'s EMA Rainbow', overlay=true)
// Testing Start dates
testStartYear = input(2000, 'Backtest Start Year')
testStartMonth = input(1, 'Backtest Start Month')
testStartDay = input(1, 'Backtest Start Day')
testPeriodStart = timestamp(testStartYear, testStartMonth, testStartDay, 0, 0)
//Stop date if you want to use a specific range of dates
testStopYear = input(2100, 'Backtest Stop Year')
testStopMonth = input(12, 'Backtest Stop Month')
testStopDay = input(30, 'Backtest Stop Day')
testPeriodStop = timestamp(testStopYear, testStopMonth, testStopDay, 0, 0)

testPeriod() =>
    time >= testPeriodStart and time <= testPeriodStop ? true : false
// Component Code Stop

//TSP
trailStop = input.float(title='Long Trailing Stop (%)', minval=0.0, step=0.1, defval=8) * 0.01

longStopPrice = 0.0
longStopPrice := if strategy.position_size > 0
    stopValue = close * (1 - trailStop)
    math.max(stopValue, longStopPrice[1])
else
    0

//PLOTS
plot(series=strategy.position_size > 0 ? longStopPrice : na, color=color.new(color.red, 0), style=plot.style_linebr, linewidth=1, title='Long Trail Stop', offset=1, title='Long Trail Stop')
plot(ta.ema(close, 20))
plot(ta.ema(close, 50))
plot(ta.ema(close, 100))
plot(ta.ema(close, 150))
plot(ta.ema(close, 200))

//OPEN
longCondition =  ta.ema(close, 10) > ta.ema(close, 20) and ta.ema(close, 20) > ta.ema(close, 50) and ta.ema(close, 100) > ta.ema(close, 150) and ta.ema(close, 150) > ta.ema(close, 200)
if longCondition and ta.crossover(close,ta.ema(close,10)) and testPeriod()
    strategy.entry("BUY1", strategy.long)

if longCondition and ta.crossover(ta.ema(close,10),ta.ema(close,20)) and testPeriod()
    strategy.entry("BUY2'", strategy.long)

//CLOSE @ TSL
if strategy.position_size > 0 and testPeriod()
    strategy.exit(id='TSP', stop=longStopPrice)
- Strategi perdagangan ETF untuk melacak tren pembalikan RSI
- Pelacakan tren dan strategi perdagangan jangka pendek berdasarkan indikator ADX
- Momentum Trend Dual Strategi
- Strategi Dukungan dan Resistensi CCI yang Dinamis
- Strategi Perdagangan Momentum QQE
- Strategi Peramalan Gelombang Gauss
- Strategi kuantitas kombinasi EMA bergerak dinamis
- Tren Saluran Donchian Mengikuti Strategi
- Strategi EMA Ribbon
- Strategi crossover rata-rata bergerak yang tepat
- S&P500 Hybrid Seasonal Trading Strategy
- Strategi Pelacakan Tren Berbasis Penyimpangan
- Strategi Perdagangan Divergensi RSI
- Strategi Pohon Keputusan Multi-Indikator: IMACD, EMA dan Ichimoku
- Strategi perdagangan optimasi ganda MACD
- Dual EMA Golden Cross Strategi
- Strategi perdagangan RSI dan moving average multi-timeframe
- Strategi Perdagangan Swing Mingguan
- Strategi perdagangan MACD berdasarkan EVWMA
- Bollinger Bands Channel Breakout Mean Reverssion Strategi