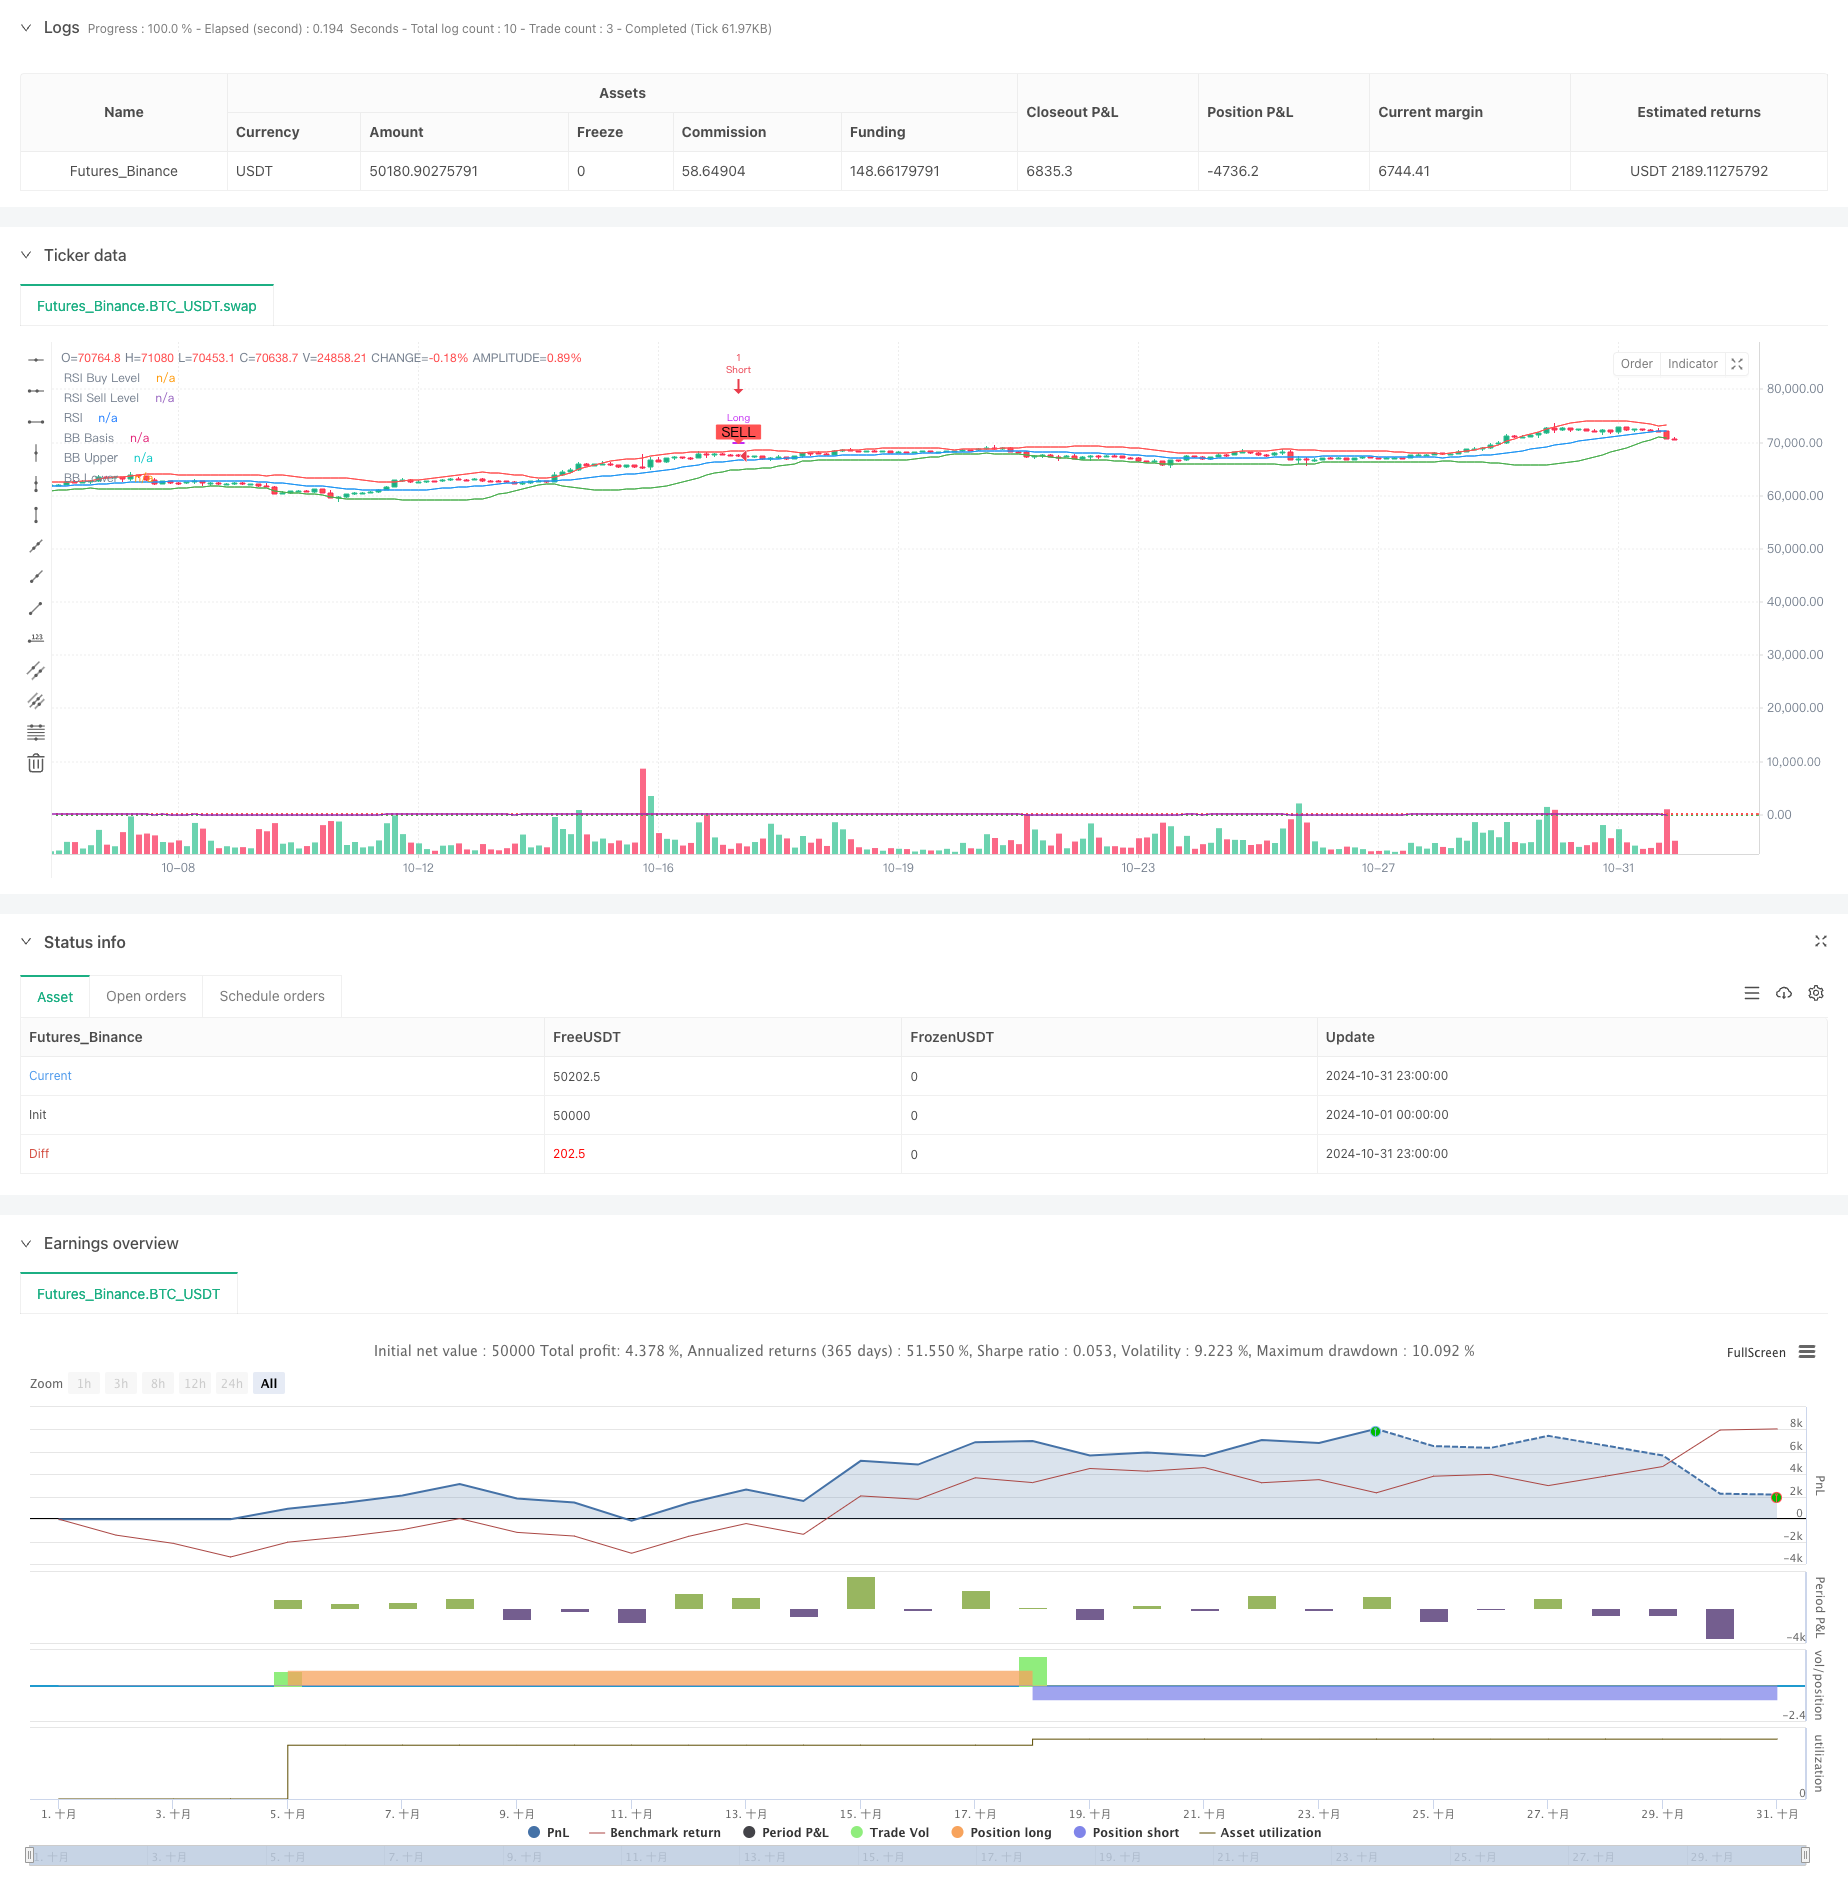
Adaptive Oscillation Trend Trading Strategy dengan Bollinger Bands dan Integrasi RSI
Penulis:ChaoZhang, Tanggal: 2024-11-12 11:35:58Tag:RSIBBMACD

Gambaran umum
Strategi ini adalah sistem mengikuti tren yang menggabungkan beberapa indikator teknis, memanfaatkan Bollinger Bands, RSI, dan MACD untuk menangkap peluang perdagangan selama osilasi pasar dan transisi tren.
Prinsip Strategi
Logika inti dibangun pada konfirmasi sinyal tiga:
- RSI mengidentifikasi zona oversold (<45) dan overbought (>55)
- Bollinger Bands menentukan posisi harga, menghasilkan sinyal ketika harga mendekati atau melanggar band
- Crossover MACD mengkonfirmasi tren, memicu perdagangan ketika selaras dengan sinyal RSI dan Bollinger Band Strategi ini menerapkan interval perdagangan minimum (15 periode) untuk mencegah overtrading dan menggunakan manajemen posisi piramida.
Keuntungan Strategi
- Validasi silang beberapa indikator teknis mengurangi sinyal palsu
- Mekanisme piramida meningkatkan efisiensi modal
- Interval perdagangan minimum secara efektif mengontrol frekuensi perdagangan
- Parameter indikator yang dapat disesuaikan memberikan kemampuan beradaptasi yang kuat
- Mekanisme penutupan posisi otomatis mengontrol eksposur risiko
Risiko Strategi
- Beberapa indikator dapat menyebabkan keterlambatan sinyal
- Potensi perdagangan sering di pasar osilasi
- Posisi piramida dapat mengakibatkan kerugian yang lebih besar selama pembalikan tren
- Batas RSI tetap mungkin tidak sesuai dengan semua kondisi pasar
Arahan Optimasi
- Menerapkan ambang batas RSI adaptif berdasarkan volatilitas pasar
- Masukkan indikator volume untuk konfirmasi sinyal
- Mengoptimalkan algoritma ukuran posisi piramida
- Menambahkan mekanisme stop loss yang lebih fleksibel
- Pertimbangkan karakteristik siklus pasar untuk penyesuaian interval perdagangan dinamis
Ringkasan
Strategi ini mencapai pengembalian yang stabil sambil mengendalikan risiko melalui koordinasi beberapa indikator teknis. Meskipun ada beberapa keterlambatan yang melekat, strategi menunjukkan kemampuan beradaptasi dan stabilitas yang baik melalui optimasi parameter yang tepat dan mekanisme manajemen risiko.
/*backtest
start: 2024-10-01 00:00:00
end: 2024-10-31 23:59:59
period: 3h
basePeriod: 3h
exchanges: [{"eid":"Futures_Binance","currency":"BTC_USDT"}]
*/

//@version=5
strategy("[ETH] Optimized Trend Strategy", shorttitle="Lorenzo-SuperScalping", overlay=true, pyramiding=3, initial_capital=100000, currency=currency.USD)

// === Input Parameters === //
trade_size = input.float(1.0, title="Trade Size (ETH)")
rsi_length = input.int(14, minval=1, title="RSI Length")
bb_length = input.int(20, minval=1, title="Bollinger Bands Length")
bb_mult = input.float(2.0, title="Bollinger Bands Multiplier")
macd_fast = input.int(12, minval=1, title="MACD Fast Length")
macd_slow = input.int(26, minval=1, title="MACD Slow Length")
macd_signal = input.int(9, minval=1, title="MACD Signal Length")

// === Indicators === //
// RSI
rsi = ta.rsi(close, rsi_length)

// Bollinger Bands
basis = ta.sma(close, bb_length)
dev = ta.stdev(close, bb_length) * bb_mult
upper_band = basis + dev
lower_band = basis - dev
plot(basis, color=color.blue, title="BB Basis")
plot(upper_band, color=color.red, title="BB Upper")
plot(lower_band, color=color.green, title="BB Lower")

// MACD
[macd_line, signal_line, _] = ta.macd(close, macd_fast, macd_slow, macd_signal)
macd_cross_up = ta.crossover(macd_line, signal_line)
macd_cross_down = ta.crossunder(macd_line, signal_line)

// === Signal Control Variables === //
var bool last_signal_buy = na
var int last_trade_bar = na

// === Buy Signal Condition === //
// - RSI below 45
// - Price near or below the lower Bollinger Band
// - MACD crossover
buy_signal = (rsi < 45 and close < lower_band * 1.02 and macd_cross_up)

// === Sell Signal Condition === //
// - RSI above 55
// - Price near or above the upper Bollinger Band
// - MACD crossunder
sell_signal = (rsi > 55 and close > upper_band * 0.98 and macd_cross_down)

// Ensure enough bars between trades
min_bars_between_trades = input.int(15, title="Minimum Bars Between Trades")
time_elapsed = na(last_trade_bar) or (bar_index - last_trade_bar) >= min_bars_between_trades

// === Execute Trades with Conditions === //
can_buy = buy_signal and (na(last_signal_buy) or not last_signal_buy) and time_elapsed
can_sell = sell_signal and (not na(last_signal_buy) and last_signal_buy) and time_elapsed

if (can_buy)
    // Close any existing short position before opening a long
    if strategy.position_size < 0
        strategy.close("Short")

    strategy.entry("Long", strategy.long, qty=trade_size)
    last_signal_buy := true
    last_trade_bar := bar_index

if (can_sell)
    // Close any existing long position and open a short position
    if strategy.position_size > 0
        strategy.close("Long")

    strategy.entry("Short", strategy.short, qty=trade_size)
    last_signal_buy := false
    last_trade_bar := bar_index

// === Plot Buy and Sell Signals === //
plotshape(series=can_buy, title="Buy Signal", location=location.belowbar, color=color.green, style=shape.labelup, text="BUY")
plotshape(series=can_sell, title="Sell Signal", location=location.abovebar, color=color.red, style=shape.labeldown, text="SELL")

// === RSI Levels for Visualization === //
hline(45, "RSI Buy Level", color=color.green, linewidth=1, linestyle=hline.style_dotted)
hline(55, "RSI Sell Level", color=color.red, linewidth=1, linestyle=hline.style_dotted)

// Plot the RSI for reference
plot(rsi, title="RSI", color=color.purple)
Berkaitan
- Indikator Super Triple RSI-MACD-BB Strategi Pembalikan Momentum
- Strategi Penembusan Volatilitas Reverse
- MACD-RSI Crossover Trend Mengikuti Strategi dengan Sistem Optimasi Bollinger Bands
- Bollinger Bands + RSI + Strategi Tren Multi-MA
- Moving Average Convergence Momentum Cloud Strategi
- Strategi Perdagangan Komprehensif Multi-Indikator: Kombinasi sempurna dari Momentum, Overbought/Oversold, dan Volatility
- Strategi Sinyal Perdagangan Chart 15 Menit Lanjutan
- Sistem Perdagangan Peringatan Volatilitas Dinamis Multi-Indikator
- Multi-Technical Indicator Dynamic Adaptive Trading Strategy (MTDAT)
- Strategi Crossover Momentum Multi-Trend dengan Sistem Optimasi Volatilitas
Lebih banyak
- E9 Shark-32 Pattern Strategi Penembusan Harga Kuantitatif
- Eksposur Pasar Terbuka Penyesuaian Posisi Dinamis Strategi Perdagangan Kuantitatif
- Tren Tingkat Menang Tinggi Artinya Strategi Perdagangan Reversi
- Strategi Momentum Tren RSI Rata-rata Bergerak Ganda
- Trend pembalikan rata-rata fusi multi-indikator mengikuti strategi
- Strategi perdagangan setelah pembukaan dengan manajemen posisi berbasis ATR yang dinamis
- Integrasi Multi-Indikator dan Kontrol Risiko Cerdas Sistem Perdagangan Kuantitatif
- Multi-Indicator Dynamic Adaptive Position Sizing dengan Strategi Volatilitas ATR
- RSI Dinamis Stop-Loss Strategi Perdagangan Cerdas
- Reversi rata-rata RSI tiga kali divalidasi dengan strategi filter rata-rata bergerak
- ADX (Average Directional Index) dan Strategi Pelacakan Tren Volume Dinamis
- Strategi perdagangan gabungan Multi-Volume Momentum
- Fibonacci Retracement dan Ekstensi Multi-Indikator Strategi Perdagangan Kuantitatif
- Strategi Posisi Sepanjang Malam Pasar dengan Filter EMA
- Kebalikan rata-rata berdasarkan indikator multi-teknis dan strategi mengikuti tren
- Driver WebSocket Akselerasi
- Multiple thread mendapatkan simbol pendanaan
- Strategi Crossover EMA/MACD/RSI
- Multi-Indikator Crossover Momentum Trading Strategy dengan Optimized Take Profit dan Stop Loss System
- Volatility Stop Cloud Strategy dengan Moving Average Crossover System