概述
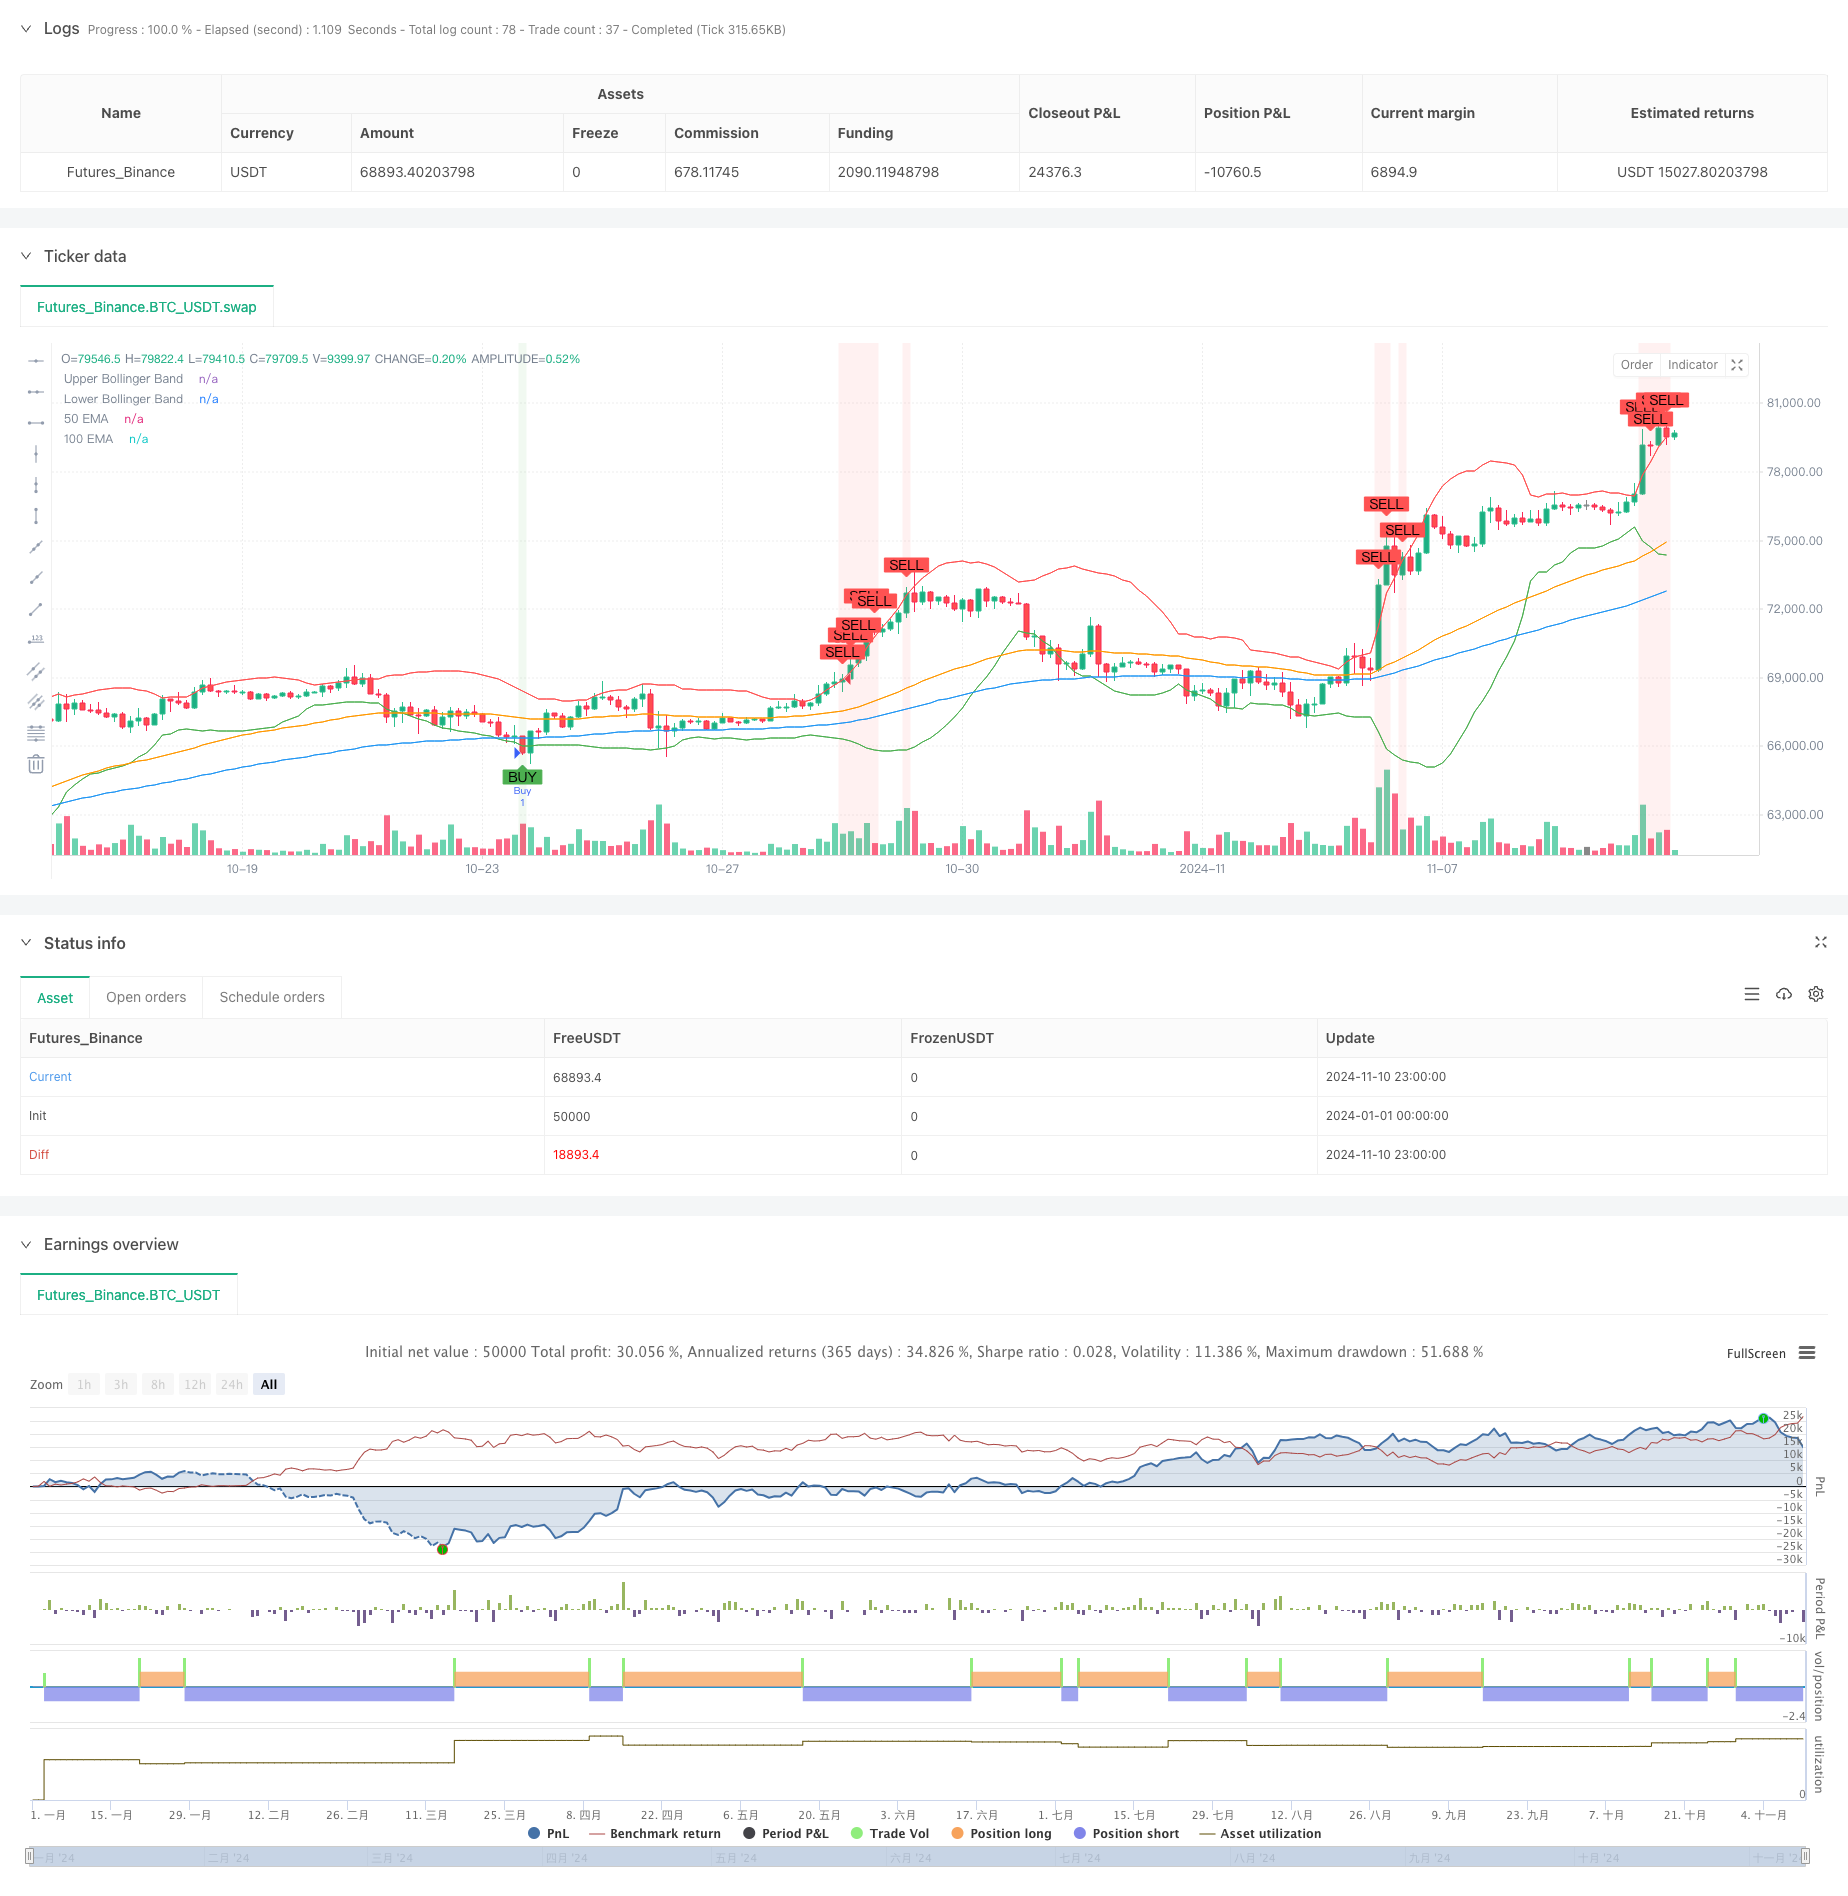
该策略是一个结合了均值回归和趋势跟踪的混合策略系统,主要通过RSI、布林带和多重EMA指标的配合来捕捉市场的超买超卖机会。策略在传统技术分析指标的基础上,增加了趋势确认和范围震荡的判断,有效提高了策略的准确性。
策略原理
策略采用三重验证机制来确认交易信号。首先通过RSI指标识别超买超卖区域,当RSI低于30或高于70时触发初始信号。其次使用布林带(BB)作为价格波动范围的参考,价格突破上轨或下轨时进一步确认信号。最后通过100/50日EMA的相对位置和波动性来判断市场趋势,只有在趋势方向与前两个信号一致时才执行交易。策略还加入了EMA的波动率判断,用于识别盘整市场。
策略优势
- 多重技术指标交叉验证,大幅降低虚假信号
- 结合超买超卖和趋势跟踪,提高策略适应性
- 引入均线波动率判断,有效识别盘整市场
- 可视化效果清晰,便于策略监控和优化
- 参数可调节性强,适应不同市场环境
策略风险
- 多重指标可能导致信号滞后
- 在剧烈波动市场中可能错过交易机会
- 参数优化过度可能导致过拟合
- EMA趋势判断在横盘市场可能产生混淆信号 建议通过回测不同时间周期数据来验证策略稳定性,并设置适当的止损来控制风险。
策略优化方向
- 加入成交量指标作为辅助确认
- 引入自适应参数调节机制
- 增加止盈止损管理模块
- 开发趋势强度评分系统
- 优化EMA波动率计算方法
- 添加市场波动率过滤器
总结
该策略通过多重技术指标的协同作用,在保证稳健性的同时兼顾了策略的灵活性。策略逻辑清晰,实现方式简洁,具有较好的实用价值。通过合理的参数优化和风险管理,策略有望在不同市场环境下保持稳定表现。
策略源码
/*backtest
start: 2024-01-01 00:00:00
end: 2024-11-11 00:00:00
period: 3h
basePeriod: 3h
exchanges: [{"eid":"Futures_Binance","currency":"BTC_USDT"}]
*/

//@version=5
strategy("BTC Dominance Analysis Strategy (Improved)", overlay=true)

// Input Parameters
rsi_period = input(14, title="RSI Period")
bb_period = input(20, title="Bollinger Band Period")
bb_std_dev = input(2.0, title="Bollinger Std Dev")
ema_period = input(100, title="100 EMA Period")
ema_30_period = input(30, title="30 EMA Period")
ema_50_period = input(50, title="50 EMA Period")

// RSI Calculation
rsi_value = ta.rsi(close, rsi_period)

// Bollinger Bands Calculation
basis = ta.sma(close, bb_period)
dev = bb_std_dev * ta.stdev(close, bb_period)
upper_bb = basis + dev
lower_bb = basis - dev

// EMA Calculation
ema_100 = ta.ema(close, ema_period)
ema_30 = ta.ema(close, ema_30_period)
ema_50 = ta.ema(close, ema_50_period)

// Determine EMA trends
range_bound_ema = math.abs(ema_100 - ta.sma(ema_100, 10)) < ta.stdev(ema_100, 10)
uptrend_ema = ema_100 > ema_50
downtrend_ema = ema_100 < ema_50

// Long Condition: All 3 conditions must be met
// 1. RSI < 30
// 2. BTC Dominance < lower Bollinger Band
// 3. 100 EMA must be range-bound or in an uptrend (but NOT in a downtrend)
long_condition = (rsi_value < 30) and (close < lower_bb) and (range_bound_ema or uptrend_ema)

// Short Condition: All 3 conditions must be met
// 1. RSI > 70
// 2. BTC Dominance > upper Bollinger Band
// 3. 100 EMA must be range-bound or in a downtrend (but NOT in an uptrend)
short_condition = (rsi_value > 70) and (close > upper_bb) and (range_bound_ema or downtrend_ema)

// Plot Buy and Sell Signals for Debugging
plotshape(long_condition, title="Buy Signal", location=location.belowbar, color=color.green, style=shape.labelup, text="BUY")
plotshape(short_condition, title="Sell Signal", location=location.abovebar, color=color.red, style=shape.labeldown, text="SELL")

// Execute Buy Trade
if (long_condition)
    strategy.entry("Buy", strategy.long)

// Execute Sell Trade
if (short_condition)
    strategy.entry("Sell", strategy.short)

// Plot Bollinger Bands and EMA
plot(upper_bb, color=color.red, title="Upper Bollinger Band")
plot(lower_bb, color=color.green, title="Lower Bollinger Band")
plot(ema_100, color=color.blue, title="100 EMA")
plot(ema_50, color=color.orange, title="50 EMA")
// plot(rsi_value, "RSI", color=color.purple)

// Display background color for Buy and Sell signals
bgcolor(long_condition ? color.new(color.green, 90) : na, title="Buy Background")
bgcolor(short_condition ? color.new(color.red, 90) : na, title="Sell Background")
相关推荐
- 组合式动量与均值回归高频量化策略
- EMA、RSI、TA、多重指标交易策略
- 动态风险管理的均线交叉与布林带策略
- 多指标动态趋势交叉量化交易策略
- 布林带趋势突破增强型量化策略结合指标动量过滤系统
- 多重均线超级趋势结合布林带突破交易策略
- 基于ATR动态管理的开市突破交易策略
- 多指标综合交易策略:动量、超买超卖与波动率的完美结合
- 多指标动态交易策略与成交量确认系统
- 布林带动量趋势跟踪量化策略
更多内容
- 基于ATR动态管理的开市突破交易策略
- 基于多指标集成和智能风控的量化交易系统
- 多重指标动态自适应调仓ATR波动率策略
- RSI动态止损智能交易策略
- 均线修正型RSI三重验证机会策略
- 结合布林带与RSI的自适应震荡趋势交易策略
- ADX (Average Directional Index) 和交易量趋势动态跟踪策略
- 多重成交量动量组合交易策略
- 斐波那契回撤与延展多重指标量化交易策略
- 基于EMA指标的跨市场多空趋势隔夜持仓策略
- WebSocket 加速驱动
- 多平台期货资金费率获取与监控策略
- EMA/MACD/RSI 交叉策略
- 多指标交叉动量交易策略结合止盈止损优化系统
- 波动率停止云策略与均线交叉系统
- 布林带精确交叉突破量化策略
- 动态风险管理的均线交叉与布林带策略
- 多级平衡量化交易策略
- 多维度数学模型交易策略
- EMA交叉Fibonacci反转策略