Perpindahan Fase Multi Periode dengan EMA Trend Following Strategy
Penulis:ChaoZhang, Tanggal: 2025-01-10 15:17:33Tag:SMAEMAMA

Gambaran umum
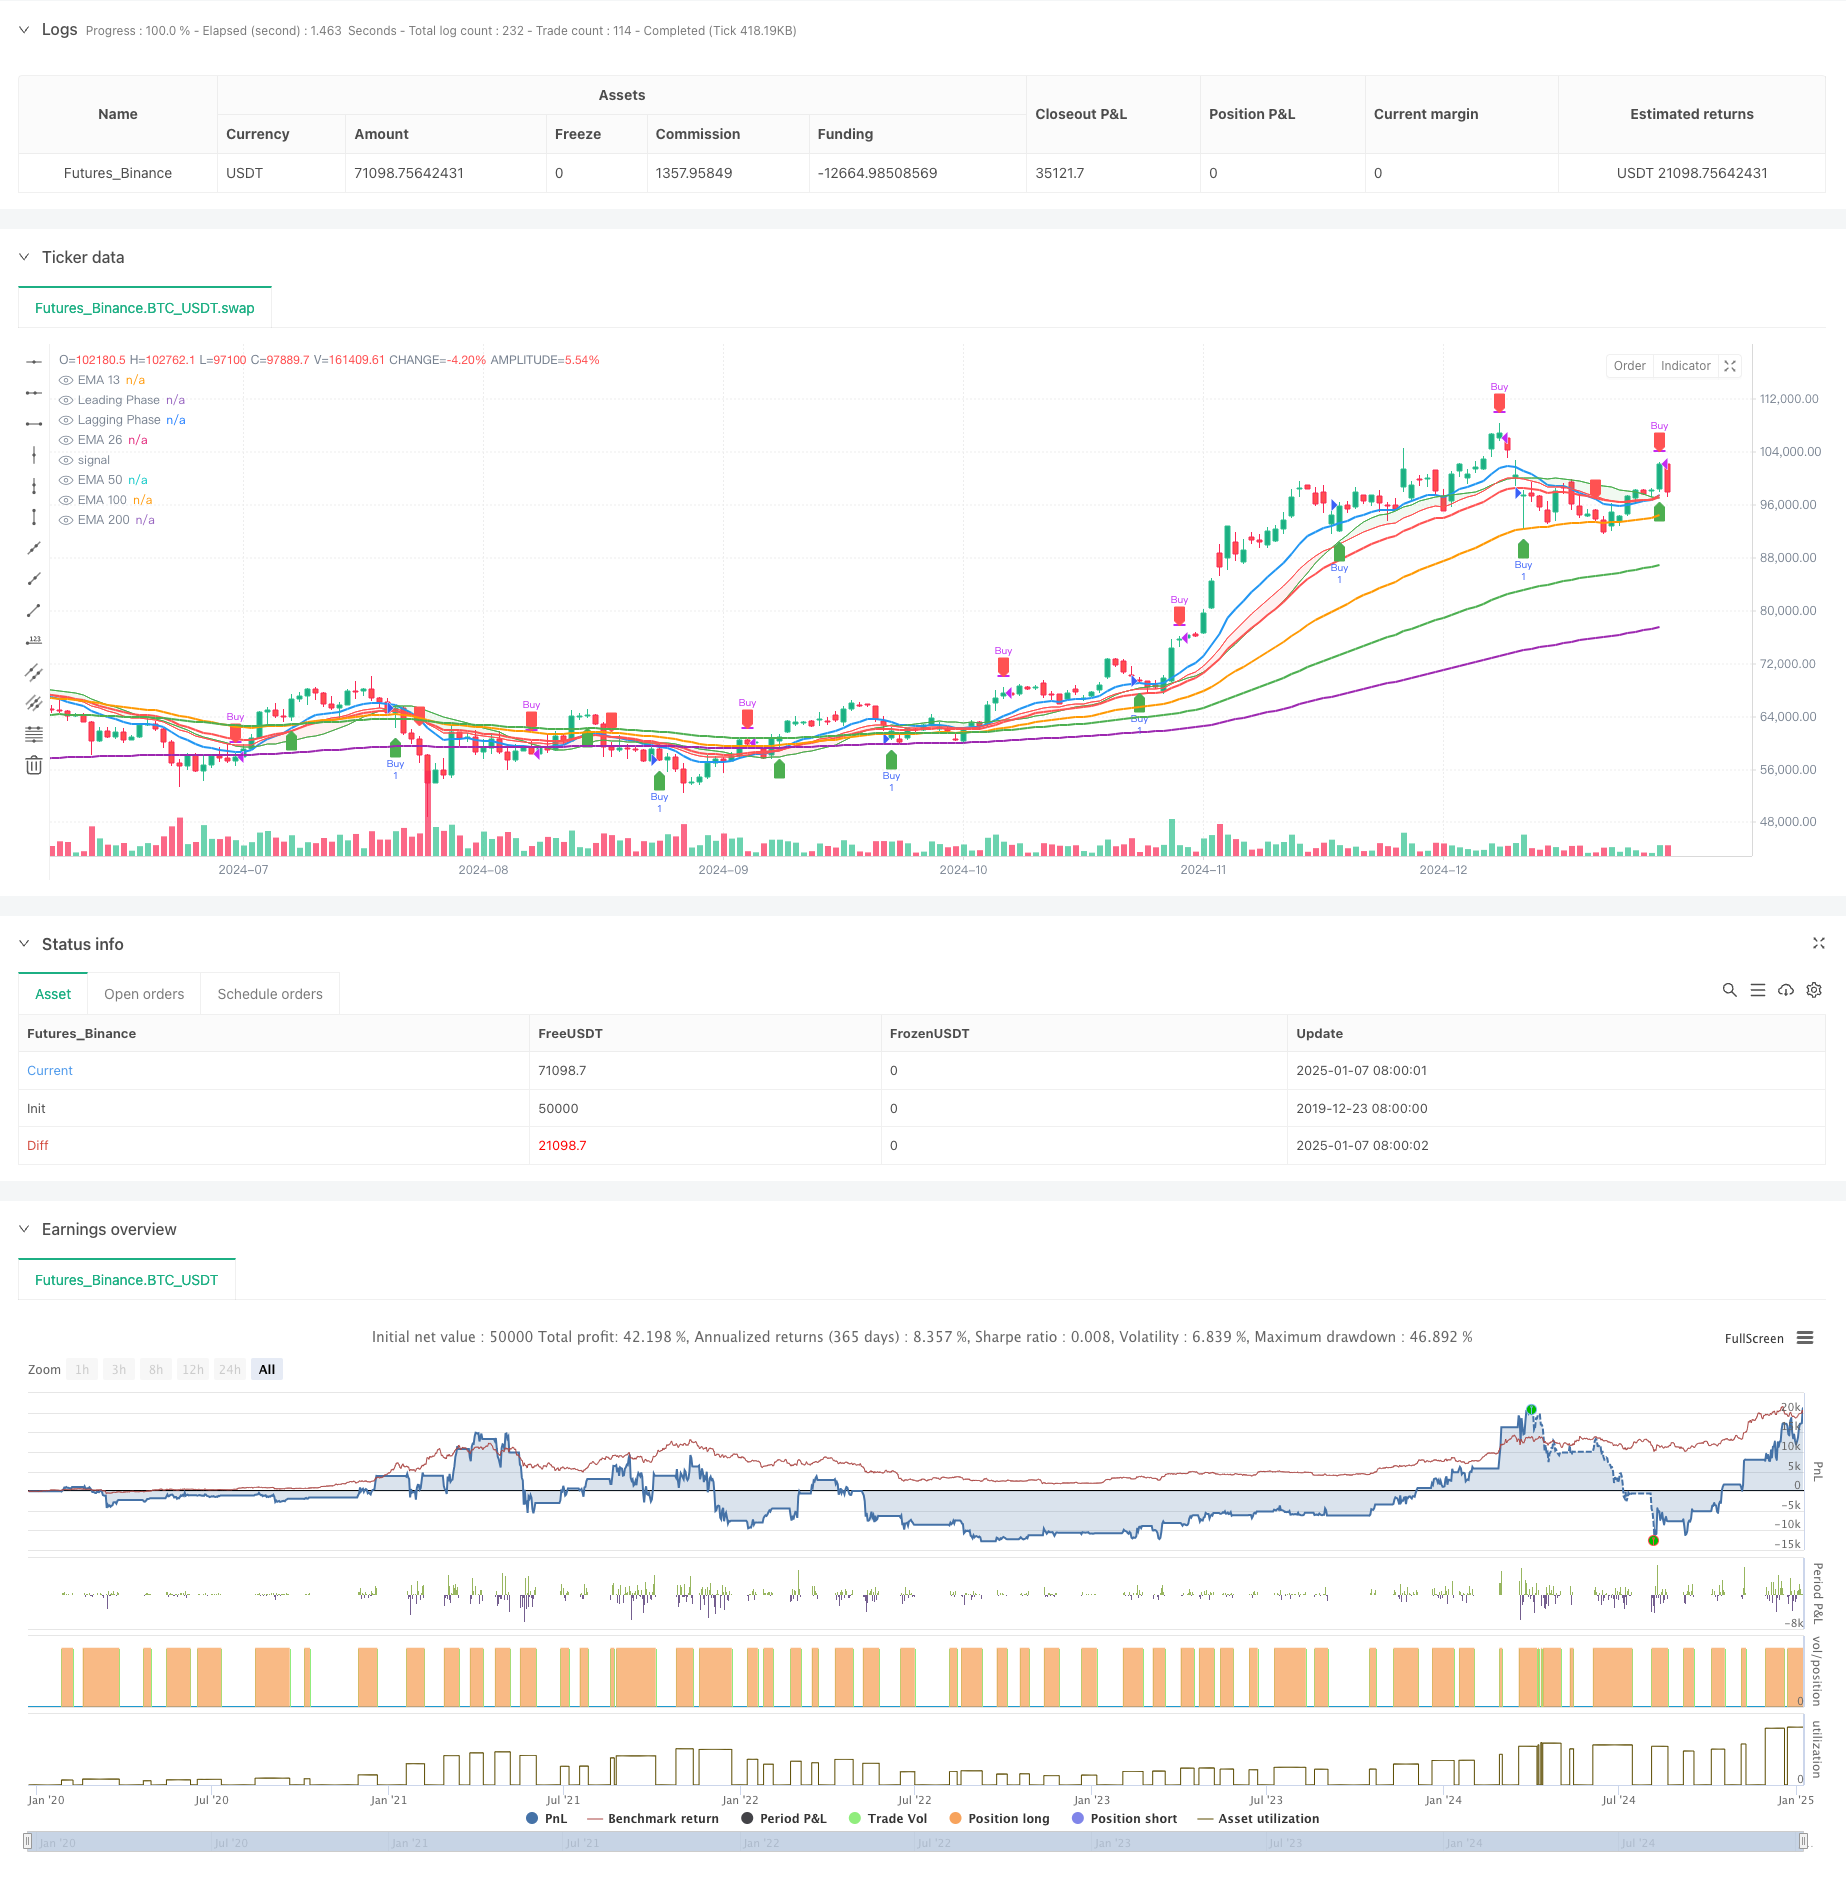
Strategi ini menggabungkan sinyal fase crossover dengan rata-rata bergerak eksponensial multi-periode untuk menangkap peluang pembelian dan penjualan pasar.
Prinsip Strategi
Fase Crossover System menggunakan Simple Moving Average (SMA) dengan offset ke atas sebagai Fase Utama dan EMA (Exponential Moving Average) dengan offset ke bawah sebagai Fase Lagging. Sinyal beli dihasilkan ketika Fase Utama melintasi di atas Fase Lagging, dan sinyal jual ketika melintasi di bawah. EMA Trend Confirmation System menggunakan beberapa periode (13/26/50/100/200) rata-rata bergerak eksponensial untuk mengkonfirmasi tren pasar secara keseluruhan, dengan EMA crossover 13 dan 26 periode berfungsi sebagai sinyal perdagangan sekunder.
Keuntungan Strategi
- Sistem Sinyal Lengkap: Menggabungkan sinyal fase silang jangka pendek dengan konfirmasi tren jangka panjang untuk secara efektif menyaring sinyal palsu
- Kemampuan Mengikuti Tren yang Kuat: Menangkap dengan akurat arah tren utama melalui sistem EMA multi-periode
- Visualisasi yang Baik: Menggunakan zona berwarna untuk mengidentifikasi kondisi bullish dan bearish dengan sinyal perdagangan yang jelas
- Adaptabilitas Parameter yang Kuat: Dapat disesuaikan dengan karakteristik pasar dan periode perdagangan yang berbeda
- Pengendalian risiko yang wajar: Menggabungkan beberapa indikator untuk konfirmasi untuk mengontrol risiko perdagangan secara efektif
Risiko Strategi
- Risiko pasar osilasi: Dapat menghasilkan sinyal perdagangan yang berlebihan selama fase konsolidasi, meningkatkan biaya perdagangan
- Risiko Lag: Rata-rata bergerak secara inheren memiliki lag, berpotensi kehilangan titik masuk yang optimal
- Risiko Breakout Palsu: Dapat menghasilkan sinyal Breakout Palsu selama volatilitas pasar yang tinggi
- Sensitivitas parameter: pengaturan parameter yang berbeda dapat menyebabkan variasi kinerja strategi yang signifikan
- Ketergantungan pada Lingkungan Pasar: Strategi berkinerja lebih baik di pasar tren tetapi berkinerja lebih buruk di pasar osilasi
Arah Optimasi Strategi
- Tambahkan filter volatilitas untuk mengurangi frekuensi perdagangan selama periode volatilitas rendah
- Sertakan indikator konfirmasi volume untuk meningkatkan keandalan sinyal
- Mengoptimalkan mekanisme stop loss dan take profit, membangun sistem stop loss yang dinamis
- Memperkenalkan klasifikasi lingkungan pasar untuk menyesuaikan parameter strategi untuk kondisi pasar yang berbeda
- Mengembangkan sistem parameter adaptif untuk optimasi strategi dinamis
Ringkasan
Strategi ini membangun sistem perdagangan trend berikut yang komprehensif dengan menggabungkan sistem fase crossover dan multi-periode EMA. Ini memiliki sinyal yang jelas, penangkapan tren yang akurat, dan kontrol risiko yang wajar, sementara juga memiliki lag dan risiko sinyal palsu tertentu. Stabilitas dan keandalan strategi dapat ditingkatkan lebih lanjut melalui optimalisasi seperti menambahkan filter volatilitas dan konfirmasi volume.
/*backtest
start: 2019-12-23 08:00:00
end: 2025-01-08 08:00:00
period: 1d
basePeriod: 1d
exchanges: [{"eid":"Futures_Binance","currency":"BTC_USDT"}]
*/

//@version=5
strategy("Phase Cross Strategy with Zone", overlay=true)

// Inputs
length = input.int(20, title="Smoothing Length")
source = input(close, title="Source")
offset = input.float(0.5, title="Offset Amount", minval=0.0)  // Offset for spacing

// Simulating "Phases" with Smoothed Oscillators
lead_phase = ta.sma(source, length) + offset  // Leading phase with offset
lag_phase = ta.ema(source, length) - offset  // Lagging phase with offset

// Signal Logic
buySignal = ta.crossover(lead_phase, lag_phase)
sellSignal = ta.crossunder(lead_phase, lag_phase)

// Plot Phases (as `plot` objects for `fill`)
lead_plot = plot(lead_phase, color=color.green, title="Leading Phase", linewidth=1)
lag_plot = plot(lag_phase, color=color.red, title="Lagging Phase", linewidth=1)

// Fill Zone Between Phases
fill_color = lead_phase > lag_phase ? color.new(color.green, 90) : color.new(color.red, 90)
fill(plot1=lead_plot, plot2=lag_plot, color=fill_color, title="Phase Zone")

// Plot Buy and Sell Signals
plotshape(buySignal, style=shape.labelup, location=location.belowbar, color=color.new(color.green, 0), title="Buy Signal", size=size.small)
plotshape(sellSignal, style=shape.labeldown, location=location.abovebar, color=color.new(color.red, 0), title="Sell Signal", size=size.small)

// Strategy Entry and Exit
if buySignal
    strategy.entry("Buy", strategy.long)

if sellSignal
    strategy.close("Buy")


//indicator("EMA 13, 26, 50, 100, and 200 with Crossover, Value Zone, and Special Candles", overlay=true)

// Define the EMAs
ema13 = ta.ema(close, 13)
ema26 = ta.ema(close, 26)
ema50 = ta.ema(close, 50)
ema100 = ta.ema(close, 100)
ema200 = ta.ema(close, 200)

// Plot the EMAs
plot(ema13, color=color.blue, linewidth=2, title="EMA 13")
plot(ema26, color=color.red, linewidth=2, title="EMA 26")
plot(ema50, color=color.orange, linewidth=2, title="EMA 50")
plot(ema100, color=color.green, linewidth=2, title="EMA 100")
plot(ema200, color=color.purple, linewidth=2, title="EMA 200")

// Crossover conditions
uptrend = ta.crossover(ema13, ema26)  // EMA 13 crosses above EMA 26 (buy)
downtrend = ta.crossunder(ema13, ema26)  // EMA 13 crosses below EMA 26 (sell)

// Plot buy/sell arrows
plotshape(series=uptrend, location=location.belowbar, color=color.green, style=shape.labelup, size=size.small, title="Buy Signal")
plotshape(series=downtrend, location=location.abovebar, color=color.red, style=shape.labeldown, size=size.small, title="Sell Signal")
- MA, SMA, MA Slope, Trailing Stop Loss, Re-Entry
- Tren Harga-Volume Frekuensi Tinggi Mengikuti dengan Analisis Volume Adaptive Strategy
- Tren Dinamis Mengikuti Strategi Crossover Rata-rata Bergerak Multi-Periode
- Bollinger Awesome Alert R1
- Strategi Perdagangan Retracement Fibonacci Dinamis
- Trend EMA Multi-Level Fibonacci Mengikuti Strategi
- Trend lintas rata-rata bergerak multi-mengikuti strategi osilasi RSI
- Strategi silang rata-rata bergerak eksponensial multi-periode dinamis dengan sistem optimasi pullback
- Strategi Pelacakan Tren Gelombang Dinamis
- Triple Bottom Rebound Momentum Strategi Terobosan
- Tren Multidimensional Mengikuti Strategi Perdagangan Piramida
- Triple Bottom Rebound Momentum Strategi Terobosan
- Dual Timeframe Trend Reversal Candlestick Pattern Strategi Trading Kuantitatif
- Tren Harga-Volume Frekuensi Tinggi Mengikuti dengan Analisis Volume Adaptive Strategy
- Strategi Momentum Tren Harga-Volume yang Ditingkatkan
- Strategi Crossover Rata-rata Bergerak Cerdas dengan Sistem Manajemen Keuntungan / Kerugian Dinamis
- Adaptive Multi-MA Momentum Breakthrough Trading Strategi
- Adaptive Momentum Mean-Reversion Crossover Strategy
- Adaptive Dual-Direction EMA Trend Trading System dengan Strategi Optimisasi Perdagangan Reverse
- Sistem Trading Pullback EMA Dual dengan Optimisasi Stop-Loss Dinamis Berbasis ATR
- Trend lintas rata-rata bergerak multi-mengikuti strategi osilasi RSI
- Multi-Periode Bollinger Bands Trend Breakout Strategy dengan Volatility Risk Control Model
- Dukungan dan Resistensi Dinamis Adaptive Pivot Trading Strategy
- Strategi divergensi EMA-RSI ganda: Sistem penangkapan tren berdasarkan rata-rata bergerak eksponensial dan kekuatan relatif
- Strategi Perdagangan Piramida Dinamis Supertrend Multi-Periode
- Strategi kuantitatif lintas SMA tren jangka panjang
- Trend Fusi Indikator Multi-Teknis Mengikuti Strategi Perdagangan Kuantitatif
- Indikator Multi-Teknis Momentum-MA Trend Mengikuti Strategi
- Sistem Perdagangan Crossover EMA Tiga dengan Smart R2R berbasis Stop Loss Management
- Strategi kuantitatif EMA lintas frekuensi tinggi yang didorong oleh volatilitas dinamis