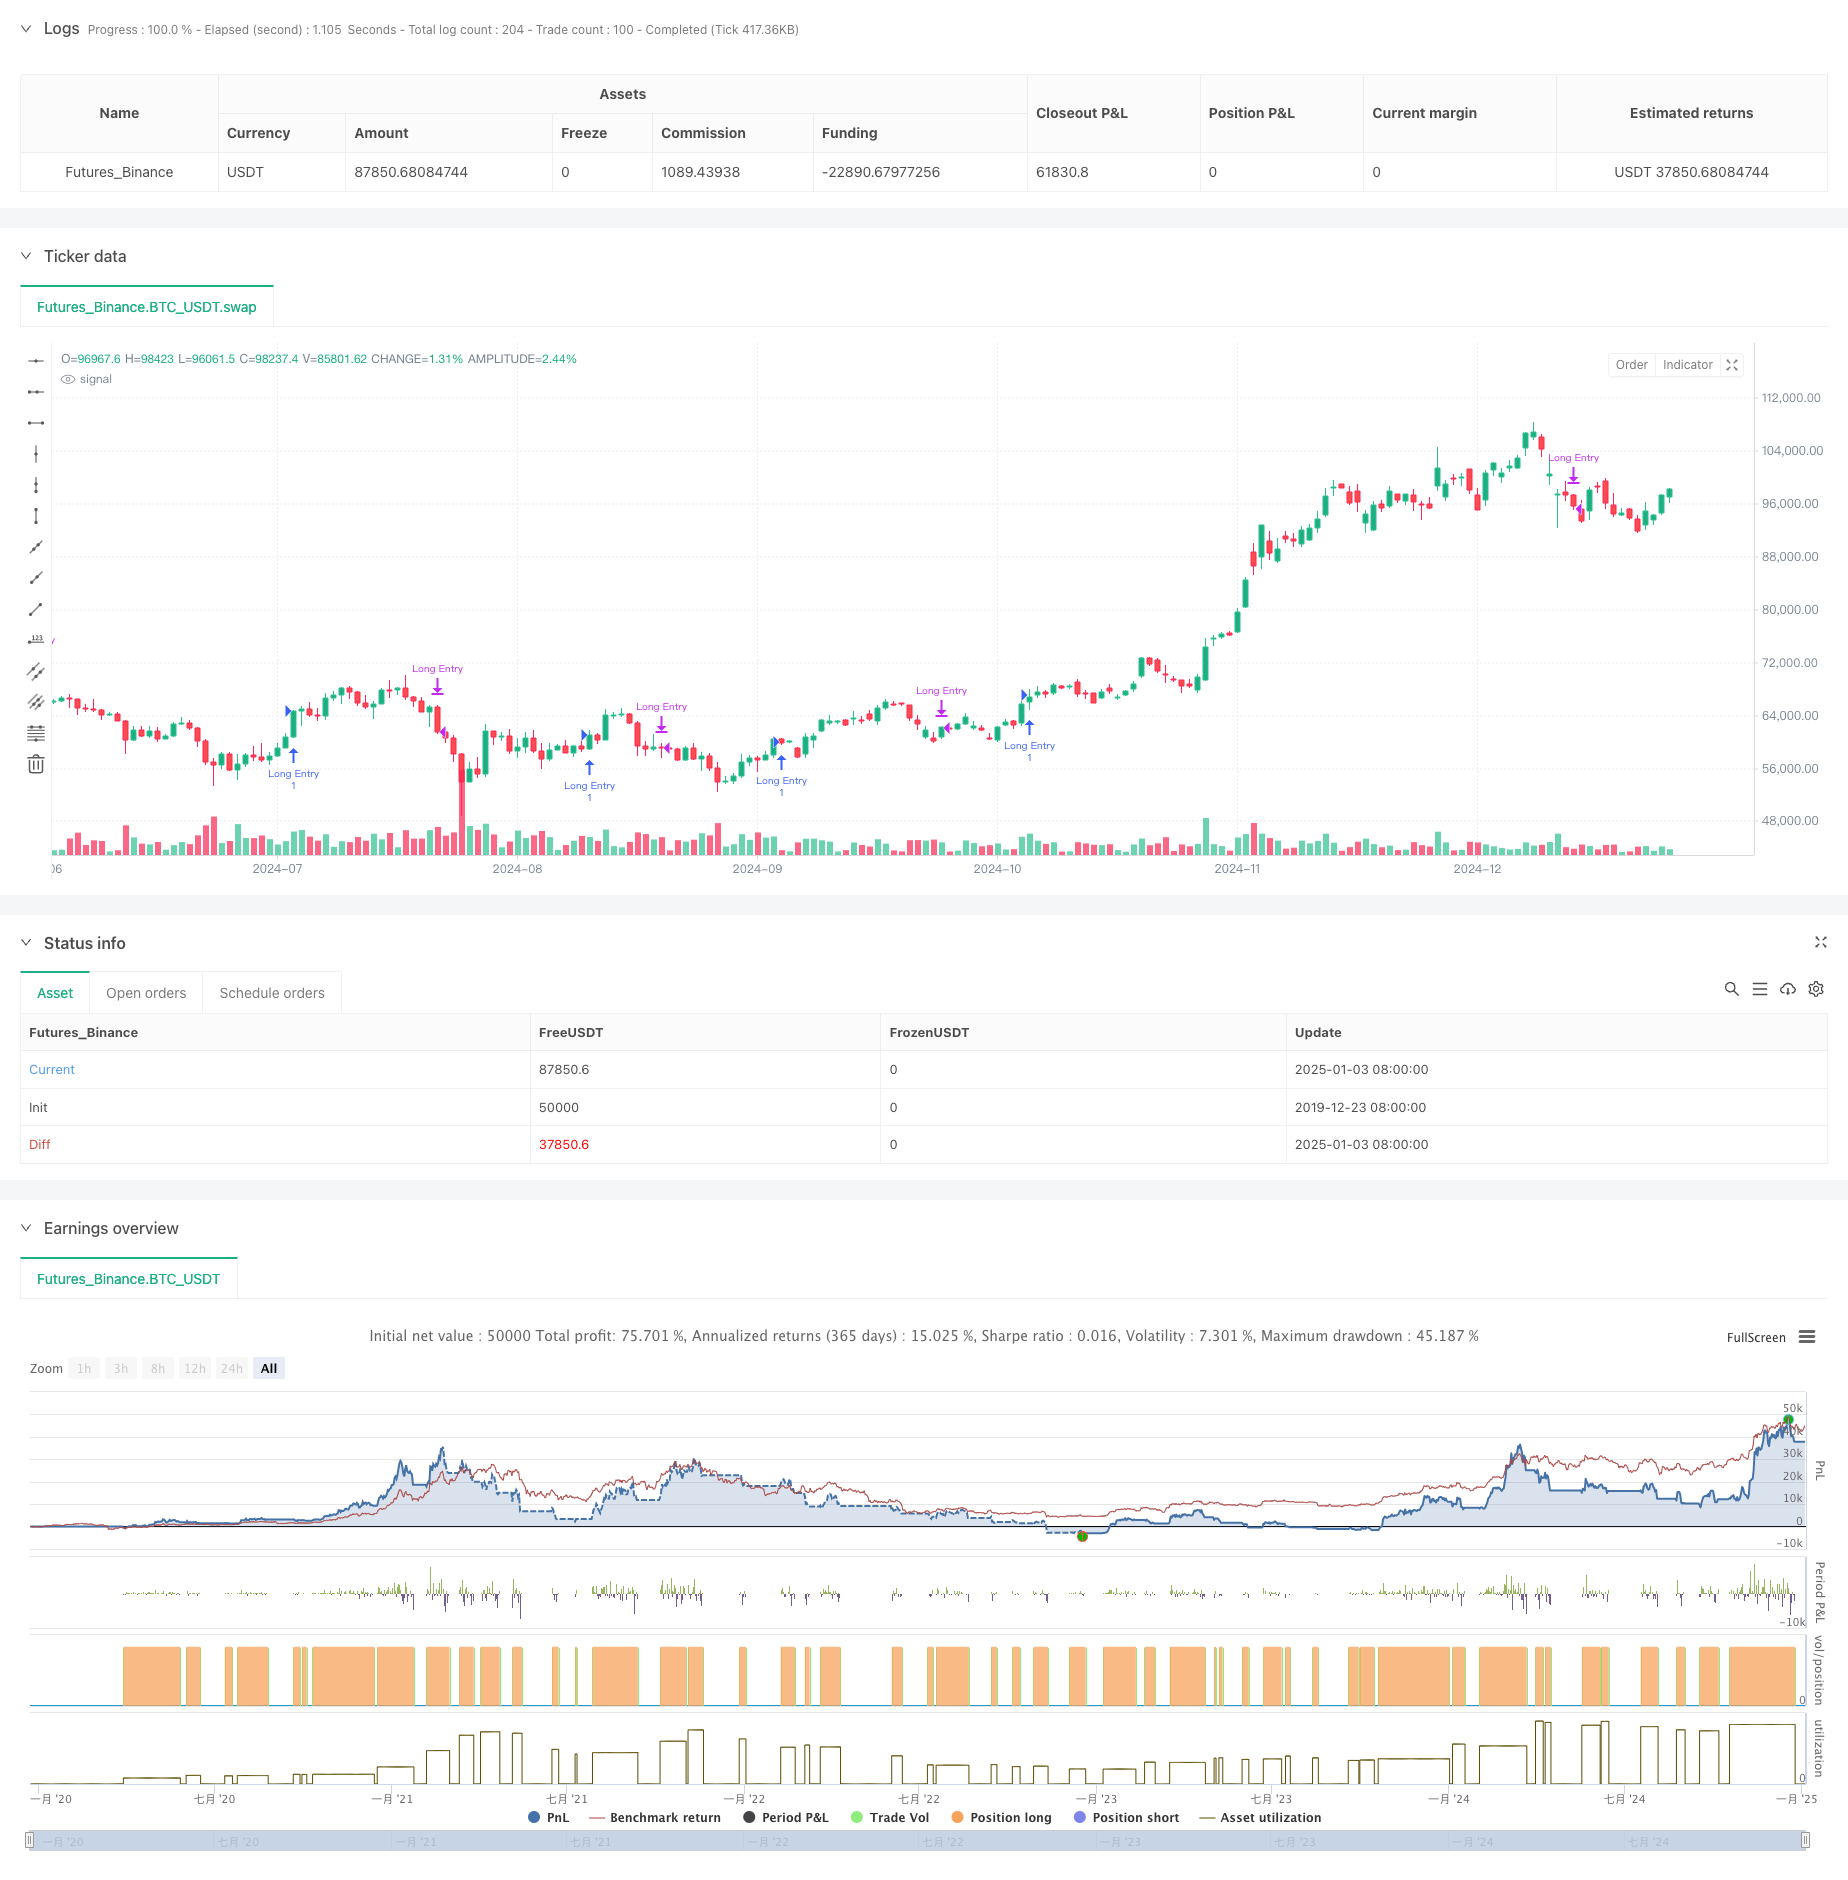
概述
该策略是一个基于多周期简单移动平均线(SMA)交叉信号的量化交易系统。它主要通过识别长期上涨趋势中的短期回调机会进行交易。策略使用5日、10日、20日、60日和120日五个周期的SMA指标,通过均线的位置关系和交叉信号来判断市场趋势和交易时机。
策略原理
策略的核心逻辑包含以下几个关键部分: 1. 通过SMA20和SMA60的相对位置关系判断长期趋势,当SMA20位于SMA60之上时,确认市场处于上涨趋势。 2. 在确认长期上涨趋势的前提下,当短期SMA5从SMA20下方回升至上方时,触发买入信号。这表明市场在上涨趋势中出现短期回调后开始反弹。 3. 当SMA20上穿SMA5时,触发平仓信号。这表明短期上涨动能减弱,可能进入调整期。 4. 策略还包含了时间过滤器功能,可以限定回测的时间范围,提高策略的灵活性。
策略优势
- 策略逻辑清晰简单,易于理解和实现,不涉及复杂的计算过程。
- 通过多周期均线的配合使用,能够有效过滤市场噪音,提高交易信号的可靠性。
- 策略聚焦于趋势市场中的回调机会,符合”趋势交易”的核心理念。
- 采用SMA替代EMA,降低了对价格变化的敏感度,减少虚假信号。
- 入场和出场逻辑明确,便于执行和风险控制。
策略风险
- 均线系统存在滞后性,可能导致入场和出场时机不够理想。
- 在震荡市场中,频繁的均线交叉可能产生过多虚假信号。
- 策略缺乏波动率过滤机制,在高波动期可能面临较大回撤风险。
- 没有考虑成交量等其他技术指标的配合,信号的可靠性有待提高。
- 固定的均线参数可能不适合所有市场环境。
策略优化方向
- 引入ATR指标进行波动率过滤,在波动率过高时避免交易。
- 加入成交量确认机制,提高交易信号的可靠性。
- 开发自适应均线周期机制,使策略更好地适应不同市场环境。
- 增加趋势强度过滤器,如ADX指标,以确保在强趋势中交易。
- 完善止损机制,如加入跟踪止损,更好地控制风险。
总结
该策略通过多周期SMA均线的配合使用,构建了一个专注于捕捉长期上涨趋势中回调机会的交易系统。策略设计简洁实用,具有良好的可理解性和可执行性。通过引入波动率过滤、成交量确认等优化措施,策略的稳健性和可靠性有望进一步提升。
策略源码
/*backtest
start: 2019-12-23 08:00:00
end: 2025-01-04 08:00:00
period: 1d
basePeriod: 1d
exchanges: [{"eid":"Futures_Binance","currency":"BTC_USDT"}]
*/

//@version=6
strategy("Long-Term Growing Stock Strategy", overlay=true)
// Date Range
// STEP 1. Create inputs that configure the backtest's date range
useDateFilter = input.bool(true, title="Filter Date Range of Backtest",group="Backtest Time Period")
backtestStartDate = input(timestamp("1 Jan 2014"),title="Start Date", group="Backtest Time Period",tooltip="This start date is in the time zone of the exchange " + "where the chart's instrument trades. It doesn't use the time " +"zone of the chart or of your computer.")
backtestEndDate = input(timestamp("31 Dec 2024"), title="End Date", group="Backtest Time Period")
// STEP 2. See if current bar falls inside the date range
inTradeWindow = true


// Calculate EMAs
// ema20 = ta.ema(close, ema20_length)
// ema60 = ta.ema(close, ema60_length)
// ema120 = ta.ema(close, ema120_length)
sma5 = ta.sma(close, 5)
sma10 = ta.sma(close, 10)
sma20 = ta.sma(close, 20)
sma60 = ta.sma(close, 60)
sma120 = ta.sma(close, 120)

// Long-term growth condition: EMA 20 > EMA 60 > EMA 120
longTermGrowth = sma20 > sma60
//  and ema60 > ema120

// Entry condition: Stock closes below EMA 20 and then rises back above EMA 10

// entryCondition = ta.crossover(close, ema20) or (close[1] < ema20[1] and close > ema20)
entryCondition =  sma5[1] <= sma20[1] and sma5 > sma20
// ta.crossover(sma5, sma20)

// Exit condition: EMA 20 drops below EMA 60
// exitCondition = ema5 < ema60 or (year == 2024 and month == 12 and dayofmonth == 30)
exitCondition = ta.crossover(sma20, sma5)

// Execute trades
if entryCondition and inTradeWindow
    strategy.entry("Long Entry", strategy.long)

if exitCondition and inTradeWindow
    strategy.close("Long Entry")
// plotchar(true, char="sma5: " + str.tostring(sma5))
// plotchar(true, char="sma5: " + sma20)
// label.new(x=bar_index, y=high + 10, text="SMA 5: " + str.tostring(sma5), color=color.blue, style=label.style_label_down, textcolor=color.white, size=size.small)
// label.new(x=bar_index, y=low, text="SMA 20: " + str.tostring(sma20), color=color.red, style=label.style_label_down, textcolor=color.white, size=size.small)


// x = time + (time - time[1]) * offset_x

//     var label lab = na
//     label.delete(lab)
//     lab := label.new(x=x, y=0, text=txt, xloc=xloc.bar_time, yloc=yloc.belowbar, color=color.red, textcolor=color.black, size=size.normal, style=label.style_label_up)
//     label.set_x(lab, x)


// Plot EMAs for visualization
// plot(ema20, color=color.red, title="EMA 20")
// plot(ema60, color=color.green, title="EMA 60")
// plot(ema120, color=color.blue, title="EMA 120")
相关推荐