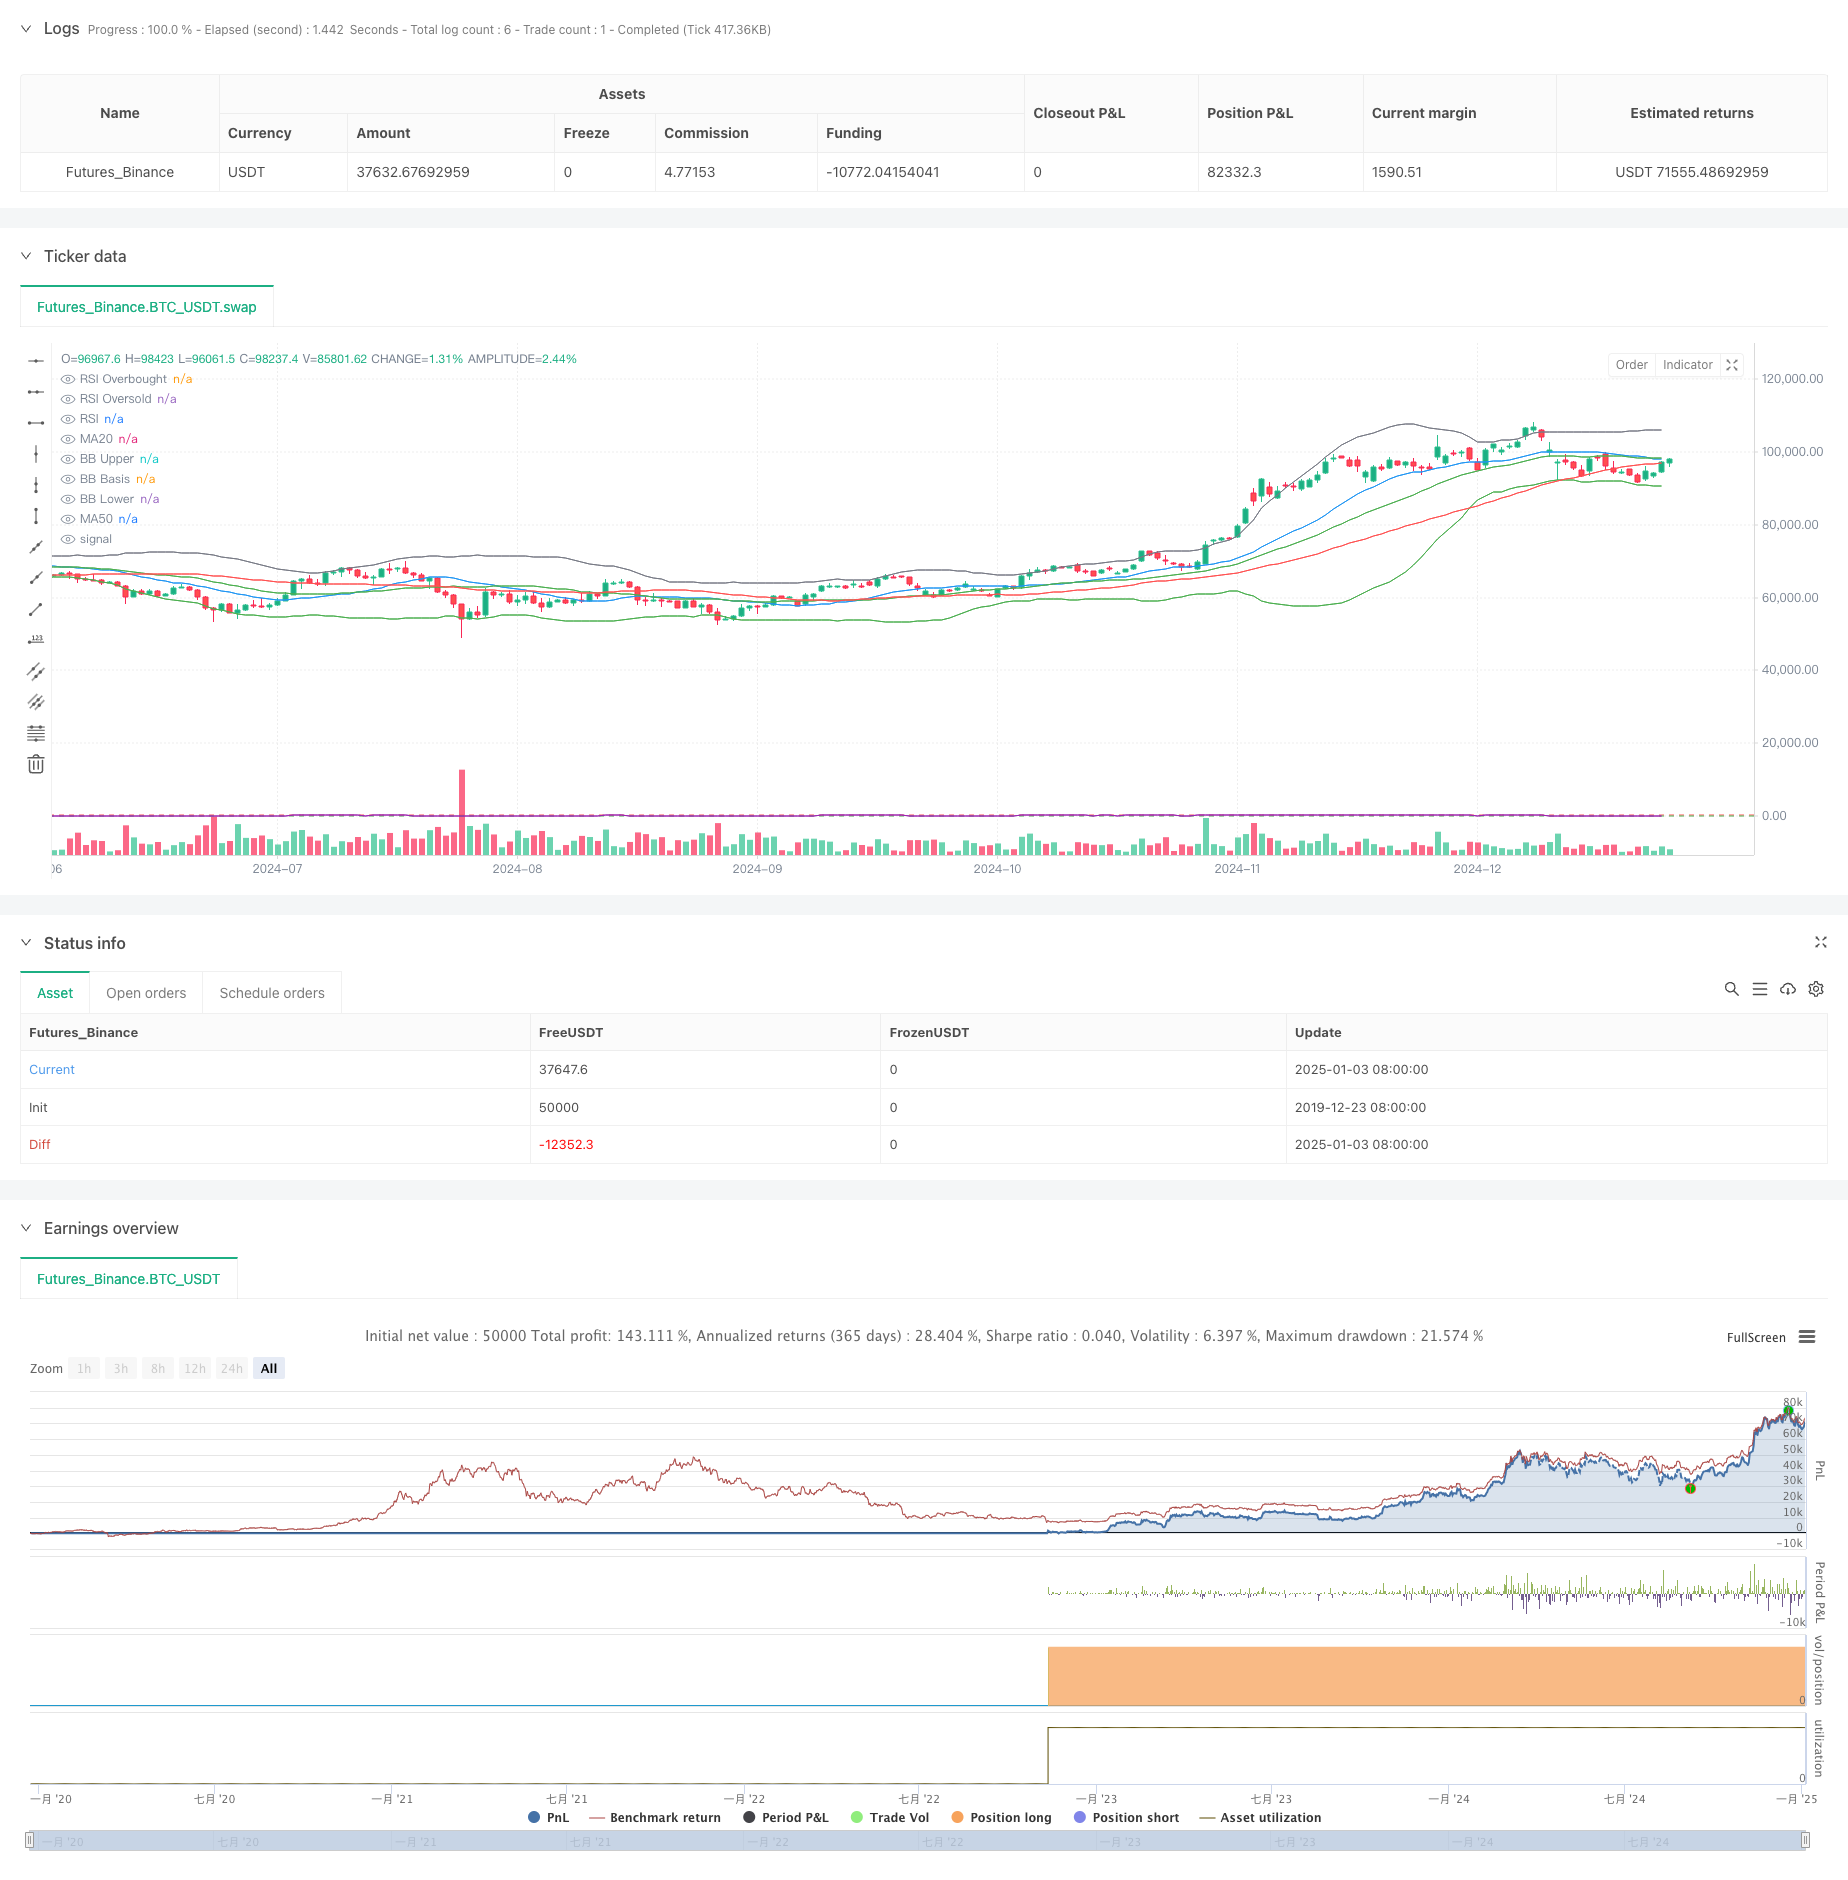
概述
本策略是一个融合了相对强弱指标(RSI)、移动平均线(MA)和布林带(BB)三大技术指标的量化交易系统。该策略通过综合分析多个技术指标的信号,在市场趋势与波动中寻找最佳交易机会。策略采用MA20与MA50的金叉死叉判断中期趋势,结合RSI超买超卖信号和布林带上下轨的突破回归,构建了一个完整的交易决策体系。
策略原理
策略的核心逻辑基于以下三个维度: 1. 趋势判断:使用MA20和MA50的交叉关系判断市场中期趋势,MA20上穿MA50视为上升趋势,反之为下降趋势。 2. 动量判断:采用RSI指标判断市场超买超卖状态,RSI低于25进入超卖区域,高于80进入超买区域。 3. 波动判断:运用布林带(BB30)上下轨道刻画价格波动区间,突破下轨视为超跌,突破上轨视为超涨。
做多条件需同时满足:RSI<25(超卖)+MA20>MA50(上升趋势)+价格<布林带下轨(超跌) 做空条件需同时满足:RSI>80(超买)+MA20布林带上轨(超涨)
策略优势
- 多指标交叉验证:通过整合趋势、动量和波动三个维度的指标,提高了交易信号的可靠性。
- 风险控制完善:RSI超买超卖阈值设置合理,能有效过滤虚假信号。
- 适应性强:布林带能根据市场波动度自适应调整,提高策略在不同市场环境下的表现。
- 参数可调性强:关键指标参数均可根据不同市场特征进行优化调整。
策略风险
- 滞后性风险:移动平均线具有一定滞后性,可能导致入场时机延迟。
- 震荡市风险:在横盘震荡市场中,可能产生频繁假信号。
- 趋势反转风险:强趋势突然反转时,策略反应可能不够及时。
- 参数敏感性:过度优化参数可能导致过拟合问题。
策略优化方向
- 引入成交量指标:建议增加成交量分析维度,提高趋势判断准确性。
- 优化止损机制:可设计基于ATR的动态止损,提高风险控制能力。
- 增加市场环境过滤:添加市场波动率判断,在高波动环境下调整策略参数。
- 完善仓位管理:根据信号强度设计动态仓位控制系统。
总结
该策略通过多技术指标的协同配合,构建了一个较为完善的交易系统。策略在趋势明确的市场中表现优异,但需要注意市场环境的变化并做出相应调整。通过持续优化和完善,该策略有望在实盘交易中取得稳定收益。
策略源码
/*backtest
start: 2019-12-23 08:00:00
end: 2025-01-04 08:00:00
period: 1d
basePeriod: 1d
exchanges: [{"eid":"Futures_Binance","currency":"BTC_USDT"}]
*/

//@version=5
strategy("RSI + MA + BB30 Strategy", overlay=true)

// === Cài đặt RSI ===
rsiLength = input(14, title="RSI Length")
rsiOverbought = input(80, title="RSI Overbought Level")
rsiOversold = input(25, title="RSI Oversold Level")
rsi = ta.rsi(close, rsiLength)

// === Cài đặt MA ===
maLength20 = input(20, title="MA20 Length")
maLength50 = input(50, title="MA50 Length")
ma20 = ta.sma(close, maLength20)
ma50 = ta.sma(close, maLength50)

// === Cài đặt Bollinger Bands (BB30) ===
bbLength = input(30, title="Bollinger Bands Length")
bbStdDev = input(2, title="BB Standard Deviation")
[bbUpper, bbBasis, bbLower] = ta.bb(close, bbLength, bbStdDev)

// === Điều kiện giao dịch ===
// Điều kiện Long
longCondition = (rsi < rsiOversold) and (ma20 > ma50) and (close < bbLower)

// Điều kiện Short
shortCondition = (rsi > rsiOverbought) and (ma20 < ma50) and (close > bbUpper)

// === Mở lệnh giao dịch ===
if (longCondition)
    strategy.entry("Long", strategy.long)

if (shortCondition)
    strategy.entry("Short", strategy.short)

// === Hiển thị chỉ báo trên biểu đồ ===
// Hiển thị MA
plot(ma20, color=color.blue, title="MA20")
plot(ma50, color=color.red, title="MA50")

// Hiển thị Bollinger Bands
plot(bbUpper, color=color.green, title="BB Upper")
plot(bbBasis, color=color.gray, title="BB Basis")
plot(bbLower, color=color.green, title="BB Lower")

// Hiển thị RSI và mức quan trọng
hline(rsiOverbought, "RSI Overbought", color=color.red, linestyle=hline.style_dashed)
hline(rsiOversold, "RSI Oversold", color=color.green, linestyle=hline.style_dashed)
plot(rsi, color=color.purple, title="RSI")
相关推荐