インディケーター: WaveTrend オシレーター
作者: リン・ハーンチャオチャン, 日時: 2022-05-06 18:40:27タグ:エイマSMA
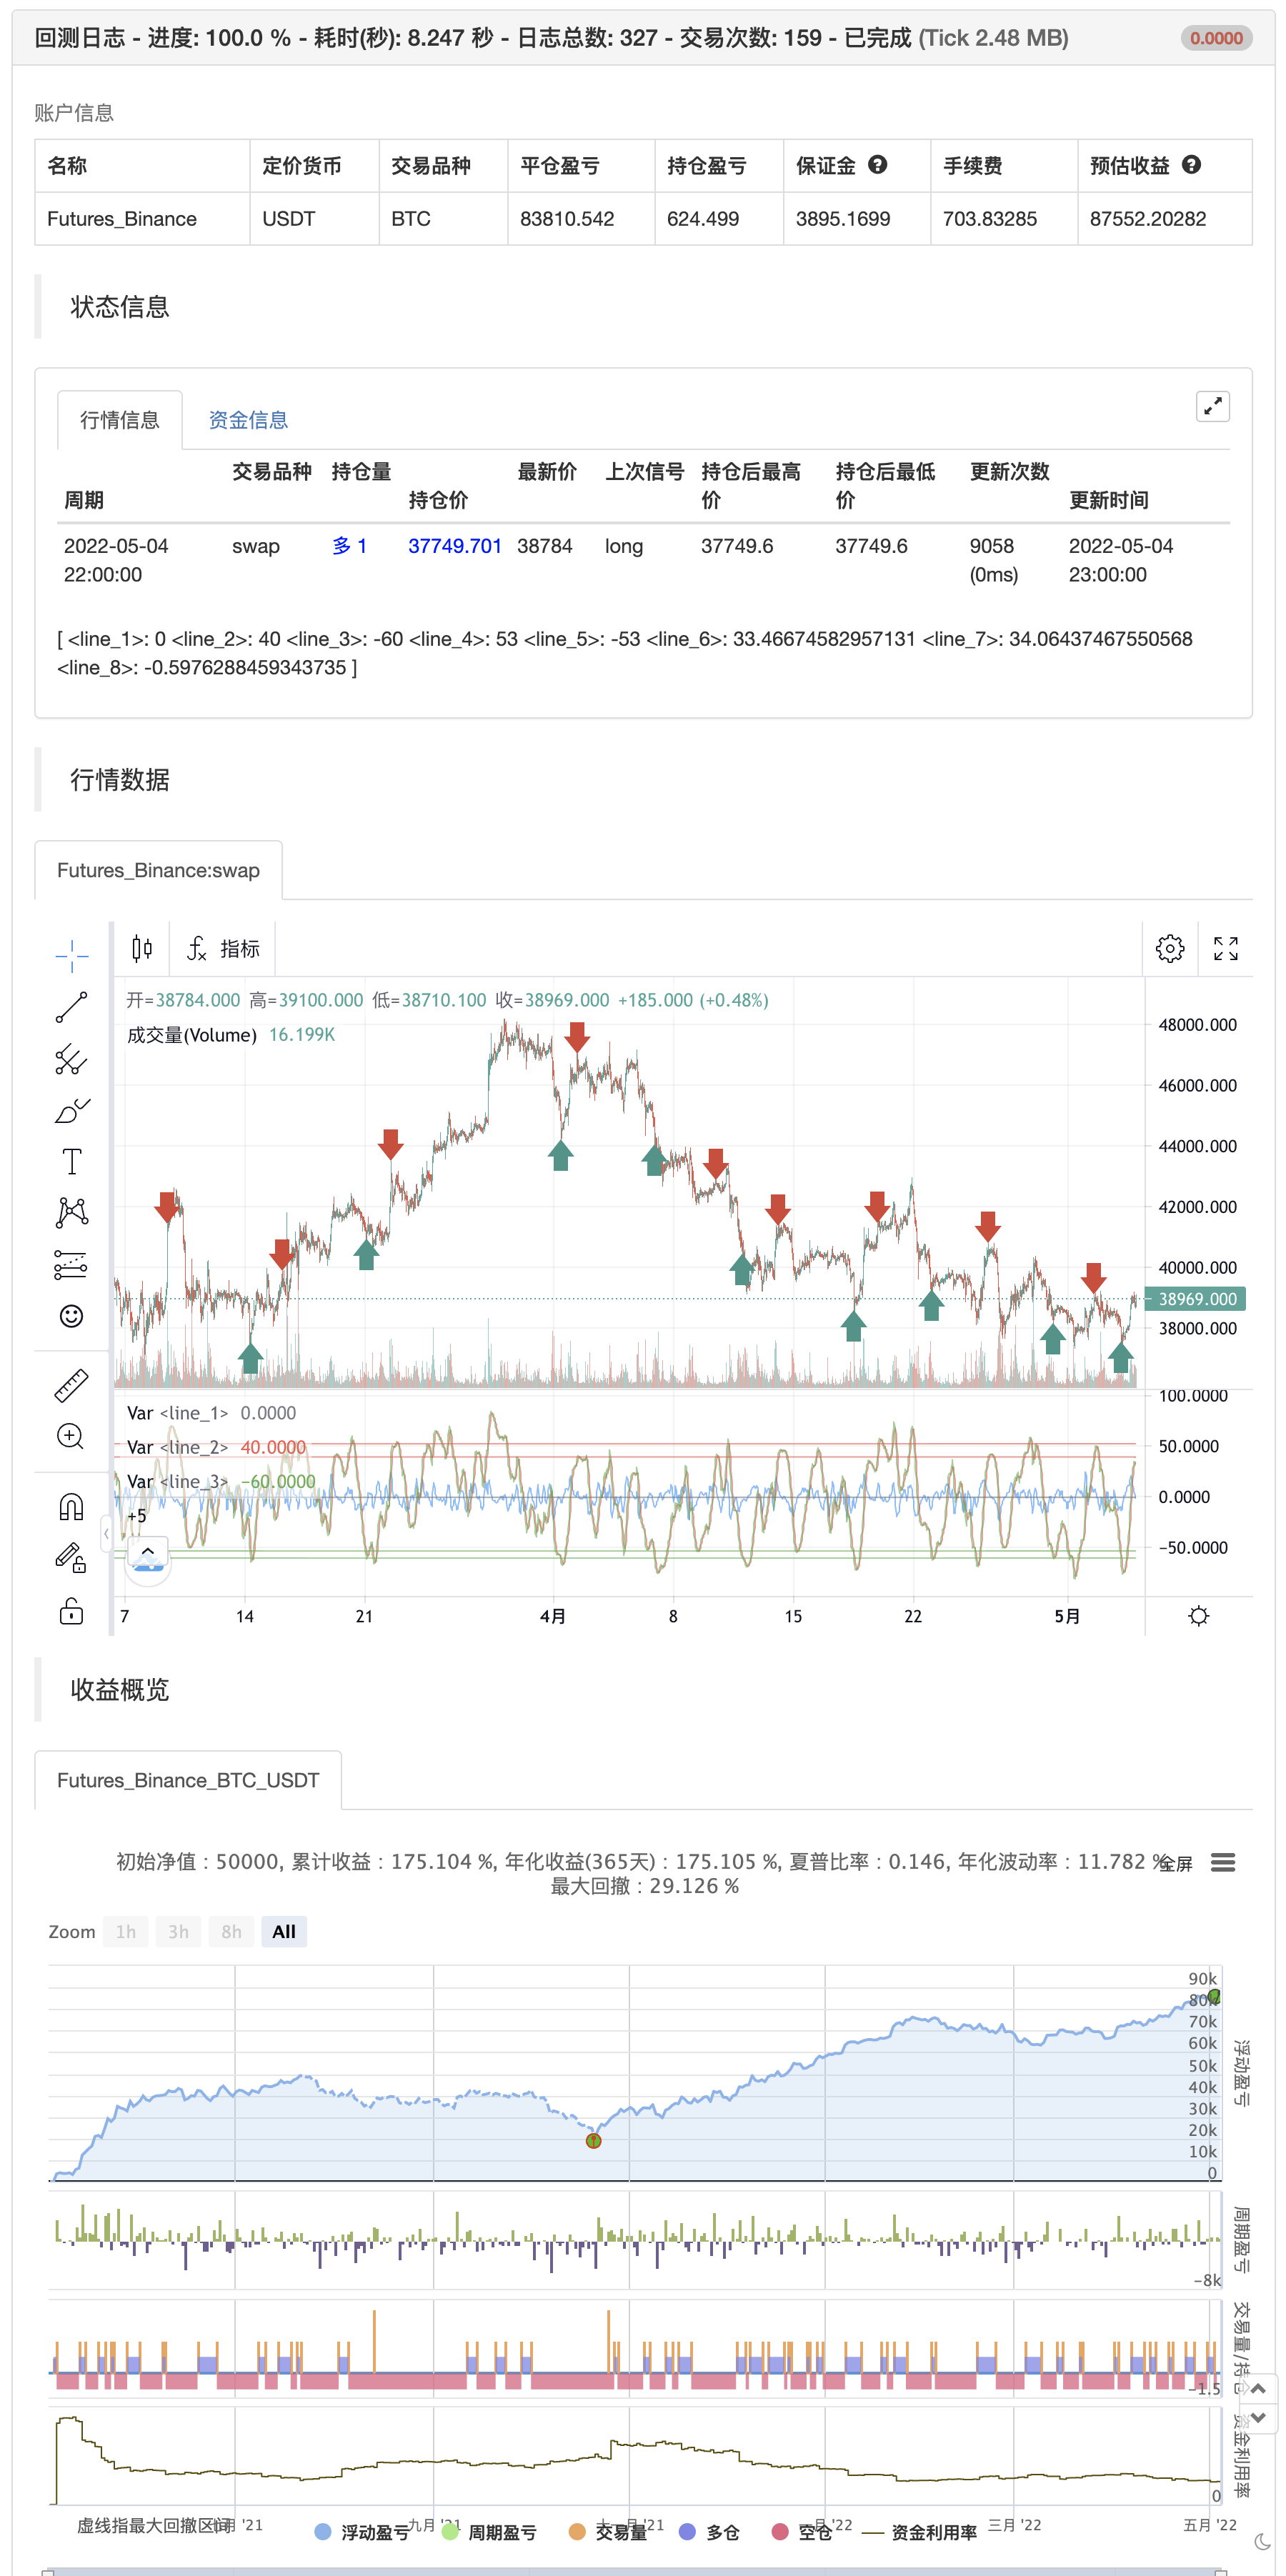
WaveTrend オシレーターは有名なTS/MT指標のポートです オスイレーターがオーバー購入帯 (赤線) の上から信号 (点点線) を下を通過すると,通常は良いSELL信号である.同様に,オスイレーターがオーバー販売帯 (緑線) の下にある信号の上を通過すると,それは良いBUY信号である.
グラフにいくつかのクロスオーバーをマークしました. ご覧のように,ないWTが生成する唯一の有用な信号です 楽器で試してどう思うか教えて下さい
復習する

/*backtest
start: 2021-05-05 00:00:00
end: 2022-05-04 23:59:00
period: 1h
basePeriod: 15m
exchanges: [{"eid":"Futures_Binance","currency":"BTC_USDT"}]
args: [["v_input_3",40]]
*/

//
// @author LazyBear
//
// If you use this code in its original/modified form, do drop me a note.
//
study(title="WaveTrend [LazyBear]", shorttitle="WT_LB")
n1 = input(10, "Channel Length")
n2 = input(21, "Average Length")
obLevel1 = input(60, "Over Bought Level 1")
obLevel2 = input(53, "Over Bought Level 2")
osLevel1 = input(-60, "Over Sold Level 1")
osLevel2 = input(-53, "Over Sold Level 2")

ap = hlc3
esa = ta.ema(ap, n1)
d = ta.ema(math.abs(ap - esa), n1)
ci = (ap - esa) / (0.015 * d)
tci = ta.ema(ci, n2)

wt1 = tci
wt2 = ta.sma(wt1,4)

plot(0, color=color.gray)
plot(obLevel1, color=color.red)
plot(osLevel1, color=color.green)
plot(obLevel2, color=color.red, style=3)
plot(osLevel2, color=color.green, style=3)

plot(wt1, color=color.green)
plot(wt2, color=color.red, style=3)
plot(wt1-wt2, color=color.blue, transp=80)
if wt1 >obLevel1
    strategy.entry("entry short", strategy.short)
else if wt1 < osLevel1
    strategy.entry("entry long", strategy.long)
関連コンテンツ
- 複数の波動のトレンド リスク管理の量化戦略
- 多指数移動平均線交差動力戦略
- 双均線取引のトレンド確認量化取引戦略
- 高級量化トレンド追跡とクラウドマップ逆転混合取引戦略
- EMAの交差動力ショートトレード戦略
- SMA双均線交差戦略
- ABC取引
- EMA,SMA,均線交差,動力指標
- EMA5とEMA13を交差する戦略
- マルチ均線トレンド動力認識とストップ損失取引システム
- 超均線とUpperbandを交差する戦略
もっと見る
- スーパートレンド戦略
- スイング・ハイス/ローズ&キャンドル・パターン
- TMA オーバーレイ
- MACD + SMA 200 戦略
- CM スリングショットシステム
- ボリンガー+RSI,ダブル戦略 v1.1
- ボリンジャー・バンド戦略
- オプティマイズされたトレンドトラッカー
- パインスクリプト戦略における月間リターン
- v4 の ADX と DI
- MacD カスタム インディケーター - 多重タイムフレーム+すべてのオプション!
- 圧縮モメント インディケーター
- アルファトレンド
- 周期間均線取引
- 感情オシレーター
- コイン・アンドロはコイン対で取引し,現金で市場価格の清算に使用される.
- 海岸取引法
- トレンドにしよう
- アルファトレンド使用
- デジタル通貨の現貨で新しい略奪戦略 (教材)