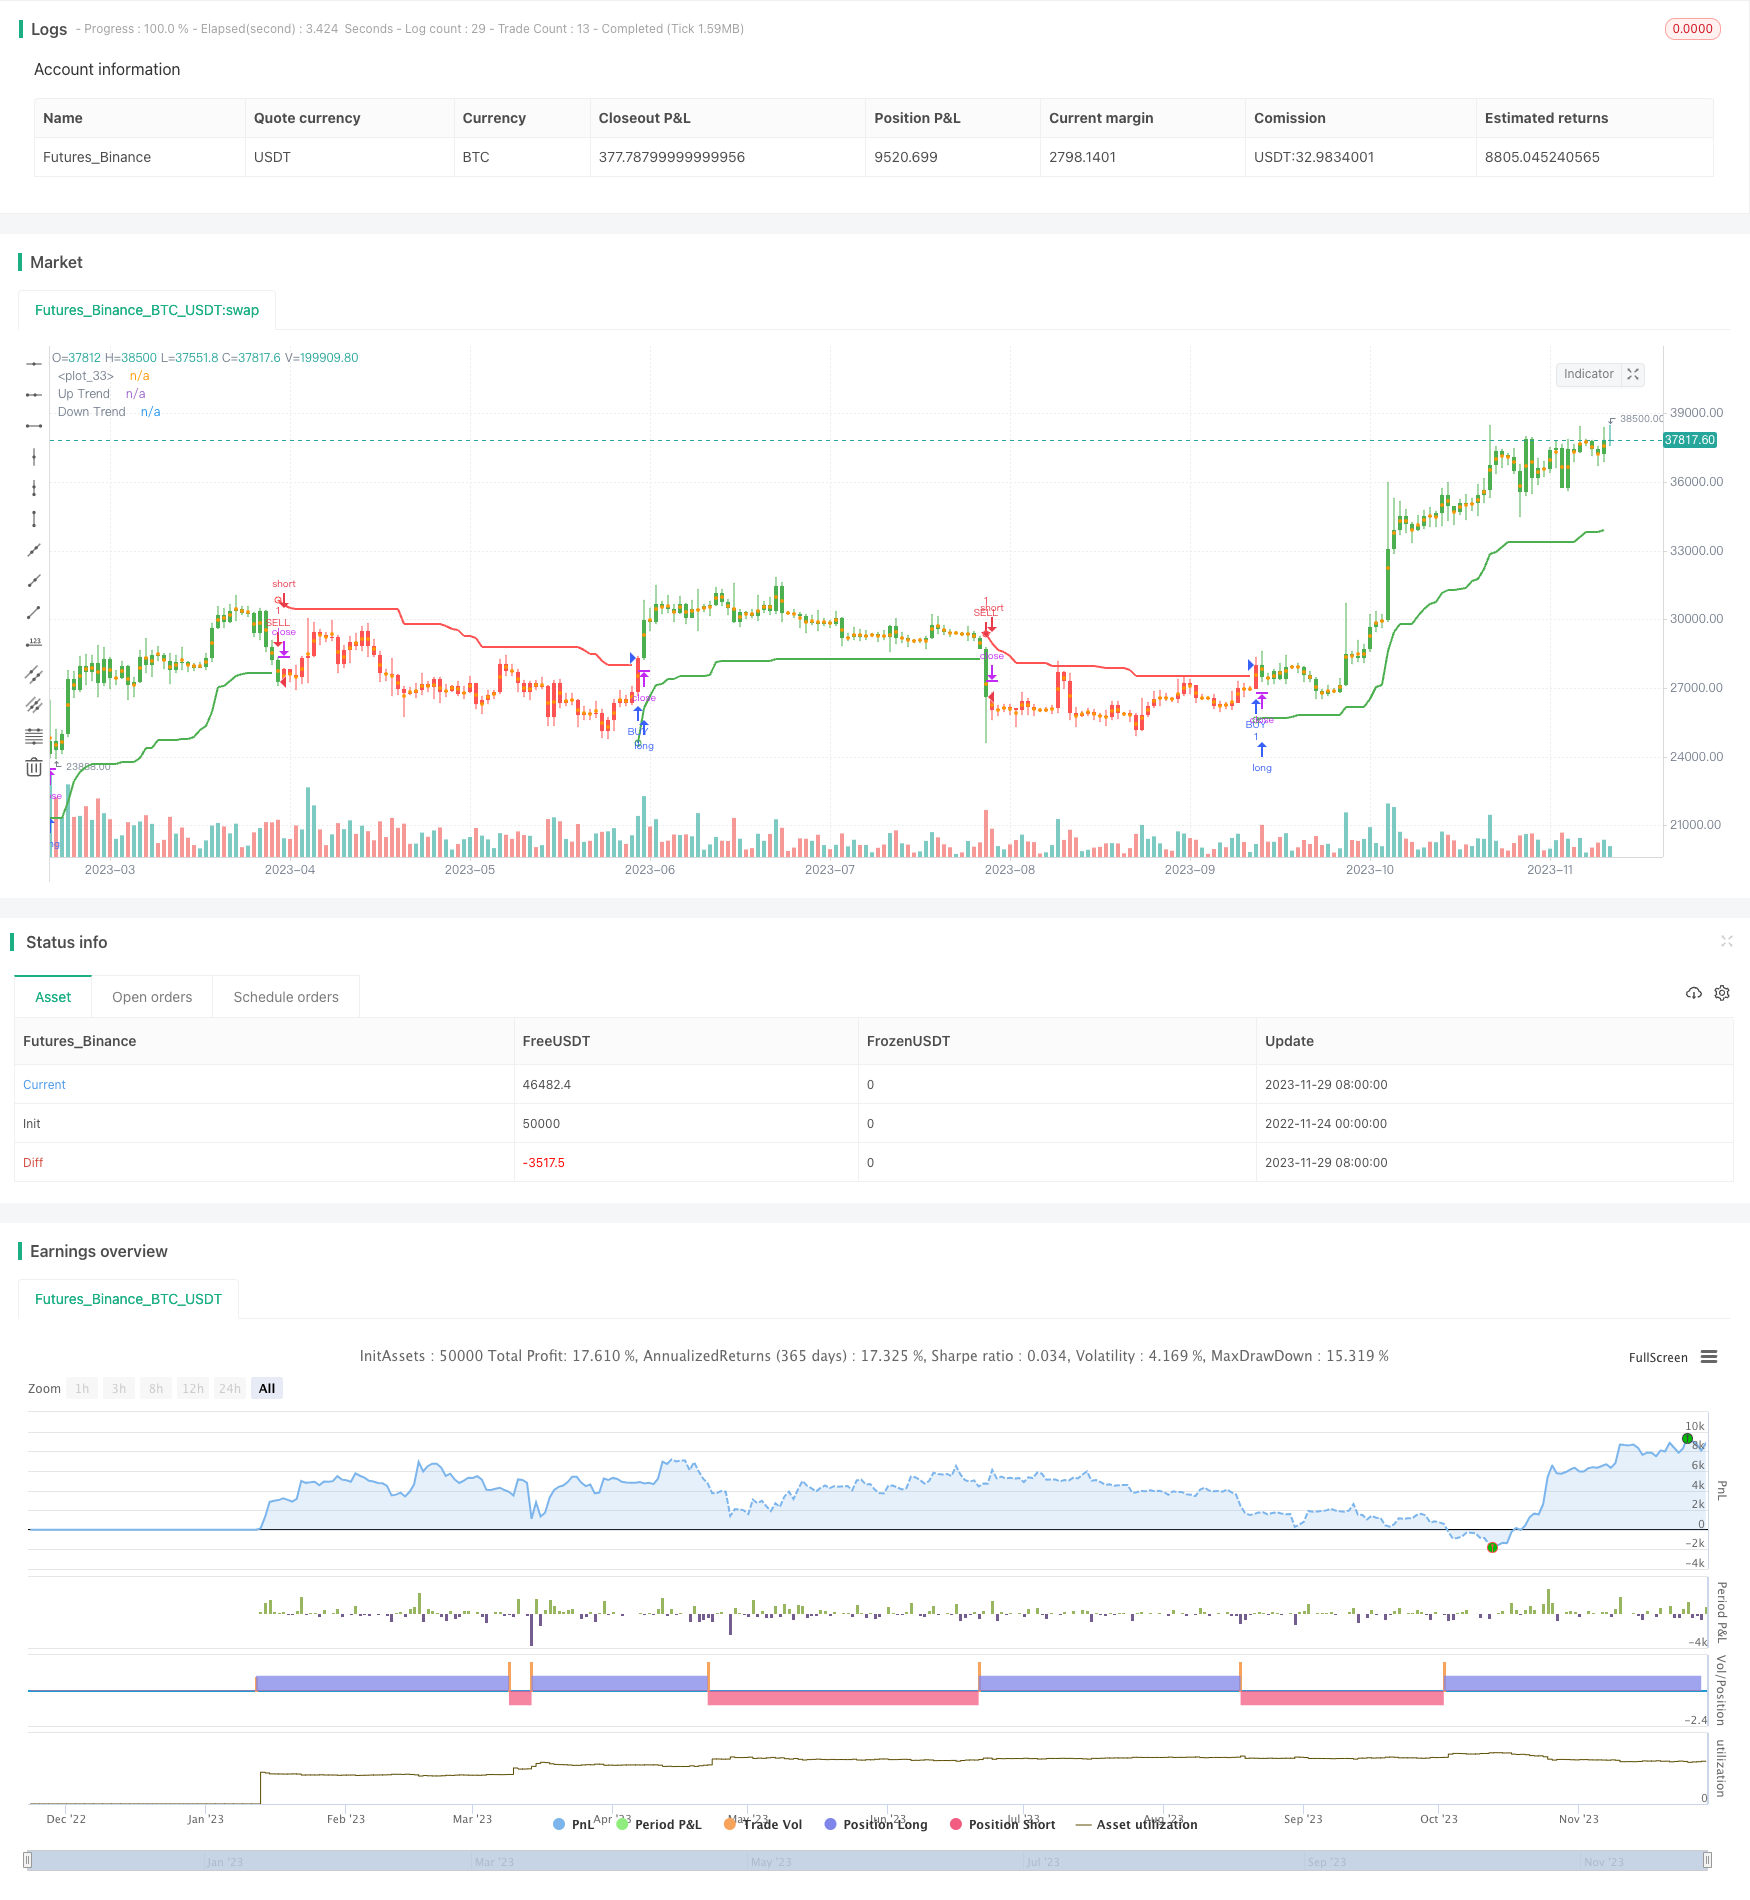
スーパートレンド ボリンジャーバンド戦略
作者: リン・ハーンチャオチャン, 日付: 2023-12-01 16:29:56タグ:

概要
スーパートレンドボリンガーバンド戦略は,ATR (平均真差) をベースとした一般的なトレーリングストップ指標戦略である.この戦略は,スーパートレンド指標を使用して,チャート上で上昇傾向と下落傾向のチャネルを描き,ボリンガーバンドと組み合わせて取引信号を生成する.
戦略の論理
この戦略は,スーパートレンドラインを計算するために,2つの主要なパラメータ - 期間と倍数,それぞれ10と3のデフォルト値を使用します. 具体的な計算式は以下のとおりです.
上行: 閉じる - (倍数 x ATR) 下の線: 閉じる + (倍数 x ATR)
閉じる価格が前の一番上線よりも高くなった場合,それは上昇信号とみなされます.閉じる価格が前の一番下線を下回ると,それは下落信号とみなされます.
この戦略には,中間帯をベースラインとして使用し,上下帯は2つの標準偏差から離れた位置にあるボリンジャー帯指標も含まれる.価格が下から中間帯を超えると購入信号が生成される.価格が上から中間帯を下に突破すると販売信号が生成される.
利点
- ATR を使って動的変動を計算し,市場の動向変化を迅速に把握する
- ボリンジャー・バンドを組み合わせることで,取引シグナルがより信頼性が高まります.
- 調整可能なパラメータは,異なる市場環境に適しています.
リスク
- 横向市場では誤った信号に易しい
- パラメータの設定が正しくない場合,取引が過剰になる可能性があります.
- 傾向の逆転点を特定できず,一定の遅延がある
オプティマイゼーションの方向性
- フィルターを使用してノイズ取引を減らすためにATR期間パラメータを最適化
- 他の指標を組み込み,利益の追及可能性を減らすためにサポート/レジスタンスを決定する.
- 取引損失を制限するポジションサイズルールを追加する
概要
スーパートレンド・ボリンガー・バンド戦略は,複数の技術指標の強みを統合し,市場のトレンドを効果的に追跡するためにダイナミックなトレーリング・ストップメカニズムを使用する.この高度にカスタマイズ可能な戦略は,異なる市場にうまく適応し,推奨されるブレイクアウト追いかける戦略となっています.しかし,ウィップソーや過剰取引などのリスクは,より複雑な市場環境に適したさらなる最適化によって対処する必要があります.
/*backtest
start: 2022-11-24 00:00:00
end: 2023-11-30 00:00:00
period: 1d
basePeriod: 1h
exchanges: [{"eid":"Futures_Binance","currency":"BTC_USDT"}]
*/

// This source code is subject to the terms of the Mozilla Public License 2.0 at https://mozilla.org/MPL/2.0/
// © KivancOzbilgic


//@version=4
strategy("SuperTrend STRATEGY", overlay=true)
Periods = input(title="ATR Period", type=input.integer, defval=10)
src = input(hl2, title="Source")
Multiplier = input(title="ATR Multiplier", type=input.float, step=0.1, defval=3.0)
changeATR= input(title="Change ATR Calculation Method ?", type=input.bool, defval=true)
showsignals = input(title="Show Buy/Sell Signals ?", type=input.bool, defval=false)
highlighting = input(title="Highlighter On/Off ?", type=input.bool, defval=true)
barcoloring = input(title="Bar Coloring On/Off ?", type=input.bool, defval=true)
atr2 = sma(tr, Periods)
atr= changeATR ? atr(Periods) : atr2
up=src-(Multiplier*atr)
up1 = nz(up[1],up)
up := close[1] > up1 ? max(up,up1) : up
dn=src+(Multiplier*atr)
dn1 = nz(dn[1], dn)
dn := close[1] < dn1 ? min(dn, dn1) : dn
trend = 1
trend := nz(trend[1], trend)
trend := trend == -1 and close > dn1 ? 1 : trend == 1 and close < up1 ? -1 : trend
upPlot = plot(trend == 1 ? up : na, title="Up Trend", style=plot.style_linebr, linewidth=2, color=color.green)
buySignal = trend == 1 and trend[1] == -1
plotshape(buySignal ? up : na, title="UpTrend Begins", location=location.absolute, style=shape.circle, size=size.tiny, color=color.green, transp=0)
plotshape(buySignal and showsignals ? up : na, title="Buy", text="Buy", location=location.absolute, style=shape.labelup, size=size.tiny, color=color.green, textcolor=color.white, transp=0)
dnPlot = plot(trend == 1 ? na : dn, title="Down Trend", style=plot.style_linebr, linewidth=2, color=color.red)
sellSignal = trend == -1 and trend[1] == 1
plotshape(sellSignal ? dn : na, title="DownTrend Begins", location=location.absolute, style=shape.circle, size=size.tiny, color=color.red, transp=0)
plotshape(sellSignal and showsignals ? dn : na, title="Sell", text="Sell", location=location.absolute, style=shape.labeldown, size=size.tiny, color=color.red, textcolor=color.white, transp=0)
mPlot = plot(ohlc4, title="", style=plot.style_circles, linewidth=0)
longFillColor = highlighting ? (trend == 1 ? color.green : color.white) : color.white
shortFillColor = highlighting ? (trend == -1 ? color.red : color.white) : color.white
fill(mPlot, upPlot, title="UpTrend Highligter", color=longFillColor)
fill(mPlot, dnPlot, title="DownTrend Highligter", color=shortFillColor)
FromMonth = input(defval = 9, title = "From Month", minval = 1, maxval = 12)
FromDay   = input(defval = 1, title = "From Day", minval = 1, maxval = 31)
FromYear  = input(defval = 2018, title = "From Year", minval = 999)
ToMonth   = input(defval = 1, title = "To Month", minval = 1, maxval = 12)
ToDay     = input(defval = 1, title = "To Day", minval = 1, maxval = 31)
ToYear    = input(defval = 9999, title = "To Year", minval = 999)
start     = timestamp(FromYear, FromMonth, FromDay, 00, 00)
finish    = timestamp(ToYear, ToMonth, ToDay, 23, 59)
window()  => time >= start and time <= finish ? true : false
longCondition = buySignal
if (longCondition)
    strategy.entry("BUY", strategy.long)
shortCondition = sellSignal
if (shortCondition)
    strategy.entry("SELL", strategy.short)
buy1= barssince(buySignal)
sell1 = barssince(sellSignal)
color1 = buy1[1] < sell1[1] ? color.green : buy1[1] > sell1[1] ? color.red : na
barcolor(barcoloring ? color1 : na)
もっと
- スピード・アンド・ロング EMA ゴールデンクロス・ブレークスルー戦略
- RSIと移動平均の組み合わせ MT5 マルティンゲール スカルピング戦略
- 波動性停止追跡戦略
- 複数の指標を持つ振動位置定位突破戦略
- RSI平均逆転量的な取引戦略
- 2つの移動平均のクロスオーバー逆転戦略
- 移動平均線逆クロスオーバー戦略
- Hull MAチャネルと線形回帰スウィング・トレーディング戦略
- トリプルスーパートレンド量的な取引戦略
- ATRとMAの組み合わせに基づいたスーパートレンド取引戦略
- 双重逆転追跡戦略
- 聖杯戦略
- 複数パーセントの利益の脱出戦略
- 価格量変化に基づく価格量傾向戦略の修正
- 2つの移動平均のクロスオーバー戦略
- 双指数コンボ クレイジー・イントラデイ・スカルピング戦略
- ダイナミック・グリッド・トレーディング・戦略
- 双向移動平均取引戦略
- 初期利益率移動平均 オープニングベル・エグジット戦略
- 月間パラボリック・ブレイクアウト戦略