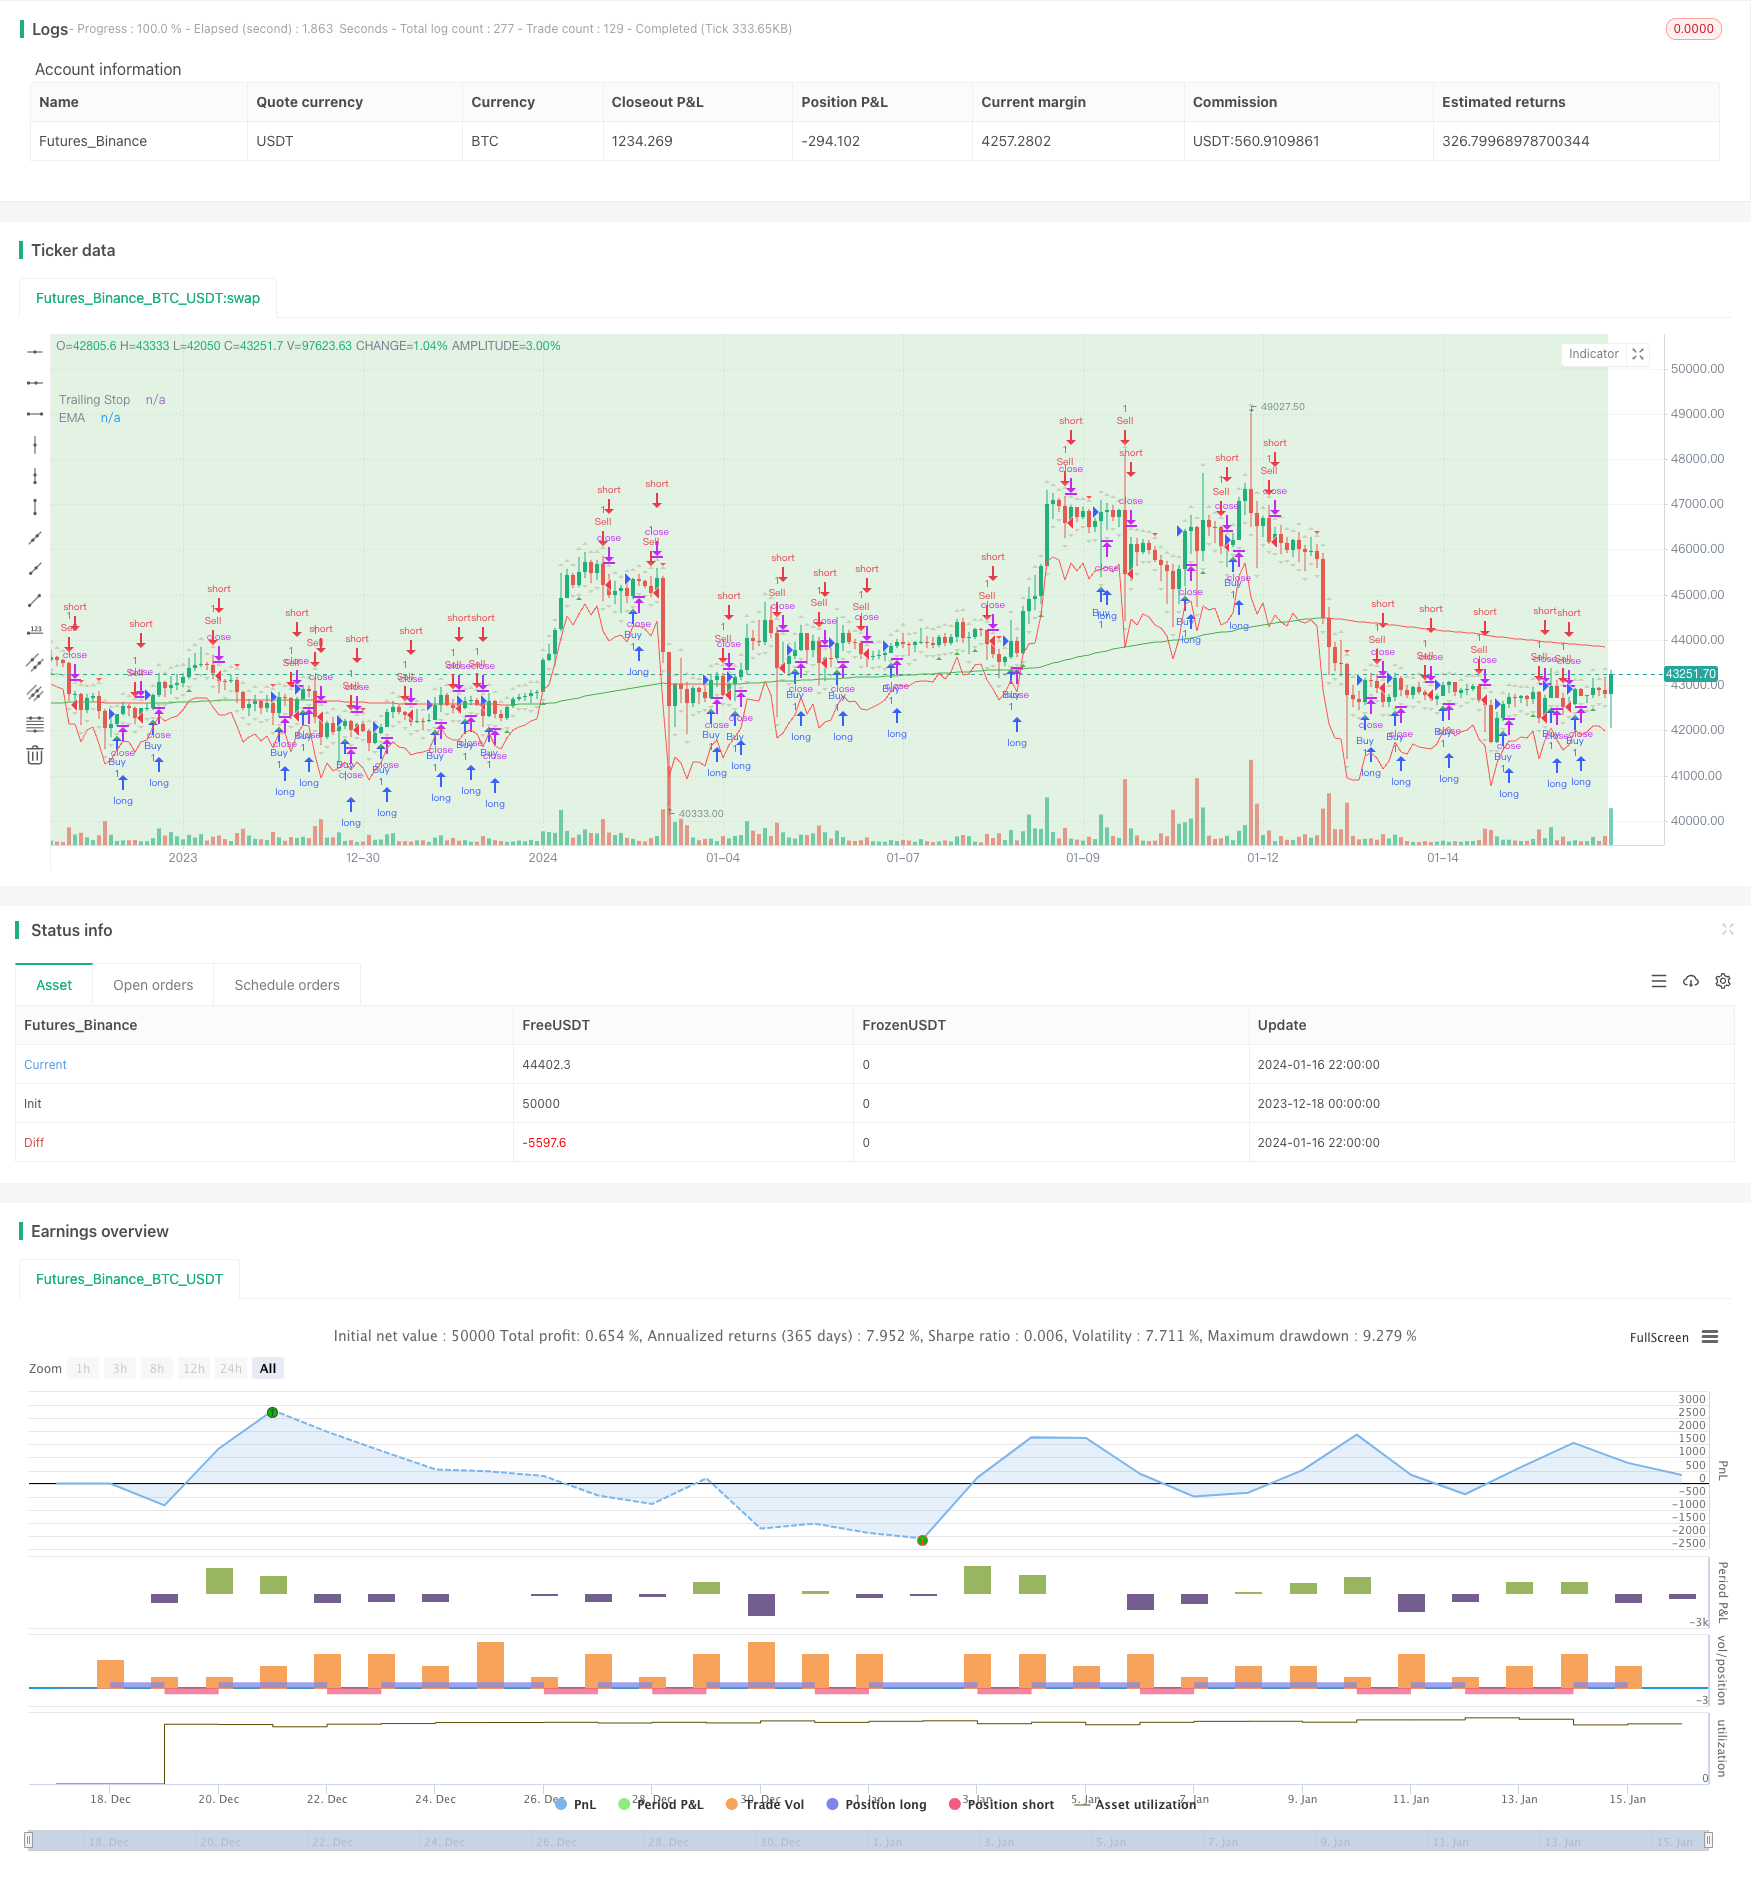
EMAとTrailing Stopを伴う供給と需要ゾーンに基づく取引戦略
作者: リン・ハーンチャオチャン,日付: 2024-01-18 16:41:16タグ:

概要
この戦略は,供給と需要ゾーン,指数関数移動平均 (EMA),および平均真の範囲 (ATR) のトレーリングストップをトレードシグナルに使用する.ユーザーは,EMA設定とシグナル可視性を調整することができます.この戦略は,Higher High (HH),Lower Low (LL),Lower High (LH),およびHigher Low (HL) ゾーンをマークします.シグナルは,バックテストに適した3番目のキャンドル後に表示されます.
戦略の論理
インディケーター計算
指数関数移動平均 (EMA):
- EMAは,一期間の閉場価格から計算される (デフォルト: 200).
- 式:EMA = (Price_t x α) + (EMA_t-1 x (1 - α)),ここでα = 2/(長さ + 1)
平均実範囲 (ATR):
- ATRは,実際の価格範囲から市場変動を測定する.
- 真の範囲は次のうち最大の範囲です.
- 高流マイナス低流
- 現在の高値マイナス前の閉じる絶対値
- 現在の低値マイナス前の低値の絶対値
- ATRは通常 14 周期を使用します.
傾向の EMA と波動性に基づくトレーリングストップの ATR を決定するために使用されます.
供給と需要の領域の識別
-
高さ 高さ (HH): 現在のピーク > 前回のピーク,上昇勢い
-
低低 (LL): 低流位 < 前低流位,下向きの勢い
-
高低 (HL): 現在の低位 > 前回の低位,上向きの継続
-
低高 (LH): 現在のピーク < 前回のピーク,下向きの継続
逆転や継続を特定するために動向で用いられる.
入国と出国
入力信号: 3番目のキャンドルの閉じる時,前回の高値/低値以上/下値で買い/売る.
出口: ATRをベースにストップ損失を追跡する.
利点
- トレンド,逆転,変動を組み合わせて 強力な信号を出す
- 需要/供給領域は,主要なS/Rを識別する.
- 動的ATRストップは 変動に合わせて調整されます
- パラメータをカスタマイズできます
- シンプルな入場ルール
リスク と 改善
- 誤った信号 EMAの長さを最適化
- 高いATR倍数で トレンドを追いかけるリスクがあります
- 追加フィルタを考慮してください
- トレンドを中心としたアプローチをテストします
結論
適切なバックテストのための複数のテクニックを組み合わせます. 現実世界は複雑で,最適化は鍵です. 基本的な戦略は拡張と組み合わせを可能にします.
/*backtest
start: 2023-12-18 00:00:00
end: 2024-01-17 00:00:00
period: 2h
basePeriod: 15m
exchanges: [{"eid":"Futures_Binance","currency":"BTC_USDT"}]
*/

//@version=5
strategy("Supply and Demand Zones with EMA and Trailing Stop", shorttitle="SD Zones", overlay=true)

showBuySignals = input(true, title="Show Buy Signals", group="Signals")
showSellSignals = input(true, title="Show Sell Signals", group="Signals")
showHLZone = input(true, title="Show HL Zone", group="Zones")
showLHZone = input(true, title="Show LH Zone", group="Zones")
showHHZone = input(true, title="Show HH Zone", group="Zones")
showLLZone = input(true, title="Show LL Zone", group="Zones")

emaLength = input(200, title="EMA Length", group="EMA Settings")
atrLength = input(14, title="ATR Length", group="Trailing Stop")
atrMultiplier = input(2, title="ATR Multiplier", group="Trailing Stop")

// Function to identify supply and demand zones
getZones(src, len, mult) =>
    base = request.security(syminfo.tickerid, "D", close)
    upper = request.security(syminfo.tickerid, "D", high)
    lower = request.security(syminfo.tickerid, "D", low)
    multiplier = request.security(syminfo.tickerid, "D", mult)
    zonetype = base + multiplier * len
    zone = src >= zonetype
    [zone, upper, lower]

// Identify supply and demand zones
[supplyZone, _, _] = getZones(close, high[1] - low[1], 1)
[demandZone, _, _] = getZones(close, high[1] - low[1], -1)

// Plot supply and demand zones
bgcolor(supplyZone ? color.new(color.red, 80) : na)
bgcolor(demandZone ? color.new(color.green, 80) : na)

// EMA with Linear Weighted method
ema = ta.ema(close, emaLength)

// Color code EMA based on its relation to candles
emaColor = close > ema ? color.new(color.green, 0) : close < ema ? color.new(color.red, 0) : color.new(color.yellow, 0)

// Plot EMA
plot(ema, color=emaColor, title="EMA")

// Entry Signal Conditions after the third candle
longCondition = ta.crossover(close, high[1]) and bar_index >= 2
shortCondition = ta.crossunder(close, low[1]) and bar_index >= 2

// Trailing Stop using ATR
atrValue = ta.atr(atrLength)
trailStop = close - atrMultiplier * atrValue

// Strategy Entry and Exit
if (longCondition)
    strategy.entry("Buy", strategy.long)
    strategy.exit("TrailStop", from_entry="Buy", loss=trailStop)

if (shortCondition)
    strategy.entry("Sell", strategy.short)
    strategy.exit("TrailStop", from_entry="Sell", loss=trailStop)

// Plot Entry Signals
plotshape(series=showBuySignals ? longCondition : na, title="Buy Signal", color=color.new(color.green, 0), style=shape.triangleup, location=location.belowbar)
plotshape(series=showSellSignals ? shortCondition : na, title="Sell Signal", color=color.new(color.red, 0), style=shape.triangledown, location=location.abovebar)

// Plot Trailing Stop
plot(trailStop, color=color.new(color.red, 0), title="Trailing Stop")

// Plot HH, LL, LH, and HL zones
plotshape(series=showHHZone and ta.highest(high, 2)[1] and ta.highest(high, 2)[2] ? 1 : na, title="HH Zone", color=color.new(color.blue, 80), style=shape.triangleup, location=location.abovebar)
plotshape(series=showLLZone and ta.lowest(low, 2)[1] and ta.lowest(low, 2)[2] ? 1 : na, title="LL Zone", color=color.new(color.blue, 80), style=shape.triangledown, location=location.belowbar)
plotshape(series=showLHZone and ta.highest(high, 2)[1] and ta.lowest(low, 2)[2] ? 1 : na, title="LH Zone", color=color.new(color.orange, 80), style=shape.triangleup, location=location.abovebar)
plotshape(series=showHLZone and ta.lowest(low, 2)[1] and ta.highest(high, 2)[2] ? 1 : na, title="HL Zone", color=color.new(color.orange, 80), style=shape.triangledown, location=location.belowbar)
もっと
- イチモク・クラウド・チャートに基づくトレンド戦略最適化
- クロストレンド逆転と3つのオシレーターダブル戦略を組み合わせた
- 定量取引のための移動平均戦略を持つフィボナッチ平均キャンドル
- % に基づいたシンプルなストップ&購入戦略
- ガウス誤差関数に基づく定量的な取引戦略の分析
- RSI 逆転戦略
- RSI-VWAP 短期的な量子戦略
- アダプティブ・仮想通貨・グリッド・トレーディング・ストラテジー
- 双重移動平均のクロスオーバー戦略
- 双向移動平均取引戦略
- ボリンジャー・バンドをベースにしたトレンド フォローする戦略
- 拡大価格量動向戦略
- 短期の振動追跡戦略
- 攻撃的な底部狙撃量的な戦略
- T3指標に基づく取引戦略の傾向
- ストカスティック指数に基づく短期取引戦略
- ロンドンのSMAクロスETH逆転取引戦略
- SMAとATRに基づくトレンド追跡戦略
- ヒロアクティベーター 買って売るシグナル戦略
- 指数関数式スムーズストカスティックオシレーター戦略