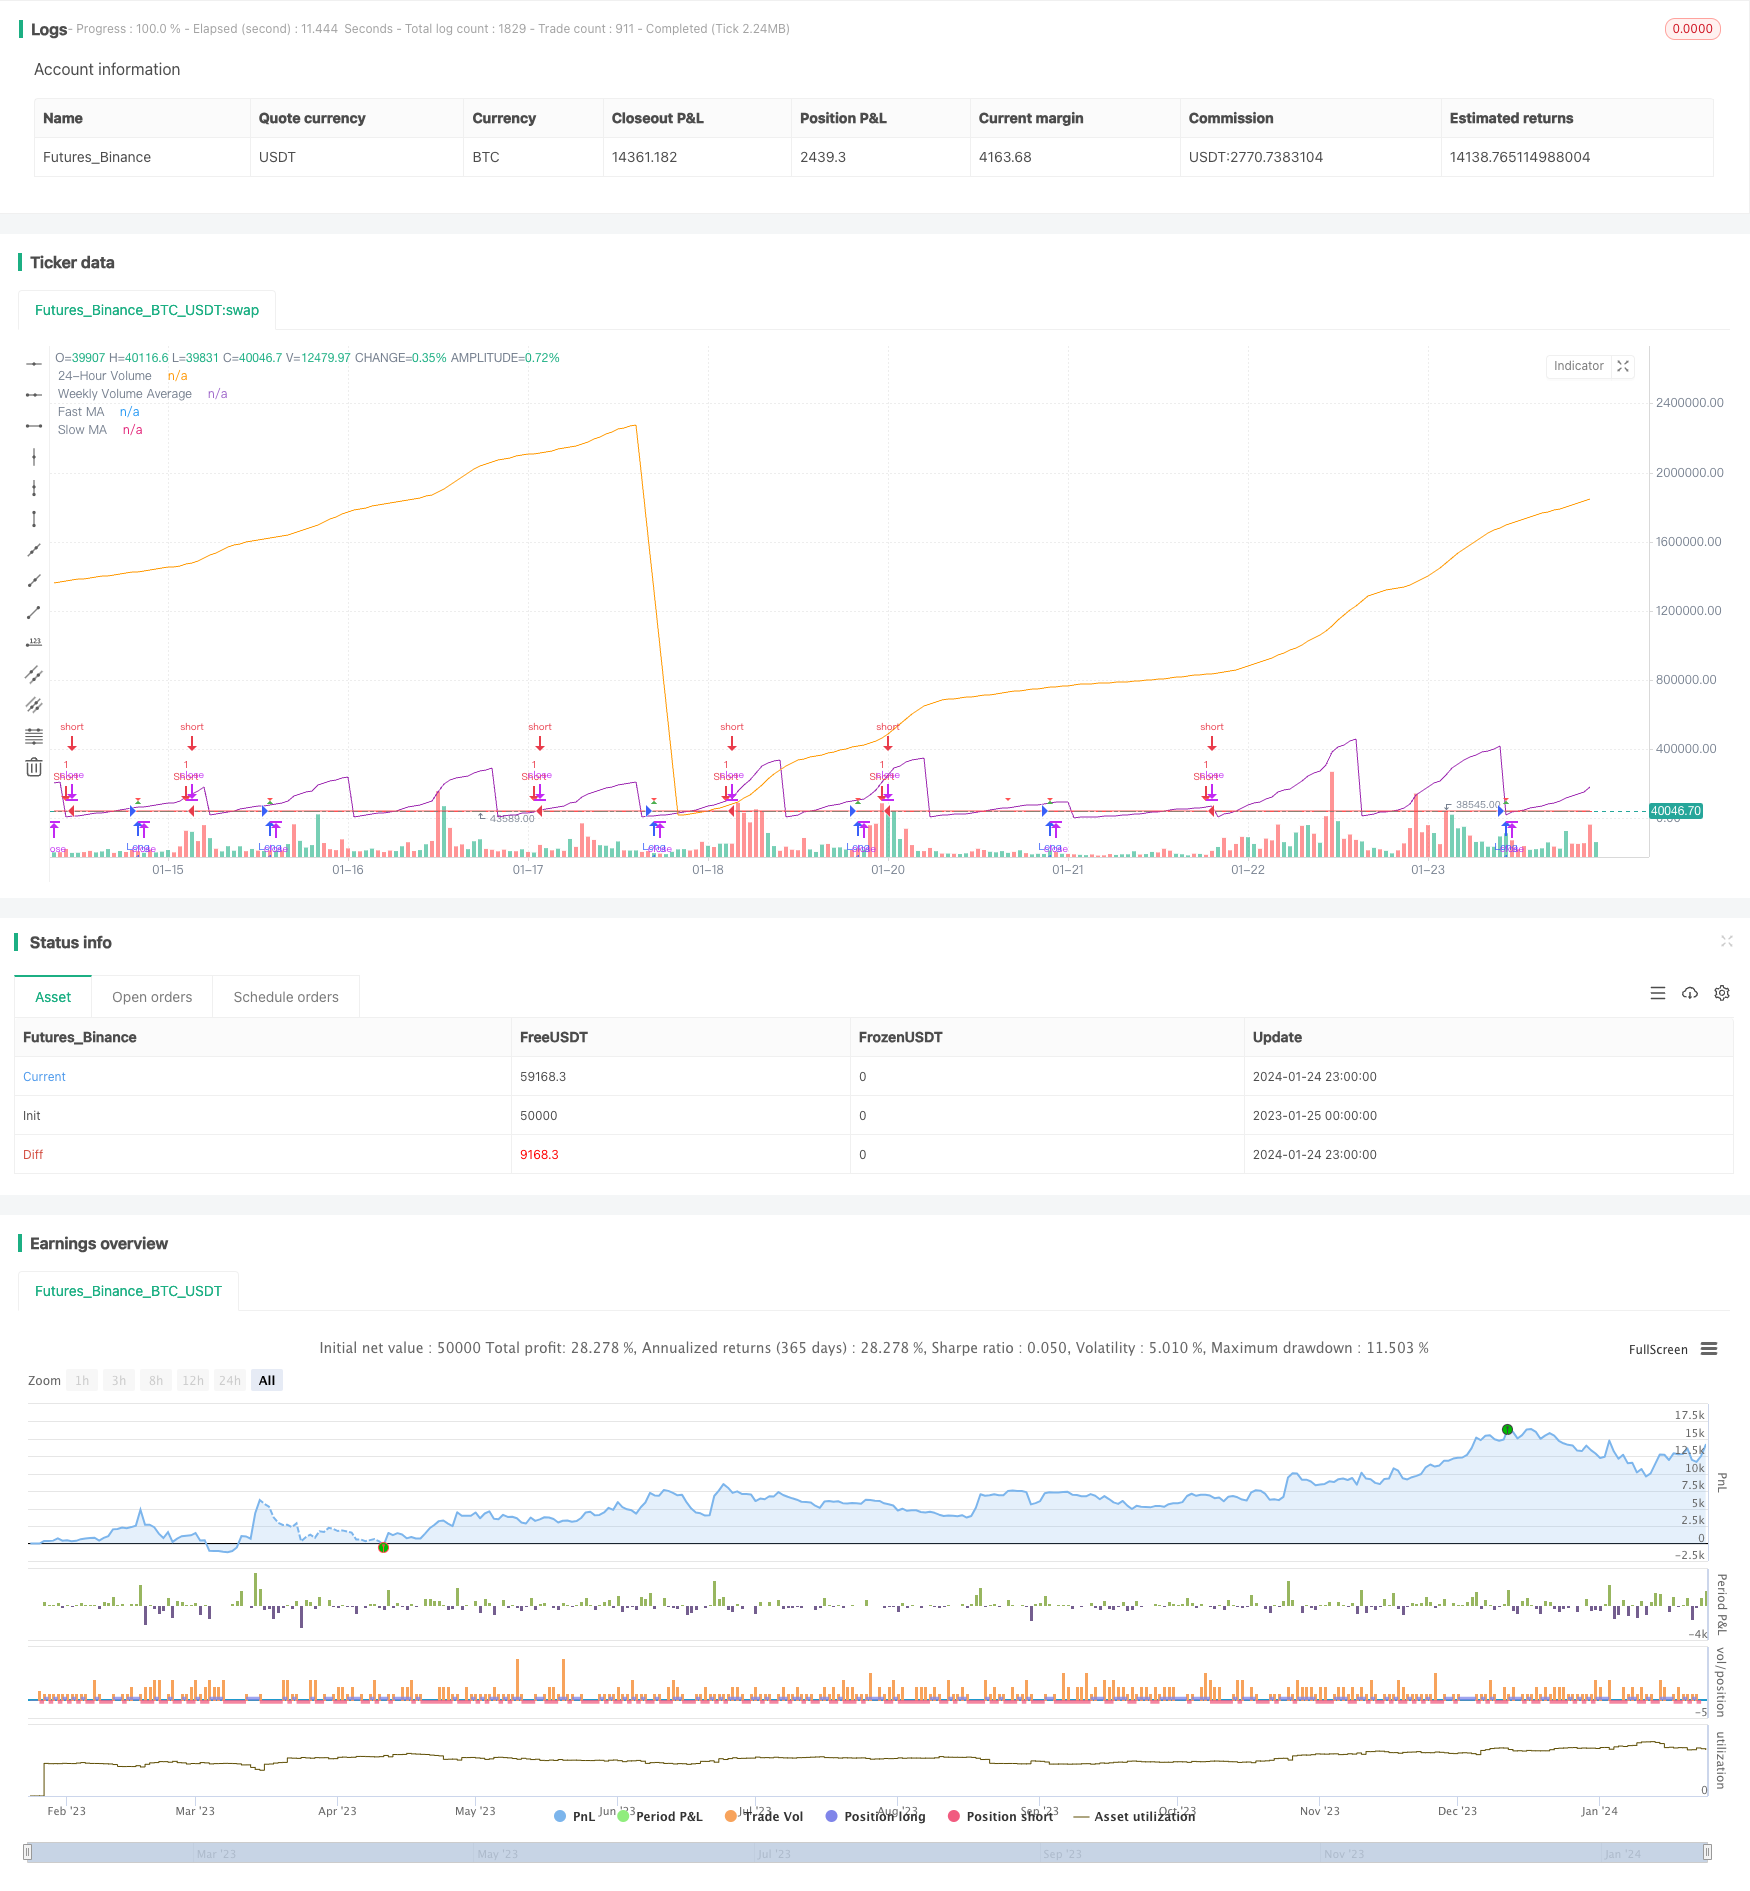
モメント移動平均クロスオーバー量子戦略
作者: リン・ハーンチャオチャン,日付: 2024-01-26 11時39分26秒タグ:

概要
この戦略は,移動平均値と取引量指標を組み合わせて,長期と短期入出規則を設計し,完全な定量的な取引戦略を形成します.
戦略原則
主要な指標
- 移動平均値:高速MA (青い線) と遅いMA (赤線)
- 容量:24時間容量 (紫) と7日平均容量 (オレンジ)
戦略条件
長期入国条件:
- 速度のMAは,ゆっくりしたMAを横切る
- 24時間の総量 7日平均総量の50%未満
短期入場条件:
速度のMAは,ゆっくりしたMAを下回る
入口と出口
ロングエントリー:長い条件が満たされたときに長い行く
短いエントリー:短い条件が満たされたときにショートに行く
利益を取って損失を止める:ロング ポジションの利益とストップ 損失のレベルが表示されます.
利点分析
- 価格とボリュームを組み合わせることで 偽のブレイクを避ける
- 明確な入国・退出規則
- リスクをコントロールするために利益とストップ・ロスを取る
リスク分析
- 移動平均戦略による頻繁な取引
- 容量データの質が信頼できない
- パラメータチューニングにおける過剰最適化
改善:
- 取引頻度を減らすために MA パラメータを調整する
- 複数のデータソースで信号を検証する
- 過剰な最適化防止のために厳格なバックテスト
オプティマイゼーションの方向性
- フィルター信号に他の指標を追加する
- ダイナミックな利益とストップ損失
- 安定性を向上させるための複数の時間枠分析
概要
この戦略は,M&Aとボリュームインジケーターを統合し,明確なエントリー条件,利益/ストップ損失,操作が簡単な完全な量子戦略を設計する.頻繁な取引問題を防ぐ必要性,ボリュームデータ品質と過剰最適化を監視する.次のステップは多変数最適化,ダイナミックTP/SLおよび複数のタイムフレーム分析である.
/*backtest
start: 2023-01-25 00:00:00
end: 2024-01-25 00:00:00
period: 1h
basePeriod: 15m
exchanges: [{"eid":"Futures_Binance","currency":"BTC_USDT"}]
*/

//@version=5
strategy("MA and Volume Strategy", overlay=true)

// Input parameters
fastLength = input(9, title="Fast MA Length")
slowLength = input(21, title="Slow MA Length")
volumePercentageThreshold = input(50, title="Volume Percentage Threshold")

// Calculate moving averages
fastMA = ta.sma(close, fastLength)
slowMA = ta.sma(close, slowLength)

// Calculate 24-hour volume and weekly volume average
dailyVolume = request.security(syminfo.tickerid, "D", volume)
weeklyVolumeAvg = ta.sma(request.security(syminfo.tickerid, "W", volume), 7)

// Strategy conditions
longCondition = ta.crossover(fastMA, slowMA) and dailyVolume < (weeklyVolumeAvg * volumePercentageThreshold / 100)
shortCondition = ta.crossunder(fastMA, slowMA)

// Set take profit and stop loss levels
takeProfitLong = close * 1.50
stopLossLong = close * 0.90

// Strategy orders
strategy.entry("Long", strategy.long, when=longCondition)
strategy.entry("Short", strategy.short, when=shortCondition)

// Plot moving averages
plot(fastMA, color=color.blue, title="Fast MA")
plot(slowMA, color=color.red, title="Slow MA")

// Plot 24-hour volume and weekly volume average
plot(dailyVolume, color=color.purple, title="24-Hour Volume", transp=0)
plot(weeklyVolumeAvg, color=color.orange, title="Weekly Volume Average")

// Plot entry signals
plotshape(series=longCondition, title="Buy Signal", color=color.green, style=shape.triangleup, size=size.small)
plotshape(series=shortCondition, title="Sell Signal", color=color.red, style=shape.triangledown, size=size.small)

// Plot take profit and stop loss levels only when a valid trade is active
plotshape(series=longCondition, title="Take Profit Long", color=color.green, style=shape.triangleup, size=size.small)
plotshape(series=longCondition, title="Stop Loss Long", color=color.red, style=shape.triangledown, size=size.small)
もっと
- 2年新高回転移動平均戦略
- 双向移動平均取引戦略
- 動的位置再バランス傾向追跡システム
- 日々のオープンリバース戦略
- ゴールデンクロス SMA トレーディング戦略
- ゴールデンクロス移動平均戦略
- MACD暗号取引戦略
- 線形回帰と二重移動平均の短期戦略
- ストカスティック・モメンタム戦略の三重重複
- モメント トレンド 戦略
- 2つの移動平均逆転とATRトライルストップの組み合わせ戦略
- マルティンゲールフューチャー取引戦略
- モメント・プルバック・戦略
- ダブルキャンドルスタイク予測 接近戦略
- ストカスティック・スーパートレンド・トラッキング・ストップ・ロスの取引戦略
- 戦略をフォローする二重逆転振動帯の傾向
- 3つの EMA,DMI,MACD を含むトレンドフォロー戦略