作者: リン・ハーンチャオチャン
タグ:
タグ:

概要
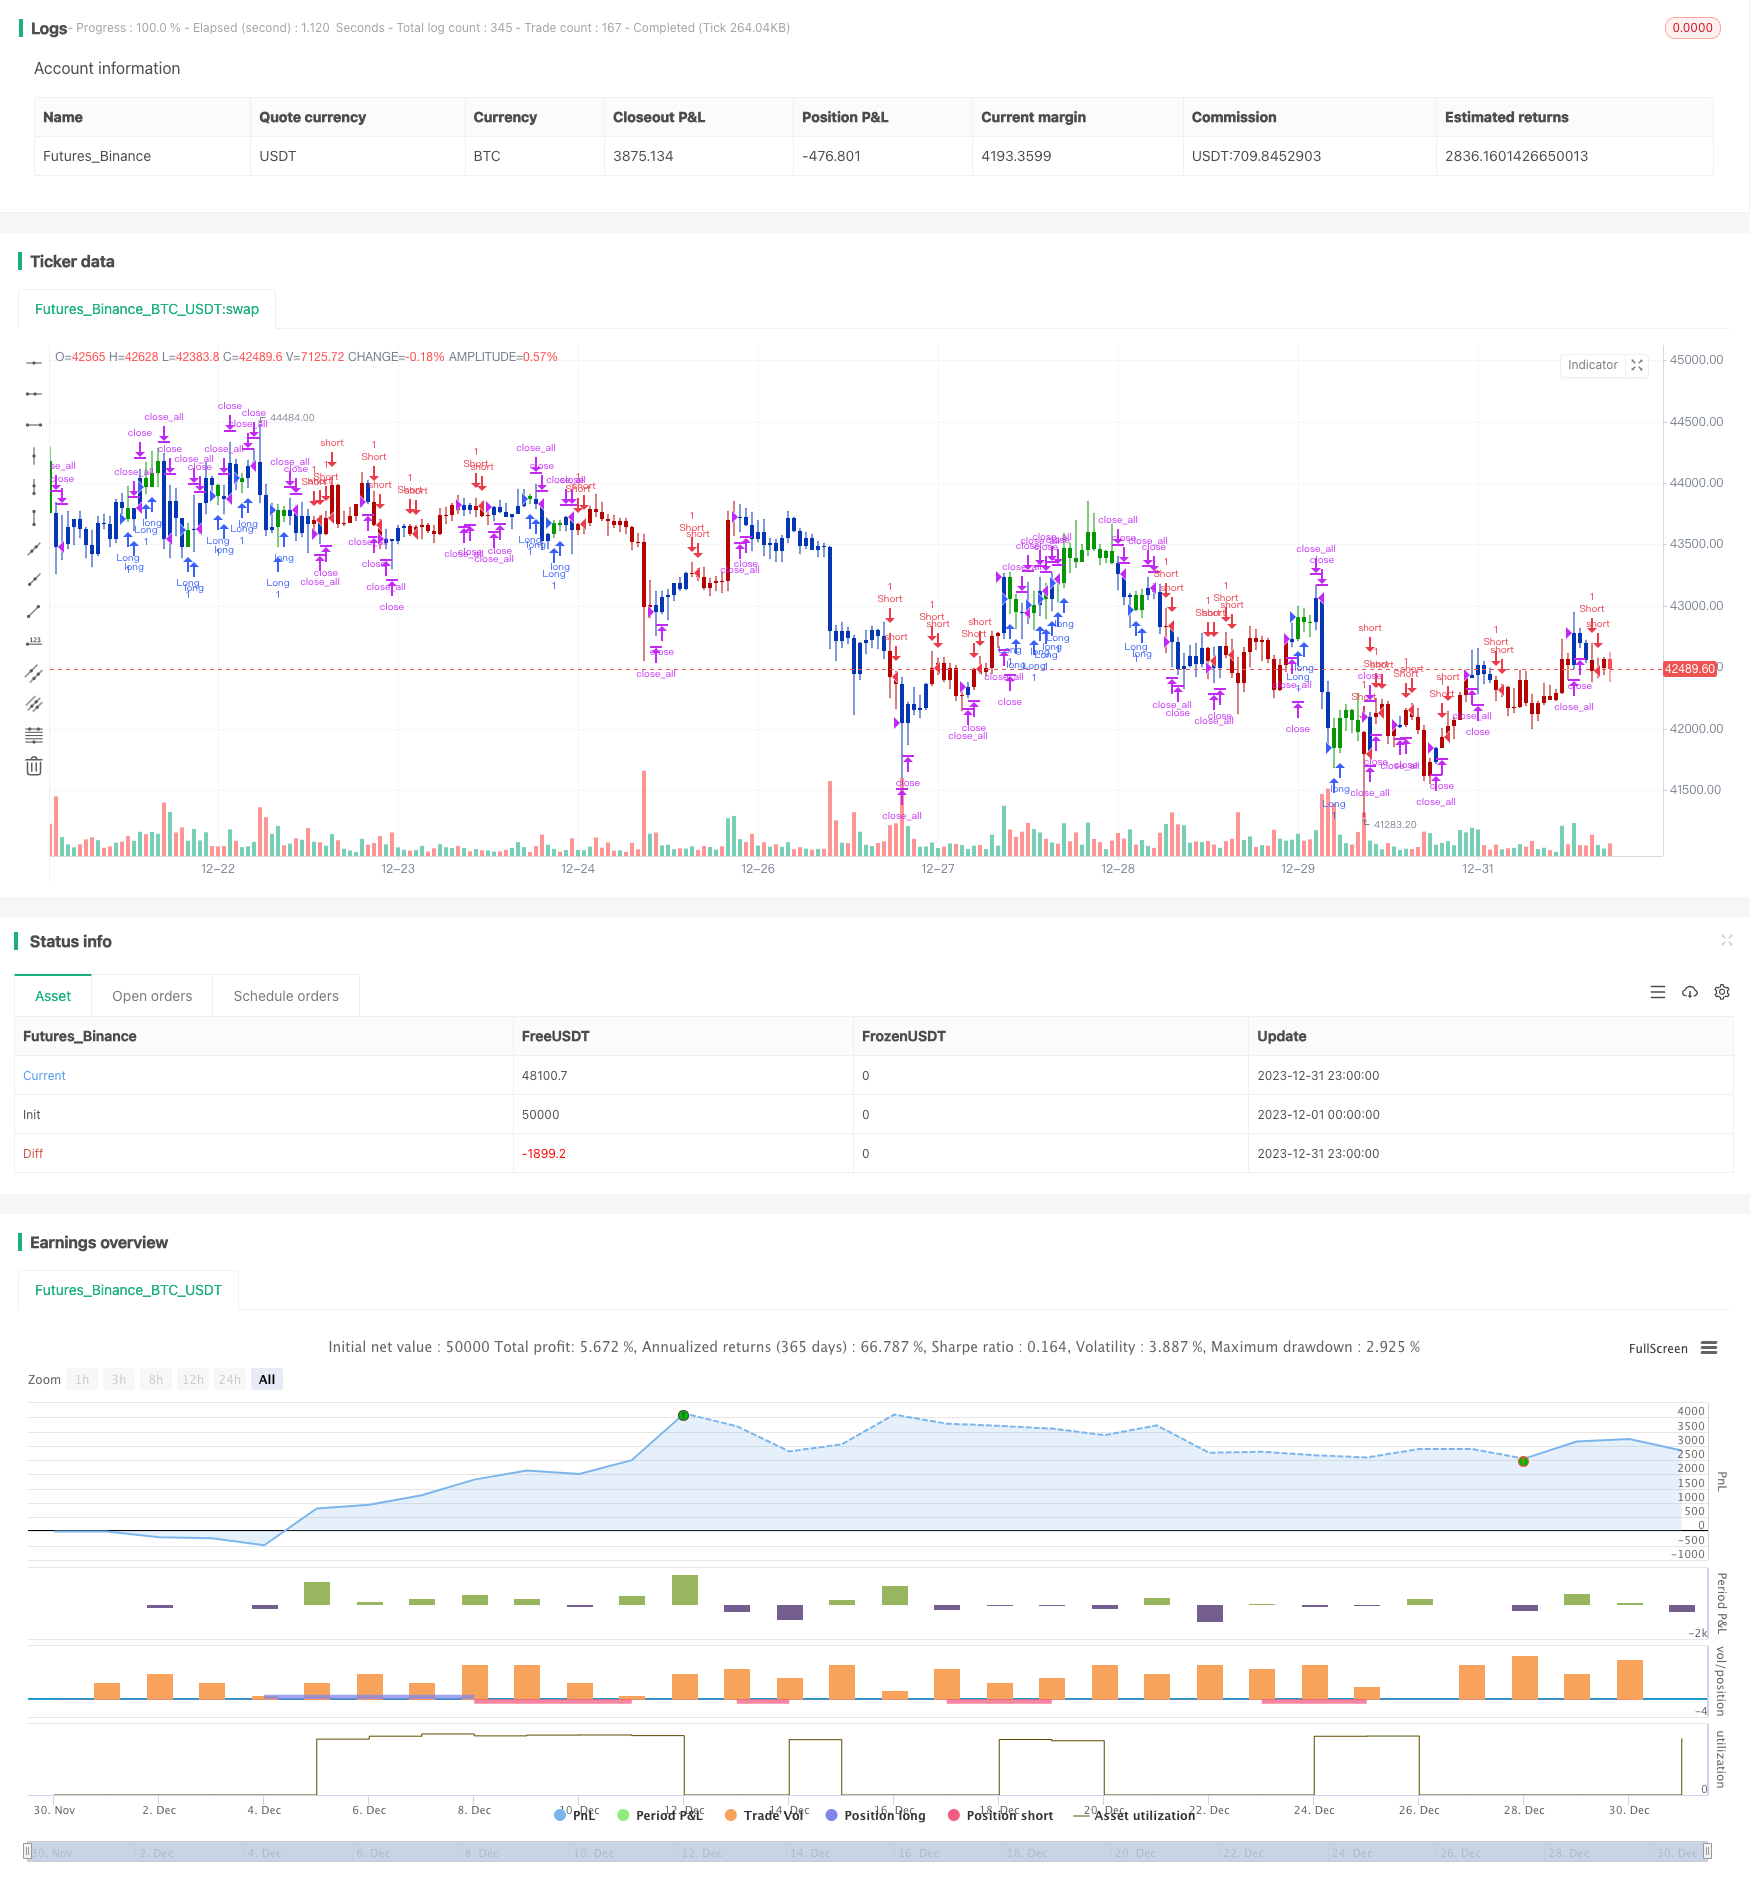
この戦略は,二重指数移動平均値と3つのウィリアムズ移動平均値を組み合わせて,包括的なトレンド追跡とトレンド逆転信号生成システムを形成する.優れた保持効率を持ち,誤った信号を効果的にフィルタリングすることができます.
戦略の論理
利点分析
リスク分析
オプティマイゼーションの方向性
結論
/*backtest
start: 2023-12-01 00:00:00
end: 2023-12-31 23:59:59
period: 1h
basePeriod: 15m
exchanges: [{"eid":"Futures_Binance","currency":"BTC_USDT"}]
*/

//@version=5
////////////////////////////////////////////////////////////
//  Copyright by HPotter v1.0 21/04/2022
// This is combo strategies for get a cumulative signal.
//
// First strategy
// This indicator plots 2/20 exponential moving average. For the Mov
// Avg X 2/20 Indicator, the EMA bar will be painted when the Alert criteria is met.
//
// Second strategy
// This indicator calculates 3 Moving Averages for default values of
// 13, 8 and 5 days, with displacement 8, 5 and 3 days: Median Price (High+Low/2).
// The most popular method of interpreting a moving average is to compare
// the relationship between a moving average of the security's price with
// the security's price itself (or between several moving averages).
//
//
// WARNING:
// - For purpose educate only
// - This script to change bars colors.
////////////////////////////////////////////////////////////
EMA20(Length) =>
    pos = 0.0
    xPrice = close
    xXA = ta.ema(xPrice, Length)
    nHH = math.max(high, high[1])
    nLL = math.min(low, low[1])
    nXS = nLL > xXA or nHH < xXA ? nLL : nHH
    iff_1 = nXS < close[1] ? 1 : nz(pos[1], 0)
    pos := nXS > close[1] ? -1 : iff_1
    pos


BWA3Lines(LLength,MLength,SLength,LOffset,MOffset,SOffset) =>
    pos = 0.0
    xLSma = ta.sma(hl2, LLength)[LOffset]
    xMSma = ta.sma(hl2, MLength)[MOffset]
    xSSma = ta.sma(hl2, SLength)[SOffset]
    pos := close < xSSma and xSSma < xMSma and xMSma < xLSma ? -1 :
    	     close > xSSma and xSSma > xMSma and xMSma > xLSma ? 1 : nz(pos[1], 0)
    pos

strategy(title='Combo 2/20 EMA & Bill Williams Averages. 3Lines', shorttitle='Combo', overlay=true)
var I1 = '●═════ 2/20 EMA ═════●'
Length = input.int(14, minval=1, group=I1)
var I2 = '●═════ 3Lines ═════●'
LLength = input.int(13, minval=1, group=I2)
MLength = input.int(8,minval=1, group=I2)
SLength = input.int(5,minval=1, group=I2)
LOffset = input.int(8,minval=1, group=I2)
MOffset = input.int(5,minval=1, group=I2)
SOffset = input.int(3,minval=1, group=I2)
var misc = '●═════ MISC ═════●'
reverse = input.bool(false, title='Trade reverse', group=misc)
var timePeriodHeader = '●═════ Time Start ═════●'
d = input.int(1, title='From Day', minval=1, maxval=31, group=timePeriodHeader)
m = input.int(1, title='From Month', minval=1, maxval=12, group=timePeriodHeader)
y = input.int(2005, title='From Year', minval=0, group=timePeriodHeader)
StartTrade = time > timestamp(y, m, d, 00, 00) ? true : false
posEMA20 = EMA20(Length)
prePosBWA3Lines = BWA3Lines(LLength,MLength,SLength,LOffset,MOffset,SOffset)
iff_1 = posEMA20 == -1 and prePosBWA3Lines == -1 and StartTrade ? -1 : 0
pos = posEMA20 == 1 and prePosBWA3Lines == 1 and StartTrade ? 1 : iff_1
iff_2 = reverse and pos == -1 ? 1 : pos
possig = reverse and pos == 1 ? -1 : iff_2
if possig == 1
    strategy.entry('Long', strategy.long)
if possig == -1
    strategy.entry('Short', strategy.short)
if possig == 0
    strategy.close_all()
barcolor(possig == -1 ? #b50404 : possig == 1 ? #079605 : #0536b3)
もっと
- 移動平均チャネルブレイク戦略
- 固定時間分断テスト戦略
- 時間と空間を最適化したマルチタイムフレームMACD戦略
- ストックRSIとMFIをベースにした量的な取引戦略
- 多指標複合取引戦略
- クロスオーバー EMA 短期取引戦略
- 動的ストップロスの戦略をフォローする傾向
- ブールマーケットのブレイク ダルバス・ボックス・バイ・戦略
- 相対的な動力戦略
- 波動傾向とVWMAベースの傾向
- アダプティブ・トリプル・スーパートレンド戦略
- 移動平均のクロスオーバー戦略
- 重要な逆転バックテスト戦略
- 3つのEMAストカスティックRSIクロスオーバーゴールデンクロス戦略
- 逆転キャンドルスタイクバックテスト戦略
- エーラースムーズストカスティックRSI戦略
- モメント・リバーサル・トレーディング・戦略