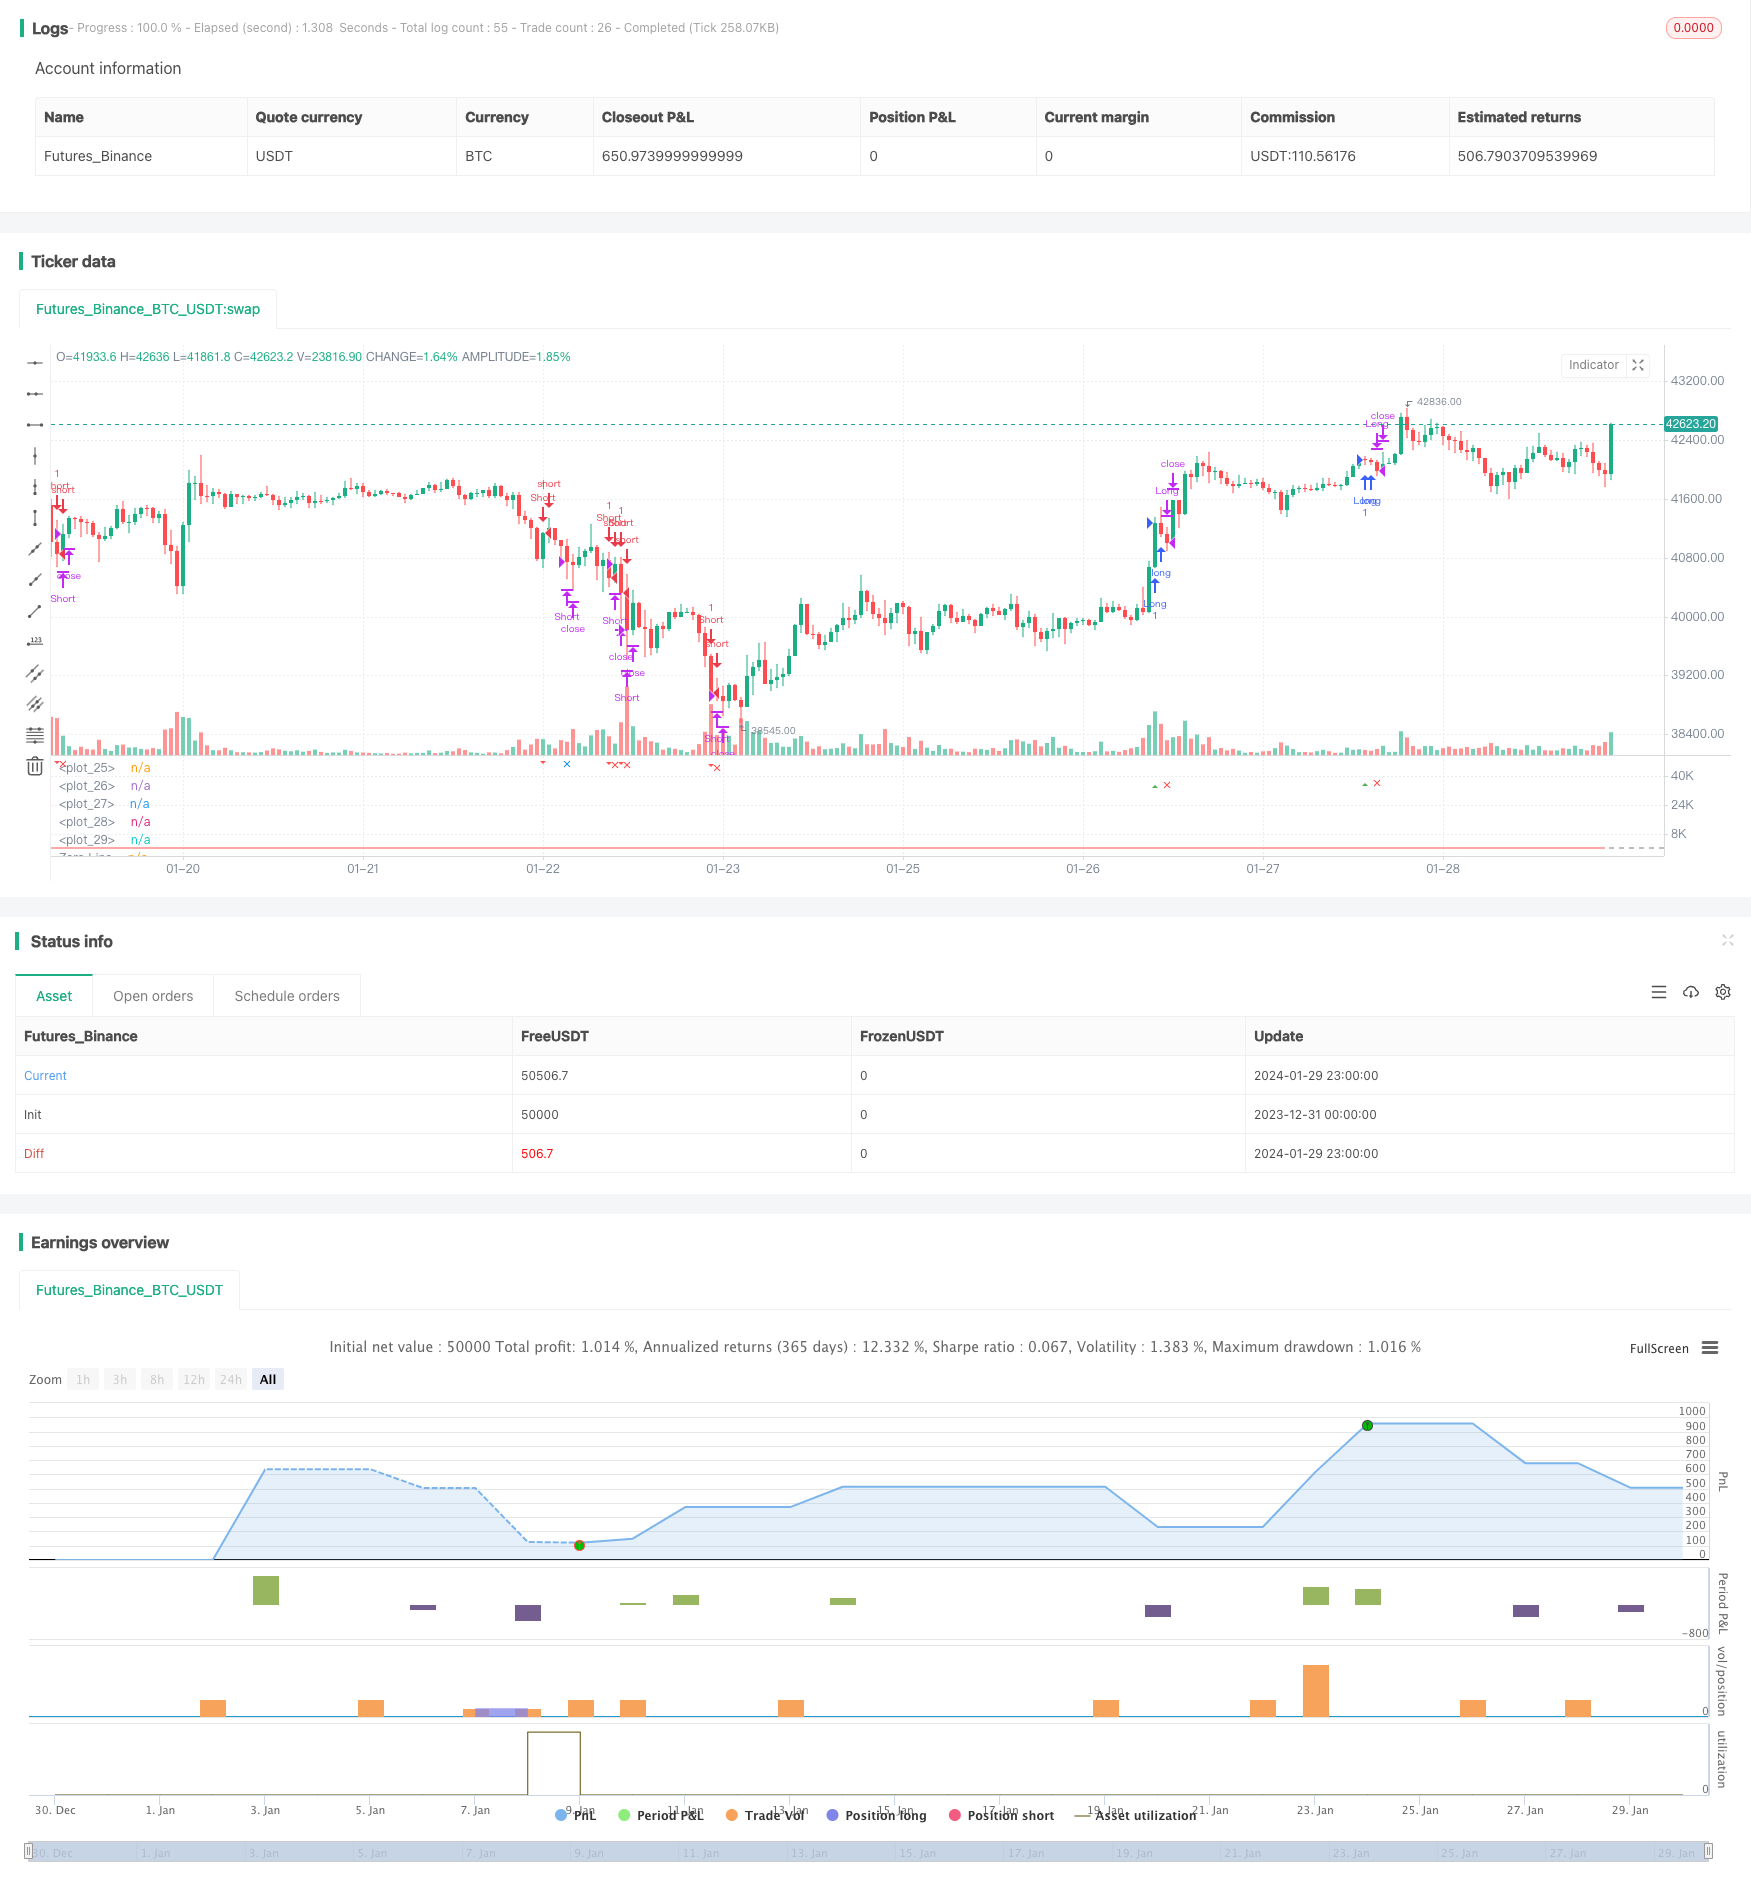
波動傾向を追跡する戦略の改善
作者: リン・ハーンチャオチャン,日付: 2024-01-31 15時35分41秒タグ:

概要: これはトレンドを特定するために波動トレンドオシレーターを使用するトレンドフォロー戦略である.波動トレンドラインをプロットするために平均価格と絶対価格差の指数的な移動平均を計算する.波動トレンドラインが過買い/過売りゾーンを横切るときに取引信号が生成される.移動平均値とボリュームの追加のフィルターは偽信号を避ける.
戦略論理:
-
平均価格ap = (高 + 低 + 閉じる)/3を計算する
-
エサを得るためにapの n 期間の EMA を計算する
-
ap と esa の絶対差の n 期間の EMA を計算し,d を得ます.
-
波動トレンドラインを計算する: ci = (ap - esa) /(0.015*d)
-
最終波動トレンドライン tci,すなわち wt1 を得るために ci の n 2 期 EMA を計算する.
-
wt1 の 4 期 SMA を計算して wt2 を得ます.
-
超買い/超売られたプロット レベルライン obLevel1/2 と osLevel1/2
-
wt1がobLevel2を超えると購入信号を生成します. wt1がosLevel2を下回ると販売信号を生成します.
-
移動平均 emaFilter とボリュームフィルター volumeFilter をフィルターとして追加して誤った信号を避ける
-
取引先の入場から出口までの利益/ストップ損失のセット
利点:
-
波動トレンドラインはトレンド/反トレンドの移行をうまく処理します
-
移動平均値とボリュームの二重フィルターにより信頼性が向上
-
複数のパラメータは,単一の指標の制限を回避する
-
利益/ストップ損失のロックとリスクのコントロール
リスク と 限界:
-
パラメータの選択は,性能の低下や過度に適性につながる可能性があります
-
最適なパラメータに関する最終的なガイドラインはありません
-
より広い市場条件を無視する
-
範囲限定市場/チャッピー市場におけるウィップサーのリスク
-
利益/ストップ損失以外の退出規則の欠如
増進 の 機会:
-
最適値を見つけるため,各時間枠/資産のテストパラメータ
-
低波動性体制を避けるため,波動性指標を組み込む
-
RSI のような指標を追加して信号の精度を向上させる
-
最適なパーメーターを見つけるために機械学習モデルを構築
-
トレイリングストップまたは波動性イベントに基づく出口で出口を強化する
結論は
波動トレンドラインは,波動トレンドラインのトレンド移行を識別する能力を活用し,移動平均値とボリュームフィルターを用い,偽信号を避けるため,ほとんどの中長期トレンドを把握することを目的としている.利益/ストップ損失を取ることはリスクを制御するために使用される.パラメータを最適化し,より多くの指標を追加し,機械学習などの技術によってより多くの楽器やタイムフレームのパフォーマンスを向上させる重要な機会がある.
/*backtest
start: 2023-12-31 00:00:00
end: 2024-01-30 00:00:00
period: 1h
basePeriod: 15m
exchanges: [{"eid":"Futures_Binance","currency":"BTC_USDT"}]
*/

//@version=5
strategy("Bush Strategy test", shorttitle="Nique Audi", overlay=false)

// Paramètres
n1 = input(10, title="Channel Length")
n2 = input(21, title="Average Length")
obLevel1 = input(60, title="Over Bought Level 1")
obLevel2 = input(53, title="Over Bought Level 2")
osLevel1 = input(-65, title="Over Sold Level 1")
osLevel2 = input(-60, title="Over Sold Level 2")
takeProfitPercentage = input(1, title="Take Profit (%)")
stopLossPercentage = input(0.50, title="Stop Loss (%)")

// Calculs
ap = hlc3
esa = ta.ema(ap, n1)
d = ta.ema(math.abs(ap - esa), n1)
ci = (ap - esa) / (0.015 * d)
tci = ta.ema(ci, n2)

wt1 = tci
wt2 = ta.sma(wt1, 4)

// Tracé des lignes
plot(0, color=color.gray)
plot(obLevel1, color=color.red)
plot(osLevel1, color=color.green)
plot(obLevel2, color=color.red, style=plot.style_line)
plot(osLevel2, color=color.green, style=plot.style_line)

plot(wt1, color=color.green)
plot(wt2, color=color.red, style=plot.style_line)

// Tracé de la différence entre wt1 et wt2 en bleu
hline(0, "Zero Line", color=color.gray)

// Conditions d'entrée long et court
longCondition = ta.crossover(wt1, obLevel2)
shortCondition = ta.crossunder(wt1, osLevel2)

// Tracé des signaux d'achat et de vente
plotshape(series=longCondition, style=shape.triangleup, location=location.belowbar, color=color.green, size=size.small, title="Buy Signal")
plotshape(series=shortCondition, style=shape.triangledown, location=location.abovebar, color=color.red, size=size.small, title="Sell Signal")

// Conditions d'entrée et de sortie
strategy.entry("Long", strategy.long, when=longCondition)
strategy.entry("Short", strategy.short, when=shortCondition)

// Niveaux de prise de profit pour les positions longues et courtes
longTakeProfitLevel = strategy.position_avg_price * (1 + takeProfitPercentage / 100)
shortTakeProfitLevel = strategy.position_avg_price * (1 - takeProfitPercentage / 100)

// Vérification si les niveaux de prise de profit sont atteints
longTakeProfitReached = strategy.position_size > 0 and high >= longTakeProfitLevel
shortTakeProfitReached = strategy.position_size < 0 and low <= shortTakeProfitLevel

// Tracé des formes de prise de profit
plotshape(series=longTakeProfitReached, style=shape.xcross, location=location.belowbar, color=color.blue, size=size.small, title="Take Profit Long")
plotshape(series=shortTakeProfitReached, style=shape.xcross, location=location.abovebar, color=color.blue, size=size.small, title="Take Profit Short")

// Niveaux de stop loss pour les positions longues et courtes
longStopLossLevel = strategy.position_avg_price * (1 - stopLossPercentage / 100)
shortStopLossLevel = strategy.position_avg_price * (1 + stopLossPercentage / 100)

// Vérification si les niveaux de stop loss sont atteints
longStopLossReached = strategy.position_size > 0 and low <= longStopLossLevel
shortStopLossReached = strategy.position_size < 0 and high >= shortStopLossLevel

// Tracé des formes de stop loss
plotshape(series=longStopLossReached, style=shape.xcross, location=location.belowbar, color=color.red, size=size.small, title="Stop Loss Long")
plotshape(series=shortStopLossReached, style=shape.xcross, location=location.abovebar, color=color.red, size=size.small, title="Stop Loss Short")

// Fermeture des positions en cas de prise de profit ou de stop loss
strategy.close("Long", when=longTakeProfitReached or longStopLossReached)
strategy.close("Short", when=shortTakeProfitReached or shortStopLossReached)
- ケープタウン 15分 キャンドルブレイク戦略
- 2つのATR後継停止戦略
- クルラマギの脱出追跡戦略
- ノロのトレンド・ムービング・平均値戦略の極端なバージョン
- リキュルシブ・モメンタム・トレーディング・戦略
- ドンチアン・トレンド 戦略を踏む
- SuperTrend RSI EMAクロスオーバー戦略
- 二国間3点移動平均量的な取引戦略
- RSIとMACD指標に基づく取引戦略
- CCIとEMAに基づくスケールピング戦略
- イチモクが戦略を
- 動向平均のクロスオーバーに基づく戦略をフォローする傾向
- RSI トレンド トレイリングストップロスの戦略
- 統合脱退戦略
- ダイナミック・トラッキング・ストップ・ロスの戦略
- 多期金回転追跡戦略
- 量子Wパターンのマスター戦略
- スーパートレンド BarUpDn 融合戦略
- ATRのトレンドトラッキング戦略を
- 移動平均線とレジスタンスレベルブレイクのクロスオーバー戦略