EMAのクロスオーバー取引戦略
作者: リン・ハーンチャオチャン, 日付: 2024-02-22 17時48分09秒タグ:

概要
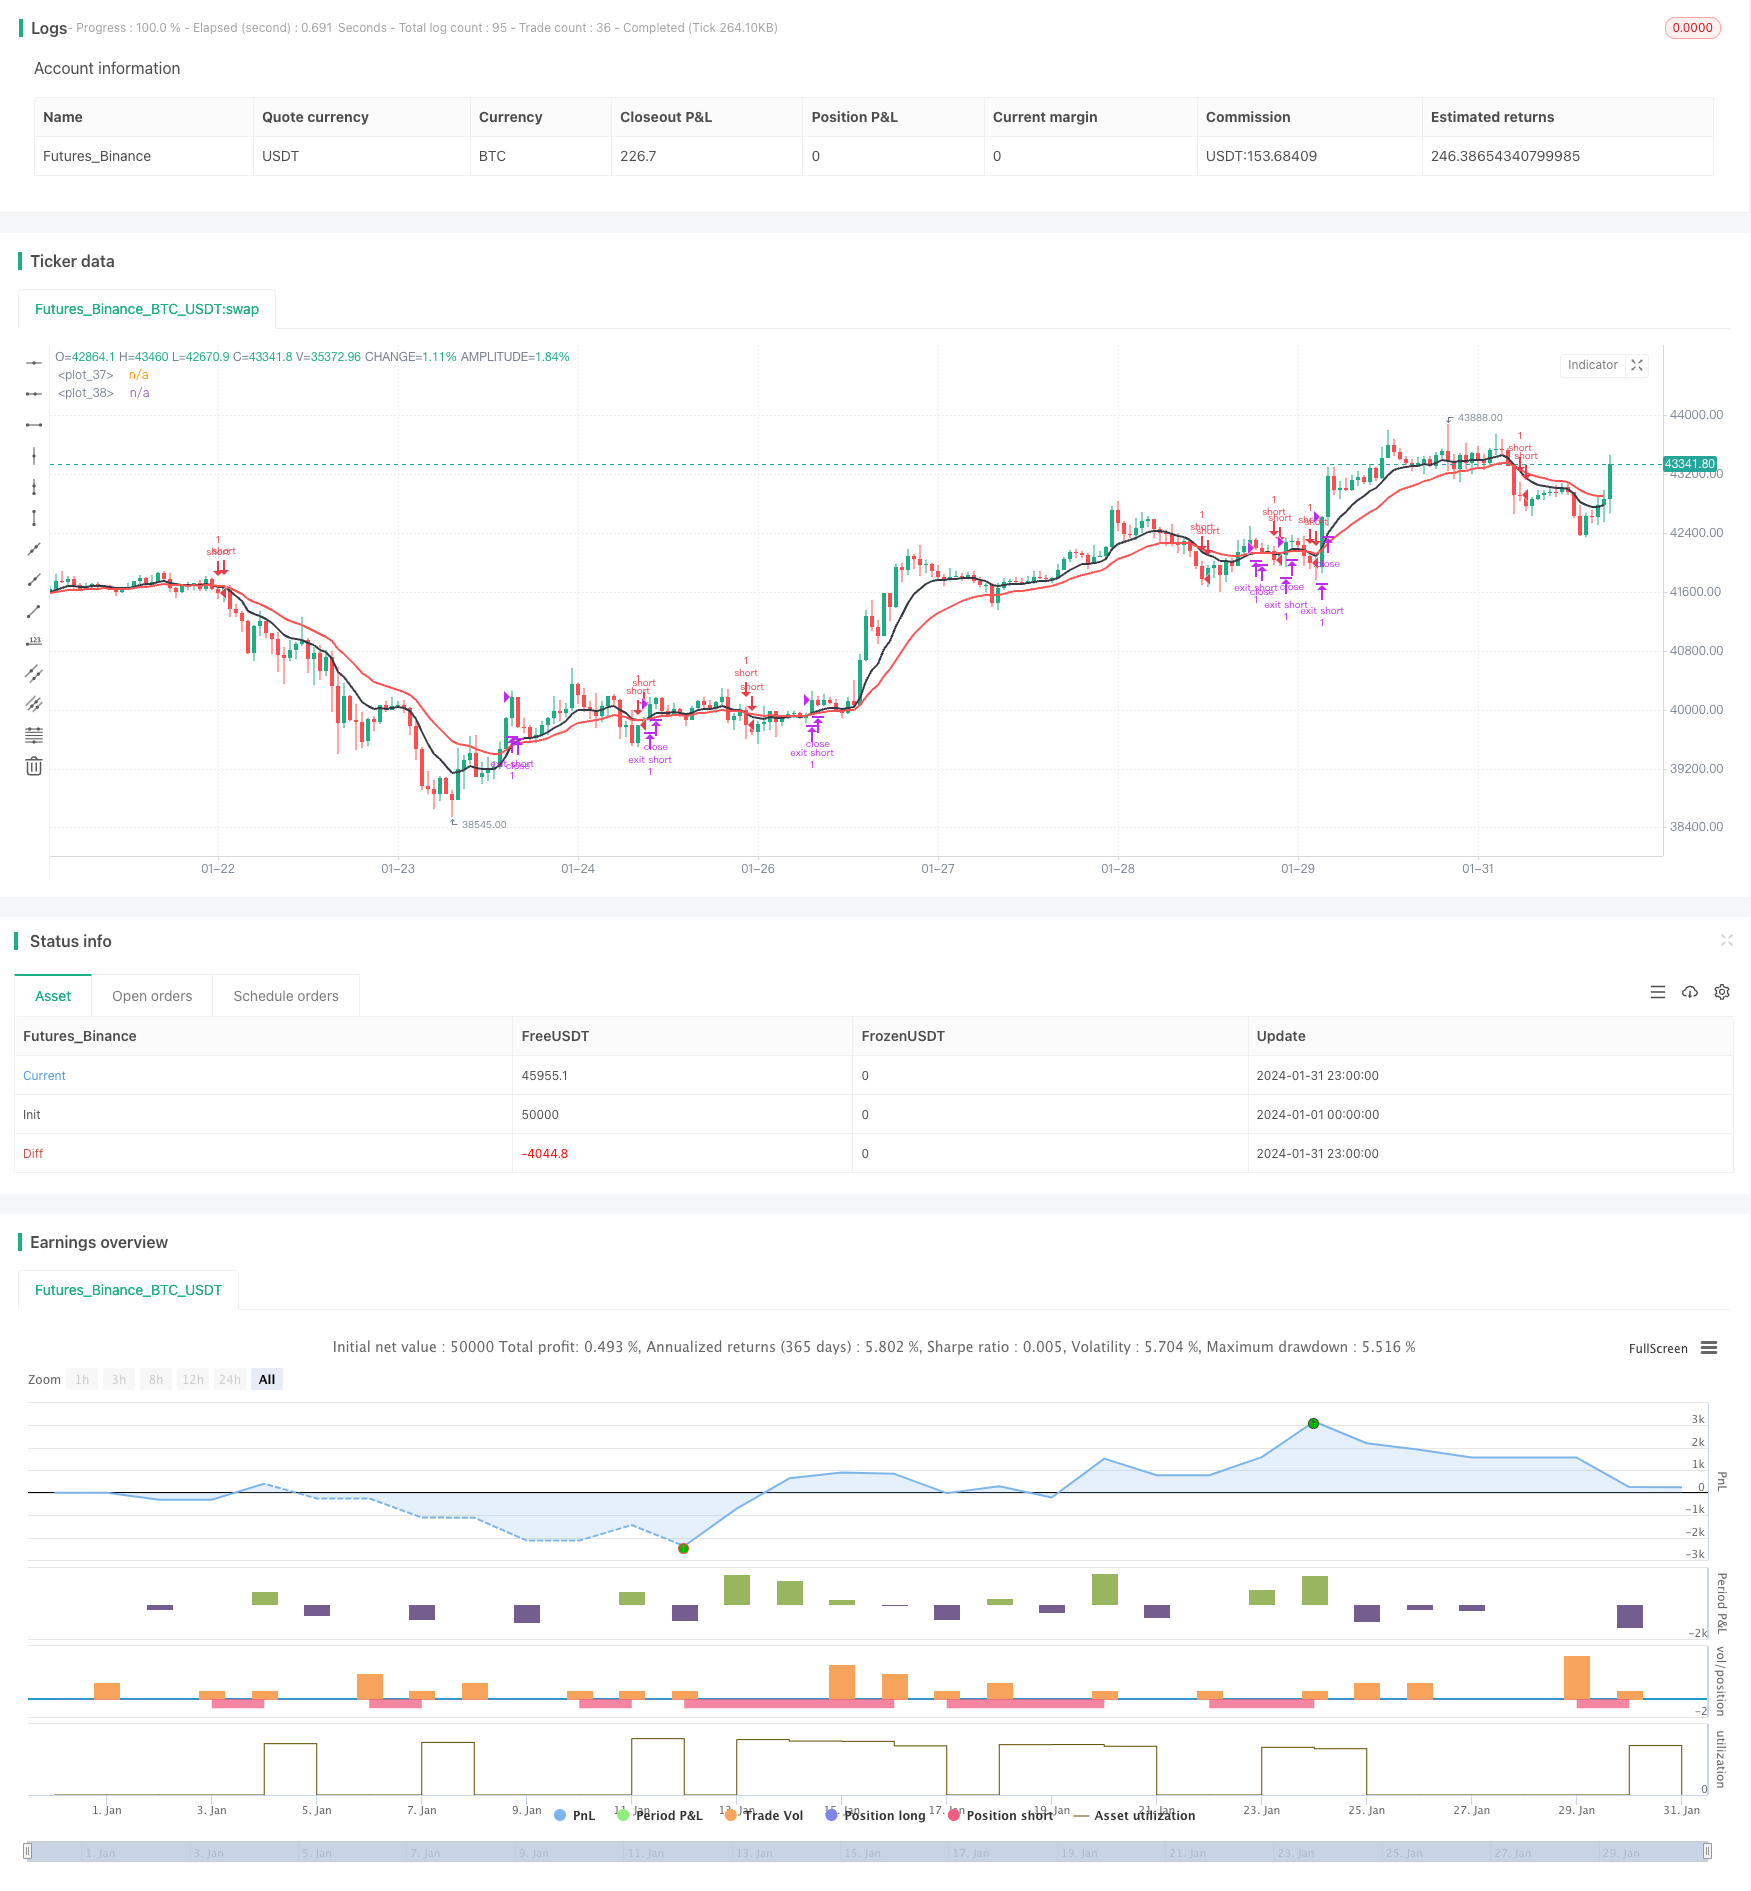
EMAクロスオーバー取引戦略は,異なる期間のEMAラインを計算し,そのクロスオーバー状況を検出することによって,買取・売却シグナルを生成する.より速いEMAがより遅いEMAを超えると,買取シグナルが生成される.より速いEMAがより遅いEMAを下回ると,販売シグナルが生成される.
戦略の論理
この戦略の核心は,デフォルト期間9の速いEMAと20の遅いEMAを含む異なる期間を持つ2つのEMAラインを計算することです.コードは,Pine Scriptで組み込まれたEMA関数を呼び,これらの2つのラインを計算します.その後,2つのEMAラインが交差するかどうかを検出することによって取引信号を生成します.特に,速いEMAが遅いEMAの上を横断した場合,購入信号がトリガーされます.速いEMAが遅いEMA以下を横断した場合,販売信号がトリガーされます.
クロスオーバー状況は,Pine Scriptに組み込まれたクロスオーバーとクロスアンダー関数を使用して検出される.クロスオーバー関数は,より速い EMAがより遅い EMAを上回るかどうかをチェックし,ブール値返します.クロスアンダー関数は,より速い EMAがより遅い EMAを下回るかどうかをチェックし,ブール値返します.これらの2つの関数の返し値に基づいて,コードは対応する購入または販売注文を送信します.
さらに,コードは,開始/終了日付を設定し,ロングまたはショート取引のみを制限するなどのいくつかの補助条件を提供します.これらの機能は,より洗練されたバックテストまたは最適化を行うのに役立ちます.
利点分析
この戦略の最大の利点は,非常にシンプルで直接的であり,理解し実行しやすいため,初心者が学ぶのに適しています.また,トレンドフォローインジケーターとして,移動平均値は,市場のトレンドを効果的に追跡し,勢いを利用して追加の利益を生むことができます.最後に,この戦略にはパラメータがほとんどなく,調整し最適化することが容易です.
リスク分析
この戦略が直面する主なリスクは,ウィップソー取引とトレンド逆転である. EMAラインは短期間の市場変動に敏感であり,誤った信号を生成し,不要な取引を誘発し,取引頻度とコストを増加させる可能性があります.一方,クロスオーバー信号が誘発すると,トレンドが逆転点に近づいており,取引がよりリスクが高い可能性があります.不適切なパラメータ設定は戦略のパフォーマンスにも影響を与えます.
EMA期間を調整したり,フィルターを追加したりなどの方法は,ウィップソーを減らすのに役立ちます.ストップ損失オーダーは単一の取引損失を制御します.パラメータ最適化は強度を改善します.しかし,いかなる取引戦略も完全に損失を回避することはできません.したがって,リスクを負う準備が必要です.
最適化 の 機会
この戦略は,次の側面で改善できます.
- 最適なパラメータセットを見つけるために EMA 期間を最適化
- MACD,RSIのような指標をフィルターとして追加して偽信号を減らす
- 傾向の逆転を避けるために傾向指標を組み込む
- 基本要素に基づいて株式を選択する
- 位置サイズ調整,ATRに基づいて停止設定
結論
EMAクロスオーバーは,シンプルで効果的なトレンドフォロー戦略である.EMAクロスを利用して取引信号を生成し,価格動向を自動的に把握する.この理解しやすい調整可能な戦略は,初心者が学ぶのに最適である.より複雑な戦略にも統合できる.しかし,すべての戦略にはリスクがあり,慎重な管理が必要である.最適化と豊かにする市場状況の継続的な改善により,この戦略がより堅牢になる.
/*backtest
start: 2024-01-01 00:00:00
end: 2024-01-31 23:59:59
period: 1h
basePeriod: 15m
exchanges: [{"eid":"Futures_Binance","currency":"BTC_USDT"}]
*/

// This source code is subject to the terms of the Mozilla Public License 2.0 at https://mozilla.org/MPL/2.0/
// This strategy has been created for illustration purposes only and should not be relied upon as a basis for buying, selling, or holding any asset or security.
// © kirilov

//@version=4
strategy(
     "EMA Cross Strategy",
     overlay=true,
     calc_on_every_tick=true,
     currency=currency.USD
     )

// INPUT:

// Options to enter fast and slow Exponential Moving Average (EMA) values
emaFast = input(title="Fast EMA", type=input.integer, defval=9, minval=1, maxval=9999)
emaSlow = input(title="Slow EMA", type=input.integer, defval=20, minval=1, maxval=9999)

// Option to select trade directions
tradeDirection = input(title="Trade Direction", options=["Long", "Short", "Both"], defval="Both")

// Options that configure the backtest date range
startDate = input(title="Start Date", type=input.time, defval=timestamp("01 Jan 1970 00:00"))
endDate = input(title="End Date", type=input.time, defval=timestamp("31 Dec 2170 23:59"))


// CALCULATIONS:

// Use the built-in function to calculate two EMA lines
fastEMA = ema(close, emaFast)
slowEMA = ema(close, emaSlow)


// PLOT:

// Draw the EMA lines on the chart
plot(series=fastEMA, color=color.black, linewidth=2)
plot(series=slowEMA, color=color.red, linewidth=2)


// CONDITIONS:

// Check if the close time of the current bar falls inside the date range
inDateRange = true

// Translate input into trading conditions
longOK  = (tradeDirection == "Long") or (tradeDirection == "Both")
shortOK = (tradeDirection == "Short") or (tradeDirection == "Both")

// Decide if we should go long or short using the built-in functions
longCondition = crossover(fastEMA, slowEMA)
shortCondition = crossunder(fastEMA, slowEMA)


// ORDERS:

// Submit entry (or reverse) orders
if (longCondition and inDateRange)
    strategy.entry(id="long", long=true, when = longOK)
if (shortCondition and inDateRange)
    strategy.entry(id="short", long=false, when = shortOK)

// Submit exit orders in the cases where we trade only long or only short
if (strategy.position_size > 0 and shortCondition)
    strategy.exit(id="exit long", stop=close)
if (strategy.position_size < 0 and longCondition)
    strategy.exit(id="exit short", stop=close)
- 戦略をフォローするSMAシステム傾向
- 複数の時間枠のRSI取引戦略
- 動向平均のクロスオーバーに基づく戦略をフォローする傾向
- 双 EMA ゴルデンクロス 長期戦略
- ダイナミック回帰チャネル戦略
- 逆転勢力のブレイクアウト戦略
- トリプル・ダイナミック・ムービング・平均トレンド・トラッキング戦略
- モメントブレイク EMAクロスオーバー戦略
- トレーディング・ダイナミック・トレンド・トラッキング・戦略
- MACDモメントとMA戦略
- RSI をベースにした単純な暗号通貨取引戦略
- 価格クロスオーバーとSMAをベースにした量的な取引戦略
- ストップ・ロストとテイク・プロフィートと2重移動平均クロスオーバー戦略
- 勢いを追跡し,傾向戦略
- MA線に基づく戦略をフォローする傾向
- トレンドフォローする戦略 ボリンジャー帯に基づく戦略
- 振動 的 突破 戦略
- アダプティブ・ムービング・平均取引戦略
- RSI ゴールデンクロスショート戦略
- 2つの移動平均値とボリンジャー帯の組み合わせ トレンド追跡戦略